Accepted: 4 January 2018 DOI: 10.1111/srt.12442
ORIGINAL ARTICLE
A novel image processing workflow for the in vivo quantification of skin microvasculature using dynamic optical coherence tomography D. Zugaj1 | A. Chenet2 | L. Petit1 | J. Vaglio1 | T. Pascual1 | C. Piketty1 | V. Bourdes1 1 Nestlé Skin Health-Galderma R&D, Sophia Antipolis, Biot, France
Abstract
2
Background: Currently, imaging technologies that can accurately assess or provide
Thales, Sophia Antipolis, Biot, France
Correspondence Didier Zugaj, Nestlé Skin Health-Galderma R&D, Sophia Antipolis, Biot, France. Email:
[email protected] Funding information Nestlé Skin Health-Galderma R&D
surrogate markers of the human cutaneous microvessel network are limited. Dynamic optical coherence tomography (D-OCT) allows the detection of blood flow in vivo and visualization of the skin microvasculature. However, image processing is necessary to correct images, filter artifacts, and exclude irrelevant signals. The objective of this study was to develop a novel image processing workflow to enhance the technical capabilities of D-OCT. Materials and methods: Single-center, vehicle-controlled study including healthy volunteers aged 18-50 years. A capsaicin solution was applied topically on the subject’s forearm to induce local inflammation. Measurements of capsaicin-induced increase in dermal blood flow, within the region of interest, were performed by laser Doppler imaging (LDI) (reference method) and D-OCT. Results: Sixteen subjects were enrolled. A good correlation was shown between D-OCT and LDI, using the image processing workflow. Therefore, D-OCT offers an easy-to-use alternative to LDI, with good repeatability, new robust morphological features (dermal-epidermal junction localization), and quantification of the distribution of vessel size and changes in this distribution induced by capsaicin. The visualization of the vessel network was improved through bloc filtering and artifact removal. Moreover, the assessment of vessel size distribution allows a fine analysis of the vascular patterns. Conclusion: The newly developed image processing workflow enhances the technical capabilities of D-OCT for the accurate detection and characterization of microcirculation in the skin. A direct clinical application of this image processing workflow is the quantification of the effect of topical treatment on skin vascularization. KEYWORDS
dynamic optical coherence tomography, image processing workflow, in vivo blood flow detection, laser Doppler imaging, skin vascularization, topical treatment, vessel size distribution, visualization
This is an open access article under the terms of the Creative Commons Attribution-NonCommercial-NoDerivs License, which permits use and distribution in any medium, provided the original work is properly cited, the use is non-commercial and no modifications or adaptations are made. © 2018 The Authors. Skin Research and Technology Published by John Wiley & Sons Ltd Skin Res Technol. 2018;1–11.
wileyonlinelibrary.com/journal/srt | 1
|
DIDIER et al.
2
1 | INTRODUCTION
2 | MATERIALS AND METHODS
Optical coherence tomography (OCT) is a non-invasive imaging tech-
2.1 | Study design
nique allowing the real-time cross-sectional evaluation of biological tissues and providing real-time 2-dimensional (2-D) or 3-dimensional (3-D) images.1-4 OCT is suitable for the objective assessment of therapeutic effects and the observation of skin changes over time.5 This technique has been widely used in an array of medical domains for both research and clinical practice.5 Since its introduction to the field of dermatology in 1997, OCT has been increasingly employed in clinical skin research.6,7 Its non-invasive and time-efficient approach ensures the accurate evaluation of skin disease, while eliminating patient discomfort.8 Currently, there are limited imaging technologies available that can accurately assess or provide surrogate markers of the human cutaneous microvessel network. Speckle variance (SV) OCT, termed dynamic OCT (D-OCT), allows the detection of blood flow in vivo and visualization of the skin microvasculature. The technology is based on repeating OCT scans and analyzing the SV of the OCT signal. This technique
This was a single-center, vehicle-controlled study including healthy volunteers aged 18-50 years. A capsaicin solution and its vehicle were applied topically on the subject’s forearm to induce local neurogenic inflammation. There was no direct benefit or anticipated safety concern for the participating subjects. This study was conducted in accordance with the principles of the Declaration of Helsinki and Good Clinical Practices, and in compliance with local regulatory requirements. It was approved by an institutional review board and all subjects provided written informed consent prior to study procedures.
2.2 | Sample size determination A sample size of 16 subjects was considered sufficient for this study.
may be used as a tool to detect regions of the OCT images which have
2.3 | Treatment
changed between these successive scans. D-OCT allows the visualiza-
Subjects attended 2 screening visits (ie, general medical and evalua-
tion of vascular networks in the dermis up to a depth of 1.5-2 mm and a resolution of 3-15 μm.1-3 D-OCT can be viewed as an angiographic variation of OCT. The technique combines conventional OCT images with flow data to produce images of the in vivo microvasculature in the skin.9 The thickness of the epidermis exhibits variability at different areas of the human body. Thus, D-OCT images of blood vessels come into view at different depths beneath the surface of the skin. In cross-sectional D- OCT images, the dermal papillary loops can be recognized as small dots distributed in close proximity of the dermal-epidermal junction (DEJ). In the horizontal view (ie, 2-D image as function of depth), D-OCT images display well-organized vascular patterns. However, raw blood flow data are associated with a low signal-to-noise ratio (SNR). Therefore, it is necessary to perform image processing to correct images, filter artifacts,
tion of response to capsaicin). Only capsaicin responders (ie, ≥100% increase in dermal blood flow) were eligible to participate in the study. The third visit (treatment) involved the application of capsaicin solution (1000 μg/20 μL) and its vehicle in 2 rubber O-rings (1-cm diameter) (region of interest) placed on the subject’s forearm. A 3:3:4 mixture of Tween-20 (polysorbate-20), ethanol and water was used as the vehicle for capsaicin. Treatment with vehicle was performed to ensure that the increase in dermal blood flow was induced by the active ingredient of the capsaicin solution rather than being the result of an allergic reaction to the excipients (Tween-20, ethanol, and water).
2.4 | Assessments
exclude irrelevant signals, and allow the accurate quantification/charac-
Measurements of capsaicin-induced increase in dermal blood flow,
terization of the observed vascular network. In recent years, investiga-
within the region of interest, were performed by LDI (used as a ref-
tions have been conducted on image processing for the quantification of
erence method) prior to capsaicin application and approximately
blood flow.10-12
every 10 minutes after application for a total of 60 minutes. LDI
The objective of the scientific endeavor described herein was
measurements were performed both at the region of interest and
to develop and apply a novel dedicated image processing workflow,
surrounding area (3 × 3 cm) to evaluate secondary vasodilation or
which will enhance the technical capabilities of D-OCT in the vascular
flare.
network of the skin and characterization of its spatial distribution. A clinical study, applying this new methodology, was conducted to:
Similarly, measurements using D-OCT were performed prior to capsaicin application and after the last dermal blood flow assessment in order to explore the vascularization of the skin.
1. visualize skin microvasculature using D-OCT and assess the vascular patterns as described previously9; 2. quantify the skin microvasculature and address the main challenges
Safety assessments included the recording of adverse events (AEs) and evaluation of local tolerability by visual examination of the forearms.
encountered in D-OCT such as motion artifacts and low SNR; 3. evaluate the D-OCT technology in comparison with laser Doppler imaging (LDI) which was used as a reference method; 4. assess the increase in dermal blood flow (vasodilation) induced by topical application of capsaicin, as previously demonstrated.13
2.5 | Statistical analysis Analysis of variance (ANOVA) was performed to evaluate differences between data groups.
|
3
DIDIER et al.
2.6 | Equipment 2.6.1 | LDI device specifications LDI is an established method for microvascular assessment, enabling rapid non-invasive analysis of blood flow patterns in skin.14,15 This technology provides continuous and accurate measurements. The principles and technical aspects of this method have been described previously.16-18 The perfusion is defined as the concentration of moving blood cells × the mean velocity of these blood cells. The concentration is related to the magnitude of the Doppler signal, whereas the velocity is related to the frequency shift. However, the main limitation of this method is the lack of information on the distribution of blood flow perfusion over depth. The device used in this study for LDI assessment was the commercially available PeriScan PIM 3 Laser Doppler Blood Perfusion Imager (Perimed AB, Stockholm, Sweden). The technical specifications of this device have been described previously.16
3 | RESULTS 3.1 | Subjects A total of 16 healthy male volunteers were enrolled in this study. The study was conducted in Belgium from 26 May to 11 July 2016. IMAGE PROCESSING WORKFLOW The steps of the newly developed image processing workflow presented in this article are discussed in detail below (Table 1).
3.2 | Skin surface correction Due to the curved surface of the skin, it is necessary to perform corrections to obtain an image of blood flow intensity as a function of depth below the surface of the skin. For this purpose, the input volume is analyzed using a 2-phase process. Firstly, the most likely candidates in each A-scan are evaluated using a custom weighted skin edge detection filter, followed by a selection process to identify the
2.6.2 | D-OCT device specifications The device used in this study for D-OCT assessment was the commercially available, handheld VivoSight OCT scanner (Michelson Diagnostics, Kent, UK). The technical specifications of this device have been described previously.9 A multislice scan modality was used, consisting of 120 B-scans (xz-plane) separated by 50.4 μm in the y direction. The VivoSight scanner probe is equipped with a microcamera providing the user with a real-time, colored, and magnified view of the skin area of interest. The monitoring software was configured to provide an optimal trade-off between the 3-D image resolution of
T A B L E 1 Steps of the image processing workflow Skin surface correction Stack filtering Identification of the dermal-epidermal junction Artifact detection Extraction of the maximum changes and maximum value of blood flow distribution Filtering by blocs
the observed area (6 × 6 mm) and the duration of the acquisition (ap-
Vessel enhancement
proximately 30 seconds per acquisition). The acquired 3-D OCT image
Quantification of the blood vessel network
is composed of 460 pixels in depth (z) × 1356 pixels in the fast scan
Vessel segmentation
(x direction) per 120 slices (y direction). Two 3-D (or volume) images are simultaneously generated by the device, namely the classical (or
Quantification of blood flow on binary mask related to vessel segmentation
structural) OCT and the blood flow OCT (Figure 1).
Determination of vessel size distribution
F I G U R E 1 3-D images simultaneously generated by the VivoSight device: Structural OCT and blood flow OCT. The acquired 3-D OCT image is composed of 460 pixels in depth (z) × 1356 pixels in the fast scan (x direction) per 120 slices (y direction). Two 3-D (or volume) images are simultaneously generated by the device, namely the classical (or structural) OCT and the blood flow OCT. 3-D, 3-dimensional; OCT, optical coherence tomography
|
DIDIER et al.
4
skin surface profile from the likeliest candidate in each image column.
artifacts from the blood flow distribution, considering the absence of
The complete pseudo-code of this part is provided in Appendix A.
vessels in the epidermis. Subsequently, a weighted average filtering al-
Subsequently, a correction in terms of depth is applied on the input
gorithm by blocs is processed. This permits the construction of a 2-D
volume.
image including all information related to the vascular network.
3.3 | Stack filtering
3.3.1 | Identification of the DEJ
Normal skin is richly supplied with blood through a vascular network
An estimation of the epidermis thickness is conducted by averaging
composed of microvessels extending from the papillary dermis to the
the intensity profiles of corrected structural OCT A-scans. The posi-
mid-deep dermis, with the occasional presence of arterioles. Various
tion of each locally maximum peak corresponding to the position of
intrinsic and extrinsic factors may influence the structure of the skin
changes in tissue characteristics represents the boundary between 2
and hence, the appearance of vessels in D-OCT images may vary be-
different layers. Forward back reflection from the stratum corneum
tween different areas of the human body.
results in a high-intensity signal that provides the first peak. The sec-
An automatic image processing filtering scheme—based on the
ond peak is caused by the reflection of dermal fibers.
identification of different depths characterizing the DEJ and the vascu-
A generalized regression neural network (GRNN) was employed
lar network—was developed and customized to be applied in this con-
as a flexible and robust mathematical tool for curve fitting in the
text. The estimation of the epidermal thickness is conducted using the
presence of noise. This permits the automatic detection of the DEJ
structural OCT image. The distinction between the epidermis and der-
depth by analyzing the first derivative of the intensity profile of mean
mis skin layers is of interest in D-OCT. It allows the filtering of motion
A-scans.
F I G U R E 2 Handling the distribution of the blood flow in the xy-plane. Motion artifacts can be identified from SV signals above the DEJ. The distribution of the blood flow can be assessed by summing the corrected blood flow signal for each xy-plane on the z direction (z stack). The following 3 relevant points were computed: • Point (1)—the location of the DEJ (limit of epidermis) on the structural OCT image • Point (2)—the maximum changes in blood flow distribution (point of inflexion) • Point (3)—the depth limit of the exploitable blood flow signal (maximum value of the distribution). The corresponding closest windows on the z stack of the blood flow signal are shown with red outlines. SV, speckle variance; DEJ, dermal-epidermal junction; OCT, optical coherence tomography
|
5
DIDIER et al.
3.3.2 | Handling the distribution of blood flow in the xy-plane Following skin surface correction, the measured blood flow on the ob-
(in the x direction) of blood flow. These artifacts can be identified from SV signals above the DEJ. The distribution of the blood flow can be assessed by summing the corrected blood flow signal for each xy-plane on the z direction (z stack). The following 3 relevant points were computed:
served area (6 mm × 6 mm) as a function of depth (z stack) can be computed. The SV signal in D-OCT images detects blood flow by identifying changes in successive repeated images. However, other reasons aside from blood flow may induce changes in images. Minor movements of the subject during image acquisition could result in a false high measurement
1. Point (1)—the location of the DEJ (limit of epidermis) on the structural OCT image 2. Point (2)—the maximum changes in blood flow distribution (point of inflexion)
F I G U R E 3 Filtering by blocs. Noise can be attenuated by computing the average of the blood flow over a bloc in a depth permitting accurate measurement. For this purpose, blood flow images in the xy-plane from the computed interval between the DEJ and the depth corresponding to the maximum of the blood flow distribution, ie, point (1) to point (3) were used. These values were automatically determined for each acquisition, thus integrating the variability in subject skin morphology. The structural thin vessels and larger vessels can be correlated by splitting blocs from point (1) to point (2), and from point (2) to point (3). DEJ, dermal-epidermal junction
F I G U R E 4 Vessel enhancement. Vessel enhancement may be viewed as a filtering process searching for geometrical structures which can be regarded as tubular, and offers a measure of vesselness with geometrical interpretation. The analysis of the second order information (Hessian) has an intuitive justification in the context of vessel detection. The second derivative of a Gaussian kernel at scale s generates a probe kernel measuring the contrast between regions within and out of the range (−s, s) in the direction of the derivative. Subsequently, a probability map (or likeliness) of pixels belonging to vessels was computed. A vessel binary mask was determined from the probability map and the detected artifacts
|
DIDIER et al.
6
3. Point (3)—the depth limit of the exploitable blood flow signal (maximum value of the distribution).
from 5 μm to 100 μm. This is of great importance, as this size range corresponds to the vessel size range of interest in dermatology, namely the size of microvessels in the papillary dermis (range: 10-35 μm) and in the
The corresponding closest windows on the z stack of the blood flow signal are shown with red outlines in Figure 2.
deep dermis (range: 40-50 μm), and the occasional presence of arterioles (up to 100 μm). Moreover, the distribution of vessel size is useful for the evaluation of treatment effects over time.
3.3.3 | Filtering by blocs Individual blood flow images in the xy- plane have a poor SNR.
3.5.1 | Vessel segmentation
Therefore, pre-processing filtering is necessary to highlight the mor-
The multiscale vessel enhancement algorithm provides 2 images
phology of the vascular network. 3-D SV images were averaged in the
which may be used for computing vessel segmentation, namely the
axial and lateral (B-scan) directions to produce an isotropic voxel size
image of the best vessel scale related to each pixel of the input blood
of approximately 4 μm3 (side length).
flow averaging image, and the image of directions (angles) of pixels
Noise can be attenuated by computing the average of the blood
(from minor eigenvector). A dedicated algorithm combining the prob-
flow over a bloc in a depth permitting accurate measurement. For
ability map, detected artifacts, image of scale, and image of directions
this purpose, blood flow images in the xy-plane from the computed
was developed to provide robust vessel segmentation. This algorithm
interval between the DEJ and the depth corresponding to the maximum of the blood flow distribution, ie, point (1) to point (3) were used. These values were automatically determined for each acquisition, thus integrating the variability in subject skin morphology. The structural thin vessels and larger vessels can be correlated by splitting blocs from point (1) to point (2), and point (2) to point (3) (Figure 3). Blood flow distribution provides global information on the vascularization of superficial skin. As part of the image processing workflow, investigation of blood flow changes carrying morphological information (such as the distribution size of detected vessels) through image processing and segmentation techniques was performed.
3.4 | Vessel enhancement A vessel enhancement filter based on a multiscale second-order local structure of an image (Hessian) was applied, as described previously by Frangi et al.19 A measurement of vessel likeliness is obtained on the basis of all eigenvalues of the Hessian matrix. This allows the detection of microvessels and assigns to each pixel a probability value of belonging to a vessel. Vessel enhancement may be viewed as a filtering process searching for geometrical structures which can be regarded as tubular, and offers a measure of vesselness with geometrical interpretation. The analysis of the second order information (Hessian) has an intuitive justification in the context of vessel detection. The second derivative of a Gaussian kernel at scale s generates a probe kernel measuring the contrast between regions within and out of the range (−s, s) in the direction of the derivative. Subsequently, a probability map (or likeliness) of pixels belonging to vessels was computed. A vessel binary mask was determined from the probability map and the detected artifacts (Figure 4). This information was used to quantify blood flow distribution over depth (z direction) on preselected spatial locations.
3.5 | Quantification of the blood vessel network Mathematical morphology was combined with profile analysis on probability maps for the quantification of vessel size. This new feature provides useful data regarding the distribution of vessels with size ranging
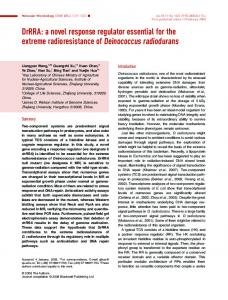
F I G U R E 5 The distribution of vessel size. The distribution of vessel size was calculated from the image of scale and the vessel segmentation mask. The graph illustrates the distribution of vessel size (diameter range: 10-85 μm)
|
7
DIDIER et al.
was based on standard mathematical morphology operators (cleaning,
between LDI perfusion and D- O CT sum of blood flow com-
directional growing, and skeletonization).
puted were calculated only on the detected vessel network (SBFVSNET). The respective R 2 were 0.738 and 0.85, and therefore, showed a good correlation between the 2 imaging technolo-
3.5.2 | Distribution of vessel size
gies (Figure 6). This implies that 85% of the variability between
The distribution of vessels size was calculated from the image of scale
the 2 variables has been accounted for. Therefore, applying this
and the vessel segmentation mask. Vessel size distribution may be for-
dedicated image processing workflow that filters artifacts and
mulated as shown in Figure 5.
data noise improves the performance of D-O CT. Moreover, using the D- O CT SBFVSNET, capsaicin responders (above 0.5) and non-r esponders (below 0.5) can be easily distinguished.
3.5.3 | OCT blood flow repeatability
It was observed that the computed blood flow on the detected
Three successive measurements on the same subject, at the same skin
vessel network decreased (compared to whole blood flow measure-
location, were performed to evaluate the repeatability of the device
ments) and values corresponded to low values in LDI.
and measure the robustness of the computed characteristic points (location of the DEJ, maximum changes in blood flow distribution, depth
Images from 2 subjects are included for illustrative purposes (Figure 7).
limit of the exploitable blood flow signal, and blood flow quantifica-
The total sum of measured blood flow on the overall acquired
tion). Data shown in Table 2 confirm the robust detection of charac-
image volume for all subjects was computed 5 minutes prior to cap-
terization points in the 3 consecutive acquisitions.
saicin application and 1 hour after capsaicin application, to evaluate the effect induced by capsaicin. These measurement timepoints were labeled as 2 distinct groups. The F statistic on the total sum of blood
3.6 | Comparison with LDI
when filtering the vessel network (SBFNET) was more powerful than 2
In order to compare the 2 technologies, the correlations (R )
that obtained without filtering (SBF) (F = 54.96 vs F = 38.14, respec-
b etween LDI perfusion and D- O CT sum of blood flow, and
tively). In addition, the percent change from T-5 of the blood flow
T A B L E 2 Optical coherence tomography blood flow repeatability Epidermis thickness (μm)
Depth of maximum increase in blood flow (μm)
Depth of maximum blood flow (μm)
Sum of blood flow computed on the detected vessel network (SBFVSNET) at 0.35 mm
114
387
528
0.5007
114
387
519
0.5127
114
387
519
0.5243
F I G U R E 6 Comparison of D-OCT with LDI. In order to compare the 2 technologies, the correlations (R2) between LDI perfusion and D-OCT sum of blood flow, and between LDI perfusion and D-OCT sum of blood flow computed were calculated only on the detected vessel network (SBFVSNET). The results were 0.738 and 0.85, respectively, showing a good correlation between the 2 imaging technologies. D-OCT, dynamic optical coherence tomography; LDI, laser Doppler imaging
|
DIDIER et al.
8
obtained via the image processing workflow was similar to the high-
changes in the skin over time, may provide data superior to sequen-
est value of percent change observed at 400 μm depth (284.1% vs
tial tissue biopsies2 and minimize the need for biopsy in the future.22
289.2%, respectively).
Moreover, the distribution of vessel size assessed by D-OCT is useful
The filtering process provides an accurate feature, highlighting the
for the evaluation of treatment effects over time in dermatology.
vasodilation effect induced by the application of capsaicin (Figure 8).
Despite its advantages, D-OCT is currently characterized by tech-
Moreover, the proposed image processing workflow permits access
nical limitations. The primary limitation of D-OCT is the limited depth
to the distribution of the size of microvessels. As shown in Figure 9,
of penetration (approximately 500 μm), in which signal noise becomes
it is possible to evaluate percent change as a function of vessel size.
dominant. Therefore, D-OCT is not suitable for the investigation of
Capsaicin induces a greater percent change for vessel size over 50 μm.
very thick skin, nor can it penetrate sufficiently deep in the vascular
The percent change for vessels with diameter below 50 μm ranged
dermis. In addition, the resolution may be insufficient to detect and
from 0.4% to 171%, whereas for vessels with diameter between 50-
measure blood flow in the finest capillaries (diameter of approximately
85 μm, the percent change ranged from 153% to 183%.
10 μm) of the skin.
The treatment was well tolerated and a total of 4 AEs were re-
D-OCT requires signal/image processing to reveal vessel morphol-
ported in 3 subjects. None of the AEs were related to capsaicin
ogy due to a low SNR and the presence of motion artifacts that are
application.
not actually excluded from blood flow distributions. Further studies are warranted to investigate 3-D vessel network segmentation and
4 | DISCUSSION
quantification. A direct clinical application of the image processing methodology discussed herein is the quantification of the effect of topical treatments
D-OCT has been shown to be a useful method for the detection, map-
(eg, vasodilatory effects) in clinical studies. In 2016, a European clini-
ping, and quantification of blood flow changes in the skin particularly
cal study including 35 healthy subjects demonstrated the usefulness of
9,13
for microvessels.
Although histology remains the gold standard for
the image processing workflow in this setting. The results showed that
the investigation of morphological changes in the skin and the diagno-
D-OCT could be utilized to detect characteristic morphological changes
sis of disease, the invasive nature of this approach is associated with
in vessels—induced by the topical application of the potent vasocon-
several disadvantages.20,21 The advancement of non-invasive imaging
strictor brimonidine 0.33% gel—and may be potentially useful in the
techniques such as D-OCT, which permit the evaluation of dynamic
monitoring of effects on skin vessels as a result of medical treatment.13
(A)
(B)
F I G U R E 7 Images of (A) a capsaicin non-responder subject and (B) a capsaicin responder subject before and 1 hour after capsaicin application
|
9
DIDIER et al.
The present study, investigating capsaicin- induced increase in
repeatability, new robust morphological features such as DEJ localiza-
vasodilation on the forearm of 16 healthy male subjects using LDI
tion, and quantification of the distribution of vessel size and changes
and D-OCT measurements for the evaluation of dermal blood flow,
in this distribution induced by the agent under investigation.
corroborated these findings. The results showed a good correlation
The image processing workflow improved the visualization of the
between D-OCT and LDI, using the newly developed image process-
vessel network through bloc filtering and artifact removal. Moreover,
ing workflow (filtered vessel network). Therefore, D-OCT with this
the assessment of vessel size distribution allows a fine analysis of the
new methodology offers an easy-to-use alternative to LDI with good
vascular patterns.
F I G U R E 8 Percent change of dermal blood flow. The total sum of measured blood flow on the overall acquired image volume for all subjects was computed 5 minutes prior to capsaicin application and 1 hour after capsaicin application, to evaluate the effect induced by capsaicin. These measurement timepoints were labeled as 2 distinct groups. The F statistic on the total sum of blood when filtering the vessel network (SBFNET) was more powerful than that obtained without filtering (SBF) (F = 54.96 vs F = 38.14, respectively). In addition, the percent change from T-5 of the blood flow obtained via the image processing workflow was similar to the highest value of mean percent change observed at 400 μm depth (284.1% vs 289.2%, respectively)
F I G U R E 9 Percent change of vessel size. Capsaicin induced a greater percent change for vessel size over 50 μm. The percent change for vessels with diameter below 50 μm ranged from 0.4% to 171%, whereas for vessels with diameter between 50-85 μm the percent change ranged from 153% to 183%
|
DIDIER et al.
10
5 | CONCLUSION The increasing demand for the non-invasive examination of skin disorders reinforces the necessity for further optimization of powerful techniques such as D-OCT.23 The newly developed image processing workflow presented in this article has been applied to numerous images and subjects providing robust results in an automated fashion, without the need for parameterization and in a relatively short time (a few minutes per image). Thus, this image processing workflow may prove valuable in enhancing the technical capabilities of D-OCT for the accurate detection and characterization of microcirculation in the skin.
ACKNOWLE DGE ME N TS The authors thank Sotirios Georgantopoulos PhD (SG Medical Writing B.V.) for editorial assistance.
CO NFLI CT OF I NTERE ST This study was funded by Nestlé Skin Health-Galderma R&D. Didier Zugaj, Laurent Petit, Joelle Vaglio, Thierry Pascual, Christophe Piketty, and Valerie Bourdes are employees of Nestlé Skin Health-Galderma R&D. Aude Chenet is an employee of Thales SAS and was contracted by Nestlé Skin Health-Galderma R&D to support the development of the image processing workflow.
REFERENCES 1. Hibler BP, Qi Q, Rossi AM. Current state of imaging in dermatology. Semin Cutan Med Surg. 2016;35:2‐8. 2. Ulrich M, Themstrup L, de Carvalho N, et al. Dynamic optical coherence tomography in dermatology. Dermatology. 2016;232:298‐311. 3. Schuh S, Holmes J, Ulrich M, et al. Imaging blood vessel morphology in skin: dynamic optical coherence tomography as a novel potential diagnostic tool in dermatology. Dermatol Ther (Heidelb). 2017;7:187‐202. 4. Marschall S, Sander B, Mogensen M, Jørgensen TM, Andersen PE. Optical coherence tomography- current technology and applications in clinical and biomedical research. Anal Bioanal Chem. 2011;400:2699‐2720. 5. Welzel J. Optical coherence tomography. Hautarzt. 2010;61:416‐420. 6. Gambichler T, Jaedicke V, Terras S. Optical coherence tomography in dermatology: technical and clinical aspects. Arch Dermatol Res. 2011;303:457‐473. 7. Welzel J, Lankenau E, Birngruber R, Engelhardt R. Optical coherence tomography of the human skin. J Am Acad Dermatol. 1997;37:958‐963. 8. Gambichler T, Pljakic A, Schmitz L. Recent advances in clinical application of optical coherence tomography of human skin. Clin Cosmet Investig Dermatol. 2015;8:345‐354. 9. Themstrup L, Welzel J, Ciardo S, et al. Validation of Dynamic optical coherence tomography for non-invasive, in vivo microcirculation imaging of the skin. Microvasc Res. 2016;107:97‐105.
10. Byers R, Matcher SJ. Optical coherence tomography measurements of biological fluid flows with picolitre spatial localization. 4th Micro and Nano Flows Conference, University College London, UK, 7-10 September 2014, Editors König CS, Karayiannis TG, Balabani S. 11. Poole KM, McCormack DR, Patil CA, Duvall CL, Skala MC. Quantifying the vascular response to ischemia with speckle variance optical coherence tomography. Biomed Opt Express. 2014;5:4118‐4130. 12. Conroy L, DaCosta RS, Vitkin IA. Quantifying tissue microvasculature with speckle variance optical coherence tomography. Opt Lett. 2012;37:3180‐3182. 13. Themstrup L, Ciardo S, Manfredi M, et al. In vivo, micro-morphological vascular changes induced by topical brimonidine studied by Dynamic optical coherence tomography. J Eur Acad Dermatol Venereol. 2016;30:974‐979. 14. Harrison DK, Abbot NC, Beck JS, McCollum PT. A preliminary assessment of laser Doppler perfusion imaging in human skin using the tuberculin reaction as a model. Physiol Meas. 1993;14:241‐252. 15. Svedman C, Cherry GW, Strigini E, Ryan TJ. Laser Doppler imaging of skin microcirculation. Acta Derm Venereol. 1998;78:114‐118. 16. PeriScan PIM 3 System—Laser Doppler Blood Perfusion Imager. PERIMED. http://www.perimed-instruments.com/laser-doppler-imaging. Accessed May 1, 2017. 17. Hershey JC, Corcoran HA, Baskin EP, et al. Investigation of the species selectivity of a nonpeptide CGRP receptor antagonist using a novel pharmacodynamic assay. Regul Pept. 2005;127:71‐77. 18. Van der Schueren BJ, de Hoon JN, Vanmolkot FH, et al. Reproducibility of the capsaicin-induced dermal blood flow response as assessed by laser Doppler perfusion imaging. Br J Clin Pharmacol. 2007;64:580‐590. 19. Frangi AF, Niessen WJ, Vincken KL, Viergever MA. Multiscale vessel enhancement filtering. In: Wells WM, Colchester A, Delp S, eds. Medical Image Computing and Computer-Assisted Intervention— MICCAI’98. MICCAI 1998. Lecture Notes in Computer Science. Berlin, Heidelberg: Springer 1998:130‐137. 20. Gambichler T, Moussa G, Sand M, Sand D, Altmeyer P, Hoffmann K. Applications of optical coherence tomography in dermatology. J Dermatol Sci. 2005;40:85‐94. 21. Cao T, Tey HL. High-definition optical coherence tomography—an aid to clinical practice and research in dermatology. J Dtsch Dermatol Ges. 2015;13:886‐890. 22. Dasgeb B, Kainerstorfer J, Mehregan D, Van Vreede A, Gandjbakhche A. An introduction to primary skin imaging. Int J Dermatol. 2013;52:1319‐1330. 23. Olsen J, Themstrup L, Jemec GB. Optical coherence tomography in dermatology. G Ital Dermatol Venereol. 2015;150:603‐615.
How to cite this article: Zugaj D, Chenet A, Petit L, et al. A novel image processing workflow for the in vivo quantification of skin microvasculature using dynamic optical coherence tomography. Skin Res Technol. 2018;00:1–11. https://doi.org/10.1111/srt.12442
|
11
DIDIER et al.
APPENDIX A Skin surface correction
Skin Surface Correction(Istruct,Ibloodflow,σx, σy,σz)
4: Iseg(z,x) ←Create the binary image from image Ifiltered(z,x,i) by replacing all values above Thresh with 1s and setting all other values to 0s 5: …Iskin(z,x) ←Find the largest object from the binary image Iseg(z,x) and label connected components
in: Structural OCT image Istruct (z,x,y), Blood Flow OCT image
6: TopSurface(x,i) ←Find the upper closest boundary to the zero
Ibloodflow(z,x,y), σx, σy, σz are the sigma (for x y z direction respectively)
depth in Iskin(z,x) in the x direction and allocate to TopSurface(x,i) the
of the 3D Gaussian low pass filter to apply on the Structural OCT
2D array of indices representing the calculated height of the skin sur-
image I(z,x,y).
face related to the ith slice
out: Structural depth corrected OCT image Istruct_corr(z,x,y), Blood Flow depth corrected OCT image Ibloodflow_corr(z,x,y) 1: Ifiltered(z,x,y) ← Apply 3D Gaussian filtering on input image Istruct(z,x,y) 2: for i ← 1 … (nb slices in y direction) do 3: Thresh ←Compute the global image threshold using Otsu’s method. on the image ith filtered B-scan Ifiltered(z,x,i)
7: end for 8: Istruct_corr(z,x,y), ←Shift each A-scan profile (z direction) of Istruct(z,x,y) by the corresponding TopSurface index TopSurface(x,y) 9: Ibloodflow_corr(z,x,y), ←Shift each A-scan profile (z direction) of Ibloodflow (z,x,y) by the corresponding TopSurface index TopSurface(x,y) 10: return Istruct_corr(z,x,y) 11: return Ibloodflow_corr(z,x,y).