for the degree of Master in Science ..... matched the shade of natural teeth and easily bonded to tooth structure with the use .... light guide to reduce cervical contraction and gap formation in Class II ...... Vita Mark II ceramic crowns were seated ...... distribution in composite restorations--a 3D finite element analysis, Dent Mater.
A Novel Technique for Class II Composite Restorations with Self-adhesive Resin Cements
By
Mohammed Al-Saleh
A thesis submitted in conformity with the requirements for the degree of Master in Science Graduate Department of Biomaterials University of Toronto
© Copyright by Mohammed Al-Saleh (2009)
A Novel Technique for Class II Composite Restorations with Self-adhesive Resin Cements Mohammed Al-Saleh Master of Science, 2009 Graduate Department of Biomaterials, Faculty of Dentistry University of Toronto
Purpose: To determine microleakage and microtensile bond strength (µTBS) of composite restorations bonded with self-adhesive resin-cements. Methods: Six groups of molars were assigned to cements: RelyX-Unicem, Breeze, Monocem, PanaviaF-2.0, Filtek-LS System, and Scotch-Bond-Multipurpose (adhesive). For microleakage, Class II preparations were made. Cements were applied onto all cavity walls. Preparations were restored, specimens themocycled and then immersed in red dye. Dye penetration was assessed according to a 5-point scale. For µTBS test, 6 mm composite buildups were made over tooth surfaces. Rectangular rods were cut and subjected to tensile force. Mean µTBS and SDs were calculated. Results: RelyX-Unicem and Breeze showed low microleakage, however, they had lower µTBS values. Filtek-LS System showed the least microleakage and the highest µTBS with dentin. Conclusion: RelyX-Unicem, Breeze and Filtek-LS System will improve marginal seal when used in subgingival Class II composite restorations.
ii
ACKNOWLEDGMENTS
My sincere thanks go out to my supervisor and mentor Dr. Omar El-Mowafy who has had a profound impact upon my academic development. Thank you for your support, guidance, encouragement and friendship throughout my research. I would like to thank my co-supervisor Dr. Laura Tam for her help with statistical analysis and for her time spent reviewing this thesis. Her patience and guidance throughout this project were greatly appreciated. I would like to express my appreciation and gratitude to my advisory committee members, Dr. Dorothy McComb and Dr. Aaron Fenton, for their significant input and valuable instruction. I would also like to thank 3M/ESPE, Pentron, Shofu and Kuraray for contributing the materials for the study. My deepest gratitude goes to my parents for their unfailing love and support. They are the rock on which I stand. Finally, I would like to extend my warmest gratitude to the love of my life my wife Noura, who has been a constant source of love, patience and kindness. Her constant love and support has kept me going throughout this project. I could not have accomplished this without her.
iii
TABLE OF CONTENTS ABSTRACTS
ii
ACKNOWLEDGMENTS
iii
TABLE OF CONTENTS
iv
LIST OF TABLES
vii
LIST OF FIGURES
viii
CHAPTER 1: INTRODUCTION AND LITERATURE REVIEW
1
1.1 Historical Background: Resin Composite Restorations
1
1.2 Potential Drawbacks of Class II Composite Restorations
4
1.2.1 Composite polymerization shrinkage and application problems 1.2.1.1 Silorane-based resin composite (Low-shrinkage composite) 1.2.2 Adhesion shortcomings
4 11 15
1.2.2.1 Total-etch adhesive system
15
1.2.2.2 Self-etch adhesive system
17
1.2.3 Postoperative hypersensitivity
19
1.2.4 Microleakage
21
1.3 Microleakage of Self-Adhesive Resin Cements
26
1.4 Microtensile Bond Strength (µTBS)
30
1.4.1 µTBS of self-adhesive resin cements
32
1.5 Statement of the Problem
35
1.6 Objectives
36
1.7 Null Hypothesis
36
CHAPTER 2: MATERIALS AND METHODS
37
2.1 Microleakage Testing
37
2.1.1 Pilot study
37
2.1.2 Main study
37
2.1.2.1 Specimen collection and storage
37
2.1.2.2 Specimen preparation
38 iv
2.1.2.3 Specimen grouping and restoration procedures
39
2.1.2.4 Thermocycling procedure
40
2.1.2.5 Microleakage Testing
41
2.1.2.6 Cement thickness
42
2.1.2.7 Data analysis
42
2.2 Microtensile Bond Strength Testing (µTBS)
43
2.2.1 Pilot Study
43
2.2.2 Main study
43
2.2.2.1 Specimen collection and storage
43
2.2.2.2 Specimen preparation
43
2.2.2.3 Specimen grouping and bonding procedures
44
2.2.2.4 Thermocycling procedure
45
2.2.2.5 Specimen preparation and µTBS testing
45
2.2.2.6 Evaluation of mode of failure
46
2.2.2.7 Scanning electron microscopy (SEM)
46
2.2.2.8 Data analysis
47
CHAPTER 3: RESULTS
55
3.1 Microleakage Test Results
55
3.2 µTBS Test Results
56
3.2.1. Mode of failure
57
CHAPTER 4: DISCUSSION
75
4.1 Effect of Study Methods
75
4.1.1 Effect of gamma irradiation
75
4.1.2 Effect of specimen preparation
76
4.1.3 Effect of water storage
77
4.1.4 Effect of thermal aging
77
4.1.5 Effect of using chemical dye for microleakage assessment
78
4.2 Effect of Material-related Factors
80
4.2.1 Effect of polymerization shrinkage on microleakage and bond strength
80
4.2.2 Effect of pH on microleakage and bond strength
82
4.2.2.1 Effect of pH on enamel tooth structure v
82
4.2.2.2 Effect of pH on dentin tooth structure
84
4.2.3 Effect of intermediate layer on microleakage and bond strength
87
4.2.4 Effect of hydrophobic layer on microleakage and bond strength
90
4.2.5 Effect of the self-adhesive cement composition on microleakage
93
and bond strength 4.2.6 Failure modes of µTBS test
95
4.3 Summary
97
4.4 Clinical Significance of the Study
99
4.5 Study Limitations
100
4.6 Future Studies
101
4.7 Conclusions
102
REFERENCE
104
vi
LIST OF TABLES Table 1: Material composition of cements, adhesives and composites as provided by the manufacturers. Table 2: Steps followed for materials application.
page 53 page 54
Table 3: The range of cement thickness, modulus of elasticity and pH of the materials used.
page 63
Table 4: Distribution of the dentin side microleakage scores with group means and SDs.
page 64
Table 5: Distribution of the enamel side microleakage scores with group means and SDs.
page 65
Table 6: p-values (Mann-Whitney U-test) for the microleakage test groups.
Page 66
Table 7: Means (MPa) and SDs of the µTBS of dentin and enamel subgroups. page 68 Table 8: p-values (Tukey’s t-test) for µTBS test subgroup.
page 68
Table 9: Distribution of µTBS failure modes of the dentin subgroups.
page 69
Table 10: Distribution of µTBS failure modes of the enamel subgroup.
page 70
Table 11: Mean ranks and SDs of failure modes of dentin and enamel subgroups.
page 71
Table 12: p-values (Mann-Whitney U-test) for the mean ranks of the µTBS failure modes.
page 72
vii
LIST OF FIGURES 1.
Polymerization shrinkage caused by linear reduction of the reacted monomers in methacrylate-based composites. (reproduced from 3M ESPE)
page 5
2. Polymerization shrinkage stresses lead to bond failure at tooth-composite interface. (reproduced from3M ESPE)
page 6
3. Simple illustration of the chemical composition of the silorane-based composite. (reproduced from 3M ESPE)
page 14
4. The ring-shaped silorane monomers represent less polymerization shrinkage than the methacrylates in composites. (reproduced from3M ESPE)
page 14
5. Apical foramina of the teeth sealed with GI cement and roots sealed with nail vanish to prevent dye penetration during microleakage testing.
page 48
6. Teeth embedded in acrylic bases and crowns pumiced with rubber cups and slurry of soft pumice.
page 48
7. Preparation dimensions.
page 48
8. Position of gingival seats.
page 49
9. Matrixing.
page 49
10. Radiometer showing light intensity of Demi LED unit.
page 49
11. Occlusal and proximal views of a representative restored specimen sealed with nail varnish.
page 50
12. Representative specimen after immersion in red dye for 24 hours.
page 50
13. Specimen sectioning.
page 51
14. Extent of dye penetration scored according to five-point scale.
page 51
15. Illustration scheme showing specimen preparation for µTBS test.
page 52
16. Representative photographs of microleakage for RXU group.
page 59
17. Representative photographs of microleakage for BRZ group.
page 59
18. Representative photographs of microleakage for MON group.
page 60
19. Representative photographs of microleakage for PAN group.
page 60
20. Representative photographs of microleakage for FLS System group.
page 61
viii
21. Representative photographs of microleakage for SBMP group.
page 61
22. Representative photographs showing the cement thicknesses at occlusal, axial and gingival interfaces.
page 62
23. Bar chart showing the % distribution of the microleakage scores for dentin subgroup.
page 64
24. Bar chart showing the % distribution of the microleakage scores for enamel subgroup.
page 65
25. Bar chart showing microleakage means and SDs of dentin and enamel subgroups.
page 66
26. Bar chart showing µTBS means and SDs of dentin subgroups.
page 67
27. Bar chart showing µTBS means and SDs of enamel subgroups.
page 67
28. Bar chart showing the % distribution of the different failure modes of dentin subgroups.
page 69
29. Bar chart showing the % distribution of the different failure modes of enamel subgroups.
page 70
30. Bar chart showing mean ranks and SDs of different failure modes of dentin and enamel subgroups.
page 71
31. SEM photograph for RXU cement.
page 73
32. SEM photograph for BRZ cement.
page 73
33. SEM photograph for PAN cement.
page 73
34. SEM photograph for FLS System adhesive.
page 74
35. SEM photograph for FLS System adhesive.
page 74
36. SEM photograph for SBMP adhesive.
page 74
37. SEM photograph for SBMP adhesive.
page 74
ix
INTRODUCTION AND LITERATURE REVIEW
1.1 Historical Background: Resin Composite Restorations
During the first half of the 20th century, silicates were the only tooth-colored aesthetic materials available for direct cavity restorations. Although silicates release fluoride, they are no longer used for permanent teeth because the silicate material becomes severely eroded within a few years. Acrylic resins, similar to those used for custom impression trays and dentures (polymethacrylate [PMMA]), replaced the silicates during the late 1940s and the early 1950s because of their more tooth-like appearance, insolubility in oral fluids, ease of manipulation, and low cost. Unfortunately, these acrylic resins also have relatively poor wear resistance and they shrink severely during curing, which causes them to pull away from the cavity walls and produce leakage along the margins. Their excessive thermal expansion and contraction causes further stress to develop at the cavity margins when hot or cold beverages and foods are consumed. These problems were reduced somewhat by the addition of quartz powder to form a composite structure. Commonly used fillers have an extremely low thermal expansion coefficient, approaching that of tooth structure. Incorporation of filler particles became a practical means of reducing both curing contraction and thermal expansion. . The early composites based on PMMA were not very successful, in part because the filler particles simply reduced the volume of polymer resin but were not bonded (coupled) to the resin. Defects therefore developed between the mechanically retained 1
particles and the surrounding resin, producing leakage, staining, and poor wear resistance. A major advance was made when Dr. Ray L. Bowen (1962)1 of the American Dental Association research unit at the National Bureau of Standards developed a new type of resin composite material. Bowen’s main innovations were bisphenol glycidyl methacrylate (BIS-GMA), a dimethacrylate resin, and an organic silane coupling agent to form a bond between the filler particles and the resin matrix. Patient demand for restorations that are highly aesthetic and affordable are factors contributing to the choice of resin composite restorations. Because of their favourable characteristics, resin composites are capable of providing an excellent balance of performance features needed for use in the oral cavity. Ideally, these characteristics include (1) biological compatibility, (2) physical properties, (3) ease of manipulation, (4) aesthetic qualities, (5) relatively low cost, and (6) chemical stability in the mouth.2 As well, the composites are free of metal and mercury. The decline of amalgam use among clinicians and patients, however, began in the early 1980s due to some inherent problems. For instance, amalgam’s tendency to corrode and difficulty bonding to tooth structure, along with the necessity to remove sound tooth structure for retention, are problematic.3 Also at issue for some people are its lack of aesthetics and fears about potential mercury toxicity.4-6 As a result, the need for amalgam alternatives has been an issue in the dental literature for several years. Amalgam has been a public health concern in recent years in several countries and some clinicians have advocated the replacement of metal restorations with mercury-free restorations such as resin composite. In January of 2008, Norway’s government imposed a ban on the use of mercury products, including amalgam restoration, due to environmental concerns.
2
This ban was denounced by Dr. Jones in 2008 7 due to the lack of scientific evidence. It is important to know that Dr. Jones’s rationale makes sense to many clinicians in dental practice. Practice should be guided by science, not by fear. Resin-based composites were advocated as a possible alternative to amalgam restorations because they were mercury-free and thermally nonconductive; further, they matched the shade of natural teeth and easily bonded to tooth structure with the use of adhesive systems. Resin-based composite systems are the material of choice for direct aesthetic anterior restorations. These materials are gaining acceptance for restoration of posterior occlusal areas and other high-stress-bearing sites. Early on, dentists who used resin-based composites to restore posterior teeth experienced poor wear resistance, difficulties in achieving good proximal contact and contour, polymerization shrinkage, and poor dentin marginal adaptation.8, 9 More recently, the mean longevity of posterior composites (seven years) is approaching that of amalgam (10 years).2 Resin composite materials are also used in a variety of other dental applications, such as pit and fissure sealants, bonding of ceramic veneers, and cementation of other fixed prostheses. Recently, a new chemically modified composite was introduced into the market; the previous composite’s methacrylate resin content was replaced with a silorane resin, which uses a ring-shaped monomer instead of a linear monomer as found in the methacrylate-based composites (Figures 1 and 4). The reaction between the ring-shaped monomers is initiated by their opening and extending toward each other, which technically results in low polymerization shrinkage. The reported amount of the volumetric shrinkage of the silorane-based composite is 0.1). Significant differences were detected, however, between SBMP and PAN, MON (p < 0.5). Table 6 shows the MannWhitney U-test p-values of all groups. The first null hypothesis therefore was rejected; there was a significant difference in the microleakage scores among the different dentin and enamel groups in Class II preparations.
3.2 µTBS Test Results
After thermal cycling and during the preparation of the specimens, BRZ enamel bonding subgroup specimens and both dentin and enamel MON subgroup specimens debonded before they could be tested. A total of 98 rods was collected for µTBS testing, data analysis and mode of failure evaluation. Representative pictures of modes of failure were digitally photographed and stored on the computer. The means and standard deviations data for µTBS, expressed in MPa, are shown in Table 7 and in Figures 26-27. For dentin bonding subgroups, the higher µTBS values were obtained by FLS System, followed by the SBMP, PAN, RXU and BRZ. Because the data were slightly skewed, the descriptive analysis (histogram curves) revealed that the data were relatively (marginally) normally distributed. Therefore, parametric (ANOVA) and non-parametric (Kruskal-Wallis) analysis tests were conducted to evaluate the difference of the µTBS values among the subgroups. The One-way ANOVA revealed that there was a significant difference in µTBS among the dentin subgroups (p < 0.001) at the 95% confidence level. Further analysis with Tukey’s t-test (pair-wise comparison) showed that there was 56
significant difference between FLS System subgroup and other subgroups and between SBMP and other subgroups as well. No significant difference was found between FLS System and SBMP (p = 0.999). Table 8 shows the p-values of the Tukey’s t-test for the dentin bonding subgroups. Kruskal-Wallis test revealed that there was a significant difference of the µTBS among the subgroups (p < 0.001) as well. For enamel bonding subgroups, the higher µTBS values were obtained by SBMP, followed by PAN, FLS System and RXU. Enamel bonding subgroup data were also slightly skewed. The ANOVA test and Kruskal-Wallis test both were conducted to evaluate the difference of the µTBS values among the subgroups. Both tests revealed that there was a significant difference in µTBS among the dentin subgroups (p < 0.001) at the 95% confidence level. Further analysis with Tukey’s t-test (pair-wise comparison) showed that there were significant differences among the subgroups except FLS System and PAN (p = 0.189), and FLS System and RXU (p = 0.90). Table 8 shows the p-values of the Tukey’s t-test for the enamel bonding subgroups.
3.2.1. Mode of failure Most of the failures of the dentin bonding subgroups were either adhesive or cohesive (failure of dentin or composite), and no specimens showed a mixed mode of failure. In the enamel bonding subgroups, most of the failures were either adhesive or mixed; only a few cohesive mode of failure were observed (Table 9 and 10). SEM photographs represented the mode of failure of the subgroups (Figures 31 to 37). Percentages of failure modes in each subgroup are illustrated in bar charts (Figures 28 and 29).
57
Analysis with Chi-square test could not be conducted because the values of more than 30% of the cells were less than five and none is zero. The mean-rank values of the failure modes are presented in Figure 30 and Table 11. Kruskal-Wallis test revealed a significant difference among failure modes of both dentin and enamel subgroups (p < 0.001). The results of Mann-Whitney U-test are reported in Table 12.
58
E
E
D
E
D
E
D
D
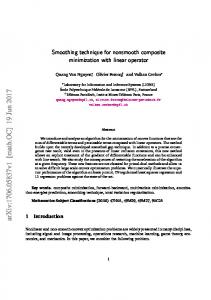
Figure 16: Representative photographs of microleakage for RXU group. The enamel sides (E) of both photographs show no microleakage at the tooth-composite interface (only the enamel tooth structure is stained with the dye). The dentin side (D), photograph A shows microleakage (score 2), and photograph B shows no microleakage.
E
D
D
E
Figure 17: Representative photographs of microleakage for BRZ group. In photograph A, the enamel side (E) shows microleakage (score 2), and the dentin side (D) shows no microleakage. In photograph B, the enamel side (E) shows no microleakage, and the dentin side (D) shows microleakage (score 1).
59
D
E
E
D
Figure 18: Representative photographs of microleakage for the MON group. Photographs A and B show microleakage extended through the axial wall up to the pulpal floor (score 4) at both the enamel side (E) and the dentin side (D).
D E
E
D
Figure 19: Representative photographs for the PAN group. In photograph A, the enamel side (E) shows no microleakage at the tooth-composite interface, and the dentin side (D) shows microleakage extended through the axial wall up to the pulpal floor (score 4). Photograph B shows microleakage (score 4), at both the enamel sides (E) and the dentin (D).
60
E
D
D
E
Figure 20: Representative photographs for the FLS System group. Photographs A and B show no microleakage at both the enamel side (E) and the dentin side (D).
E
D
D
E
Figure 21: Representative photographs for the SBMP group (control). Photographs A and B show no microleakage at the enamel side (E). Photograph A shows microleakage (score 3) at the dentin side (D), and photograph B shows microleakage (score 4) at the dentin side.
61
Figure 22: Representative photographs showing the cement thicknesses at the pulpal, axial and gingival interfaces.
RXU
62
Table 3: The range of cement thickness, modulus of elasticity and pH of the materials used.
Thickness (µm)
Elastic Modulus a (GPa)
pH
26.2 - 61.1
6.3
2.1
22.5 - 67.7
4.2
3.5
27.9 - 73.5
2
2.2
12.6 - 100
9.6
2.4
Filtek LS System Adhesive (3M ESPE, Seefeld, Germany)
36 - 37
--
2.7
Scotch Bond Multi-Purpose (3M ESPE, St Paul, USA)
--
--
0.6
Material (Manufacturer)
RelyX Unicem (3M ESPE, St Paul, USA) Breeze (Pentron Clinical, Wallingford, USA) Monocem (Shofu Dental Co., San Marcos,USA) PanaviaF 2.0 (Kuraray Medical Inc, Okayama, Japan)
a
a. Data were collected from either the manufactures or studies in the literature.114, 146-149, 149, 150
63
Figure 23: Bar chart showing the % distribution of microleakage scores for all dentin subgroups.
%
100 90 80 70 60 50 40 30 20 10 0
0= No Leakage 1= Outer 1/2 of GF 2= Inner 1/2 of GF 3= Up to 2/3 of AW 4= Pulpal floor
FLS System
BRZ
RXU
SBMP
PAN
MON
Bonding to dentin interface
Table 4: Distribution of the dentin side microleakage scores with group means and SDs.
Groups FLS System RXU BRZ SBMP PAN MON
0 9 5 4 1 0 0
Dentin microleakage scores 1 2 3 0 0 0 3 0 1 4 1 0 0 0 2 1 0 1 0
0
0
64
4 0 0 0 6 7
Mean
SD
0 0.66 0.66 3.33 3.55
0 0.7 1 1.32 1.01
9
4
0
Figure 24: Bar chart showing the % distribution of microleakage scores for all enamel subgroups. 100 90 80 70
%
60
0= No Leakage
50
1= Outer 1/2 of GF
40
2= Inner 1/2 of GF
30
3= Up to 2/3 of AW
20
4= Pulpal floor
10 0 FLS System
SBMP
BRZ
RXU
PAN
MON
Bonding to enamel interface
Table 5: Distribution of the enamel side microleakage scores with group means and SDs.
Enamel microleakage scores Groups
0
1
2
3
4
Mean
SD
FLS System
6
2
1
0
0
0.44
0.72
RXU
6
1
0
1
1
0.77
0.44
BRZ SBMP PAN
2 1 2
7 7 0
0 1 0
0 0 0
0 0 7
1 0.88 3.11
0.5 1.53 1.76
MON
0
0
0
0
9
4
0
65
Figure 25: Bar chart showing microleakage scores (means and SDs) of the dentin and enamel subgroups. Mean microleakage score
6 Dentine
5
Enamel
4 3 2 1 0 FLS System
RXU
BRZ
SBMP
PAN
MON
Groups
Table 6: p-values (Mann-Whitney U-test) for the microleakage test groups.
Groups
FLS System RXU BRZ SBMP PAN MON
p-values of all groups FLS System -0.222 0.077 0.863 0.011 0.000
a
RXU
BRZ
SBMP
PAN
MON
0.050 -0.489 0.340 0.031 0.000
0.113 0.796 -0.190 0.040 0.000
0.000 0.002 0.002 -0.024 0.000
0.000 0.000 0.000 0.730 -0.436
0.000 0.000 0.000 0.258 0.436 --
a. Underlined values represent the enamel side groups while the non-underlined values are for the dentin side groups.
66
Figure 26: Bar chart showing µTBS means (MPa) and SDs of dentin subgroups.
Mean of µTBS values
30 25 20 15 10 5 0 SBMP
FLS System
PAN
RXU
BRZ
Dentin subgroups
Figure 27: Bar chart showing µTBS means (MPa) and SDs of enamel subgroups.
Mean of µTBS values
35
30 25 20 15 10 5 0 SBMP
FLS System
PAN
Enamel subgroups
67
RXU
Table 7: Means (MPa) and SDs of the µTBS of dentin and enamel subgroups. Specimens of MON subgroups and BRZ enamel subgroup underwent premature failure.
n
Dentin Mean (MPa)
SD
SBMP FLS System
12 12
18.61 19.14
PAN RXU BRZ
12 10 9 0
MON
n
Enamel Mean (MPa)
SD
6.65 8.70
12 12
24.55 8.57
6.14 3.30
11.57 6.69 4.02
4.72 3.30 1.88
12.06 4.13 --
3.86 1.35 --
--
--
12 9 0 0
--
--
Table 8: p-values (Tukey’s t-test) for the µTBS test subgroups.
Groups
FLS System SBMP PAN RXU BRZ
p-values of all groups FLS System -0.000 0.189 0.090 --
a
SBMP
PAN
RXU
BRZ
0.999 -0.000 0.000 --
0.020 0.036 -0.001 --
0.000 0.000 0.299 ---
0.000 0.000 0.037 0.855 --
a. Underlined values are for the enamel subgroups while the non-underlined values are for the dentin subgroups.
68
Figure 28: Bar chart showing the % distribution of different failure modes of dentin subgroups.
%
100 90 80 70 60 50 40 30 20 10 0
3= Cohesive 2= mixed 1= Adhesive 0= premature Failure
FLS System
SBMP
PAN
RXU
BRZ
MON
Dentin subgroups
Table 9: Distribution of µTBS failure modes of the dentin subgroups.
Failure modes of dentin rods Adhesive SBMP FLS System PAN RXU BRZ MON
7 2 (a/d) 4 (r) 4 (a/c) 5 (r) 3 (a/d) 5 (r) 9 (a/d) --
Cohesive 4 (c) 1 (d)
Mixed
6 (c)
--
3 (c)
--
2 (c)
--
---
---
--
(a) adhesive; (c) composite; (d) dentin; (a/d) adhesive/dentin interface; (a/c) adhesive/composite interface; (r) remnants on both sides.
69
Figure 29: Bar chart showing the % distribution of different failure modes of enamel subgroups.
%
100 90 80 70 60 50 40 30 20 10 0
3= Cohesive 2= mixed 1= Adheisve 0= premature failure
FLS System
SBMP
PAN
RXU
BRZ
MON
Enamel subgroups
Table 10: Distribution of µTBS failure modes of the enamel subgroups.
Failure modes of enamel rods
SBMP FLS System PAN RXU BRZ MON
Adhesive
Cohesive
Mixed
5*
3 (c)
4
--
3
1 (c)
4
1 (c)
1
---
---
2 (a/e) 7 (r) 5 (a/e) 2 (r) 4(a/e) 3 (r) ---
(*) could not be specified under the light microscope; (a) adhesive; (c) composite; (e) enamel; (a/e) adhesive/enamel interface; (a/c) adhesive/composite interface; (r) remnants on both sides.
70
Figure 30: Bar chart showing mean ranks and SDs of different failure modes of dentin and enamel subgroups.
Mean rank of the failure modes
3.5 3
Dentine
Enamel
PAN Subgroups
RXU
2.5 2 1.5 1 0.5 0 FLS System
SBMP
BRZ
MON
Table 11: Mean ranks and SDs of different failure modes of dentin and enamel subgroups.
Dentin FLS System SBMP PAN RXU BRZ MON
Mean (n=12) 2 1.8 1.5 1.2 0.75 0
Enamel SD 1.04 1.02 0.9 0.93 0.45 0
71
Mean (n=12) 1.25 1.8 1.6 1 0 0
SD 0.45 0.83 0.79 0.85 0 0
Table 12: p-values (Mann-Whitney) for the mean ranks of the µTBS failure modes.
Groups FLS System -0.062 0.297 0.214 0.000 0.000
SBMP
p-values of all groups PAN RXU
a
BRZ
MON
0.688 0.216 0.048 0.003 0.000 FLS System -0.397 0.092 0.005 0.000 SBMP 0.432 -0.278 0.016 0.000 PAN 0.021 0.070 -0.278 0.000 RXU 0.000 0.000 0.000 -0.000 BRZ 0.000 0.000 0.000 0.000 -MON a. Underlined values are for the enamel subgroups while the non-underlined values are for the dentin subgroups.
72
R SM
Figure 31: RelyX Unicem (3M ESPE) bonded to bur cut dentin, SEM photomicrograph of a fractured µTBS specimen viewed at angle of 90⁰. The specimen failed 100% adhesively, between the dentin and the cement. The photomicrograph shows cement remnants over the composite surface (R). Magnification: x5000.
Figure 32: Breeze (Pentron) bonded to bur cut dentin, SEM photomicrograph of a fractured µTBS specimen viewed at angle of 90⁰. The specimen failed 100% adhesively, between the dentin and the cement. The photomicrograph shows the smear layer (SM). Magnification: x5000.
F
Figure 33: Panavia F 2.0 (Kuraray) bonded to bur cut dentin, SEM photomicrograph of a fractured µTBS specimen viewed at angle of 90⁰. The specimen failed 100% adhesively. The photomicrograph showing the cement is packed with large filler particles (F). Magnification: x5000.
73
F C
B P D
Figure 34: Filtek LS System (3M ESPE) bonded to
Figure 35: Filtek LS System (3M
bur cut dentin, SEM photomicrograph of a fractured µTBS specimen viewed at side angle. The specimen had mixed failure between adhesive and composite.
ESPE) bonded to bur cut dentin, SEM photomicrograph of a fractured µTBS specimen viewed at angle of 90⁰. The specimen failed 100% adhesively. The photomicrograph shows adhesive layer filled with filler particles. (F) filler particles. Magnification: x5000.
The photomicrograph shows a bilayer band of adhesive. (C) silorane composite; (B) FLS bond, it is optimized for wetting and adhering to the hydrophobic FLS composite (P) FLS self-etch primer, it is rather hydrophilic to ensure proper adhesion to dentin (D) dentin. Magnification: x2000.
RT
DT
D
Figures 36 and 37: Scotch Bond Multi Purpose (3M ESPE) bonded to bur cut dentin, SEM photomicrograph of a fractured µTBS specimen viewed at angle of 90⁰. The specimen failed 100% adhesively. The photomicrograph showing a typical example of completely removed smear layer after dentin surface conditioned with 35% phosphoric acid. Open dentin tubules and resin tags are
visible. Therefore, failure occurred either on top of dentin or through the hybrid layer. (D) dentin surface; (DT) dentinal tubules; (RT) resin tag. Magnification: x5000. 74
DISCUSSION
This study evaluated the Class II gingival margin microleakage and the µTBS of different self-adhesive resin cements with direct resin composite restoration. This study attempted to replace the conventional restorative system with innovative ones, based upon the common problems of the posterior subgingival Class II composite restorations, by using resin cements to bond the resin composite to the tooth structure and by using a new chemically-modified resin composite. During microleakage testing, RXU and BRZ resin cements showed lower microleakage scores compared to the control adhesive SBMP (total-etch) when bonding to dentin; while the FLS System showed microleakagefree restorations when bonded to dentin. During the µTBS testing SBMP showed the highest values among all subgroups when bonded to enamel while FLS System showed the highest values when bonded to dentin. RXU and BRZ showed relatively low results in µTBS test.
4.1 Effect of Study Methods
4.1.1 Effect of gamma irradiation Extracted human molars were employed by the current study. It is of paramount importance to note that extracted teeth are considered to be a potential biological hazard and source of blood borne pathogens. Therefore, infectious agents associated with extracted teeth need to be eliminated prior to dental research, with the minimal 75
alterations of the tooth structure’s physical and mechanical properties. Several sterilization methods are used in dental research, including autoclaving, chemical heat or dry heat sterilization. However, these sterilization methods have been proven to affect the tooth structure.151 Gamma irradiation at the dosage used in this study has been shown to sterilize non-carious teeth effectively without affecting the tooth structure properties.139, 140
4.1.2 Effect of specimen preparation The methodology of the current study was conducted to simulate the clinical situation as closely as possible. In the current study, natural human teeth were employed to measure and compare the microleakage and the bond strength of different materials when bonded to natural tooth tissue. One of the shortcomings of using natural teeth for bonding experiments is being subjected to dryness after their extraction. However, the teeth were kept in water immediately after extraction and throughout the different test procedures. In the microleakage experiment, Class II preparations were prepared to measure the microleakage at two gingival margins (enamel and dentin). Carbide burs were used to prepare a surface with smear layer similar to the clinical situation. The preparations were standardized in dimensions to minimize variability. The Class II preparation was used to create a clinically-relevant C-factor. This contrasted the configuration in the µTBS testing, where flat enamel and dentin surface were used. However, the exposed flat dentin surfaces of the µTBS test specimens were wet-ground by means of a carbide bur.
76
4.1.3 Effect of water storage Specimens of both microleakage and µTBS experiments were stored in distilled water for 7 days prior to thermocycling. Laboratory studies have shown that individual teeth have variable permeability and different solutions affect their permeability differently.138, 152 It has been reported that different solutions such as 70% ethanol, 10% formalin, distilled water and distilled water with thymol, do not affect the bond strength of the dentin structure.138 To closely mimic the clinical situation, some studies have used artificial saliva solutions for storage. The decrease in bond strength obtained with the saliva solutions was found to be similar to that obtained with the pure water.153 Storage in water solutions is one of the common artificial aging techniques in dental research. A decrease in bonding effectiveness due to water storage is attributed to the degradation of the interfacial components (mainly resin and/or collagen) by hydrolysis. The storage time period may vary from a few months 154 up to 4-5 years or even longer.155 It has been reported that bond strengths may decrease significantly even after relatively short storage periods like 3-6 months.156 The seven days of storage in distilled water at room temperature, in the current study, is considered a brief period in comparison to the life expectancy of the restorations. Therefore, a minimal or no effect would be expected on the microleakage and µTBS experiment results.
4.1.4 Effect of thermal aging The use of thermocycling may highlight a mismatch in the thermal coefficient of expansion between the restoration and tooth structure, which would result in repeated expansion-contraction stresses at the tooth-restoration interface. Studies reported that the
77
relative linear thermal expansion of the resin composite Filtek Z250 was 41.5 X10⁻⁶ /°C,157 and 11 X10-6/°C and 17 X10-6/°C for enamel and dentin respectively.158 The difference in the coefficient of thermal expansion between the resin restorative material and the tooth structure may induce stresses on teeth and restorative materials.159 Microgaps present at the tooth-restoration interface may expand slowly over many cycles of such stress-inducing activity. The amount of microleakage would increase and the bond strength would decrease over time in the complicated thermal environment of the oral cavity. When thermal cycling is applied to specimens in which stresses similar to that in the clinical situation (C-factor of Class II), the highest stress is obtained.69 The ISO TR 11450 standard (1994) indicates that a thermocycling regimen comprised of 500 cycles in water between 5°C and 55°C is an appropriate artificial aging test.142 Crim et al 160
found no difference in dye penetration when the specimens were cycled between 100
and 1500 cycles. However, the hot water bath (55º C) may accelerate the hydrolysis of the components of the interfacial material, the water absorption, and the extraction of the breakdown collagen or poorly polymerized resin oligomers.161 In this study, all specimens were subjected to 1000 cycles between 5º C and 55º C to measure the effectiveness of the tooth-restoration interfacial bond under closer clinically-relevant protocol. Thus, it is possible that the microleakage and µTBS results would have been even better had the specimens been not thermocycled.
4.1.5 Effect of using fuchsine dye for microleakage assessment Many techniques have been utilized to evaluate the cavity-sealing properties both in vivo and in vitro. In vitro microleakage evaluation studies have included the use of air
78
pressure, dyes, artificial caries techniques, bacteria, chemical tracers, radioactive isotopes, neutron activation analysis, scanning electron microscopy, and electrical conductivity. In addition to their contrasting color, the organic dyes do not chemically react or cause any destruction to the specimens, and they are considered the oldest, most successful, and most common methods of detecting microleakage in vitro. There has been a wide variation in choice of the dye used, either as solutions or suspensions of different particle size. Some researchers believe that in vitro microleakage studies overestimate the amount of leakage that actually happens in clinical situations.56, 162 The reported molecular radii of silver nitrate, methylene blue and fuchsine red to be smaller at 0.5 um, 0.68 um, and 0.84 um, respectively, than the molecular radii of the bacterial endotoxins and bacteria, responsible for pathosis and secondary caries, at 10 um and 100-500 um respectively.143 However, the water molecule has a radius of 0.26 um which is small enough to diffuse into the microporosities within the interfacial hybrid layer via marginal microgaps, and may lead to hydrolysis of the exposed collagen fibers within the hybrid zone.56 Furthermore, glucose particles, which are a bacterial nutrient source, are smaller than the dye particles, and their diffusion permits the possibility of bacterial presence and/or secondary caries development at the dentin-restoration interface.143 A one possible limitation of the microleakage experiment is that the results might be influenced by the dye chemical composition (fuchsine) that is used in the current study. However, utilizing different dyes like fuchsine red, methylene blue and silver nitrate did not show any difference in the results obtained by different studies in the literature.39, 99, 99, 102-105, 120, 121
79
4.2 Effect of Material-related Factors
4.2.1 Effect of polymerization shrinkage on microleakage and bond strength To partially overcome the shrinkage stresses in the experiments of the current study, 5 layers of the resin composite were applied, diagonally to restore the preparations in the microleakage experiment, and horizontally on the prepared flat surfaces in the µTBS experiment. The rationale for using the incremental technique is that minimal shrinkage stresses occur within each increment, because there is a low cavity configuration factor due to the large free surface that permits resin to flow during polymerization. As additional layers are added, there is probably some compensation for shrinkage and stress build-up in earlier layers.96, 99 Filtek Z250, a conventional hybrid composite, and Filtek LS, a silorane-based composite were used in the current study. The manufacturer, 3M ESPE, reported that volumetric polymerization shrinkage of Filtek Z250 is 2%, and