A Novelty-based Clustering Method for On-line Documents Sophoin Khy1 1
Yoshiharu Ishikawa2
Hiroyuki Kitagawa1,3
Graduate School of Systems and Information Engineering 3
Center for Computational Sciences University of Tsukuba
1-1-1 Tennohdai, Tsukuba, Ibaraki, 305-8573 Japan Tel: +81-298-53-5051 Fax: +81-298-53-5522 e-mail:
[email protected],
[email protected] 2 Information Technology Center Nagoya University Furo-cho, Chikusa-ku, Nagoya, 464-8601 Japan Tel/Fax: +81-52-789-3306 e-mail:
[email protected] Abstract
In this paper, we describe a document clustering method called noveltybased document clustering. This method clusters documents based on similarity and novelty. The method assigns higher weights to recent documents than old ones and generates clusters with the focus on recent topics. The similarity function is derived probabilistically, extending the conventional cosine measure of the vector space model by incorporating a document forgetting model to produce novelty-based clusters. The clustering procedure is a variation of the K-means method. An additional feature of our clustering method is an incremental update facility, which is applied when new documents are incorporated into a document repository. Performance of the clustering method is examined through experiments. Experimental results show the efficiency and effectiveness of our method. Key words: document clustering, forgetting factor, incremental processing, novelty, on-line documents 1
1
Introduction
With the rapid development of Internet technology and less expensive hardware, electronic documents like news articles and scientific papers have proliferated and are delivered continuously over time. This explosion of electronic documents has made it difficult for a user to extract useful information from them. This issue has been approached using various techniques, one of which is document clustering. Document clustering is used as a core technique in managing vast data and providing summarized information. It collects similar documents into groups. Document clustering has been used as a fundamental method in many areas, such as information retrieval [4, 12, 31, 32], information filtering [14], and topic detection and tracking [1]. It has also been used as a preprocessing step for other document processing tasks, such as text classification [33] and summarization of documents [9, 30, 39] and as an analysis approach in Web information management, including the study of Web communities [40]. In this work, we consider another problem in organizing on-line documents. In an on-line environment, a user tends to be interested in new and up-to-date information, for example, when browsing on-line news. Although traditional document clustering methods can provide clusters of relevant documents to the user to assist the browsing task, they do not fulfill the requirement of a user interested in recent issues since the provided clusters consist of old and new topics. With this background, we propose a novelty-based document clustering method [17, 19], which summarizes trends of on-line documents and provides users with up-to-date information. The novelty-based document clustering method works on-line, focusing on recent documents. The objective of the method is to generate clusters reflecting trends of recent topics by presenting up-to-date cluster snapshots. The novelty-based clustering method is based on a novelty-based similarity measure, which is an extension of a traditional approach in information retrieval, the cosine similarity measure in the vector space model. It is also related to the idea of the tf · idf term weighting scheme, but is derived in terms of probabilistic formulation based on the concept of a document forgetting model . The clustering algorithm is an extended version of the K-means method, often used in information retrieval. The prominent characteristic of our clustering method is our incorporation of the forgetting factor to formulate the similarity metric. We assume that each document has its importance value (called a weight). A document weight has an initial value one when a document arrives; it then gradually decays according to the forgetting factor. Based on the forgetting factor, the clustering method assigns higher weights to recent documents than older ones. In other words, the method gradually forgets old documents and focuses mainly on recent documents to generate clusters. An additional feature of the clustering method is its incremental update facilities. The incremental update feature is suited to on-line environments where documents are continually delivered.
2
This paper is partially based on our previous work [17] and [19]. In [17], we proposed the forgetting-factor-based similarity function and derived a clustering algorithm that extends the incremental clustering method by Can [5]. [19] is a preliminary version of this paper. In [19], we used the novelty-based similarity function in [17]; we proposed a variation of the K-means clustering algorithm and performed a preliminary experimental evaluation. This paper extends our previous work and examines the efficiency and effectiveness of the novelty-based clustering method through more detailed experiments. The remainder of the paper is organized as follows. Section 2 reviews related work. Section 3 describes the novelty-based similarity measure. The clustering algorithm is presented in Section 4. Section 5 reports the experimental evaluation of the clustering method. Section 6 concludes the paper.
2
Related work
In this section, we overview the processing of time-series documents. Then we review document clustering methods. A description of the notions of obsolescence and temporal decay, based on which we derived the document forgetting model, comes next.
2.1
Processing of time-series documents
The focus of our research is to cluster what we call time-series documents, which are documents continually delivered with timestamps, and to summarize recent hot topics. News articles, electronic mail, RSS, weblogs, etc. are examples of time-series documents. Their qualitative aggregation and summarization are important to support user activities in the Web world. Research on processing documents continually delivered in time order is an interesting research area in information retrieval and Web information management and has gained substantial interest. Intensive studies have tried to find meaningful and important information or structures in time-series documents. The following reviews some research work in this area. A research program relevant to our work is the topic detection and tracking (TDT) [1]. It is a research program organized by the National Institute of Standards and Technology (NIST) [29]. It tries to organize on-line documents like broadcast news based on the notions of events and topics. TDT tasks that process time-series documents include topic detection to detect clusters of stories that discuss the same topic; topic tracking to keep track of stories similar to a set of example stories; and new event detection to detect if a story is the first story of a new, unknown topic. In TDT, clustering approaches have been used in some TDT tasks. Research papers related to these tasks include [2, 16, 24, 36, 37] for topic detection and topic tracking tasks, and [22, 34, 38] for new event detection. TDT’s topic detection task is closely related to our work. However, our approach not only 3
clusters documents into topics, but also focuses on recent documents to generate clusters of recent topics. We describe a clustering method proposed for the topic detection task in Subsection 2.2. Chronologically ordered temporal information of time-series documents has been exploited in many different ways and domains. In recent study on weblog, Mei et al. studied the problem of discovering and summarizing the spatiotemporal theme (or subtopic) patterns in weblogs [26]. They proposed a probabilistic approach to modelling the subtopic themes and their distribution and evolution patterns over time and location. In [20], Kleinberg studied the bursts of topics in document streams. To analyze the bursts of a topic in the document stream, he considered document streams as temporal frequency data and modeled the stream using an infinite-state automaton focusing on the arrival rate of documents related to a topic. The study of bursty evolution of blogspace was conducted by Kumar et al. [21]. They created a time graph on blogspace, a graph that evolves in continuous time, by an automatic analysis of blogs’ internal timestamps and studied the evolution of connected component structure and microscopic community structure in the time graph and developed algorithms to track evolution of the blog community. They also extended Kleinberg’s method [20] to discover bursty communities of blogs that are topically and temporally focused. Cui et al. [11] analyzed topic activation from document streams based on the Kleinberg’s method [20], considering document arrival rates, relevance, temporal degradation and incremental schemes. Mei et al. [27] proposed a method to discover and summarize the evolution of thematic (i.e., subtopic) structures in a text stream. News articles and abstracts of research papers were used in their experiments. Our work differs from the existing work. We utilize temporal information of each document to assign a weight to the document. The weight decreases as the clustering evolves over time. In other words, old documents have smaller weights than recent ones. Our research addresses the issue of managing time-series documents from a perspective different from the above research. The focus of our research is to cluster time-series documents and to summarize the trend of recent hot topics. We incorporate a decaying function in the similarity measure and cluster documents incrementally based on a variant of the K-means method.
2.2
Document clustering
So far, numerous clustering approaches have been proposed. In [18], Jain et al. provides a general survey of clustering methods. They classified clustering approaches into wide ranges of categories and reviewed clustering methods in each category. Those conventional approaches generally focus on developing efficient and effective clustering methods, which group similar objects into same clusters. To our knowledge, no approaches with the same objective as our novelty-based clustering approach have appeared as we prepare this paper.
4
Here we review literature in document clustering by selecting clustering methods that are closely related to our approach. The K-means clustering method [18, 25], based on which we devise our algorithm, is one of the most widely used clustering methods. The method is known for its efficiency compared to the hierarchical clustering method. Given n objects, the method first select k objects as initial k clusters. It then iteratively assigns each object to the most similar cluster based on the mean value of the objects in each cluster. There are many variations of the K-means method. In our approach, we use the K-means method with extensions to cope with incremental processing and outlier handling. Section 4 gives details. A feature of our clustering method is its incremental processing. Incremental processing is required since the target data of our method is on-line documents that are delivered continually. Updates are needed when new documents are incorporated and when documents are deleted because they become obsolete as clustering targets. Coping with a small number of updates by re-computing the whole clustering from scratch is costly, especially when the document set is very large. There are several proposals of incremental clustering methods. Can proposed a clustering algorithm called C2 ICM (cover-coefficient incremental clustering methodology) [5], which is an incremental version of C3 M (covercoefficient-based concept clustering methodology). It is based on the concept of a cover coefficient, which measures the degree that a document is covered by other documents and determines the number of clusters and cluster seeds automatically. C2 ICM enhances C3 M, allowing documents to be incrementally added and deleted. Single-pass clustering can also be classified as an incremental clustering method. In TDT 1998 competition, Yang et al. proposed the use of a single-pass incremental clustering method for retrospective detection and on-line detection of the topic detection task [36, 37]. The method sequentially processes input documents one at a time and maintains clusters incrementally. A new document is assigned to a cluster if the similarity score between the document and the cluster is above a preselected threshold. Otherwise, a new cluster is generated and the document becomes its seed. For on-line detection, the method imposes a time window and incorporates a linear decaying-weight function into the similarity function. Their approaches revealed relatively good performance in the TDT evaluation situation. Incremental clustering is also proposed in other research areas. Charikar et al. defined an incremental clustering model for the hierarchical agglomerative clustering (HAC) in [7]. However, the approach assumes that the data is located in a metric space, and related notions, such as distances and diameters, are used. Therefore, it is not useful in our context. The same comments can be applied to other incremental clustering methods [8]. In contrast to related work, our approach extends the conventional K-means method. The reasons are as follows: 1. In clustering, there is a trade-off between efficiency and quality. The K-means 5
clustering method is a commonly used approach and its basic algorithm is quite simple. Compared to other conventional hierarchical methods, the processing cost is lower in general and suited for on-line document clustering. Although the singlepass method is superior to the K-means method in terms of processing cost, the clustering quality of the former is usually worse than that of the latter. 2. It can support incremental insertion and deletion of documents efficiently. Some existing clustering methods, which have features of incremental processing (e.g., [41]), do not support efficient deletion of old items. The feature is important in our context since old documents are obsolete and should be excluded from the clustering targets. 3. It can be extended to be robust for outliers. As shown later, our similarity function causes the effect that old documents are “forgotten” and no longer considered— they become outliers. Although the existence of outliers adversely affects clustering results, our extension to the K-means method can avoid such problems. The clustering algorithm is detailed in Section 4.
2.3
Obsolescence and temporal decay
The notion of obsolescence has been widely studied in library information science and informetrics [15]. Obsolescence is the decrease in the use of documents as they age. Obsolescence is also called aging or decay [13]. Previous studies on the aging of documents have highlighted the behavior and tendency of how the citation of a paper or journal rises or falls. For example, in a study on citation analysis of individual papers or journals, Avramescu [3] suggested the following equation for the citation distribution of papers and journals: y(t) = C(e−αt − e−βt ), (1) where β > α and C is a constant. The parameters α and β are used to model growth and decay of citations, respectively. That is, at the beginning of its publication, the number of citations of the paper or journal is zero. It then increases to a degree depending on the significance of the paper or journal; it reaches maximum and then begins to fall. In other words, the model states that the number of citations rises exponentially and also decreases exponentially. Temporal decay functions such as linear and exponential decay functions are often used in other areas such as clustering [6, 28], TDT research [36, 37], and stream data processing [10]. The similarity measure used in this paper incorporates an exponential aging function derived from the document forgetting model [17], which is presented in Subsection 3.2. The model assumes that, at the beginning, the influence value (weight) of a document takes the highest value one. The value then exponentially decreases according to a decay 6
factor value. Adoption of the exponential decay factor in the similarity function used in this paper is derived based on the previously well-studied approach in obsolescence. Beyond that, the exponential decay function enables efficient incremental update, as explained in Subsection 3.5.
3
A novelty-based similarity measure
In this section, we describe the proposed similarity metric incorporating the notion of temporal decay. Firstly, we introduce the document forgetting model, followed by a description of the similarity measure derived from the model. Then we explain the method to set parameter values introduced in our method. As a final item, we show the efficient computation approach for the update of the statistics and probabilities required to compute similarity scores.
3.1
Symbols and definition
Table 1 summarizes the definitions of symbols used in this paper.
3.2
Document forgetting model
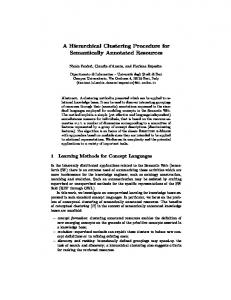
The document forgetting model plays an important role in our method. The model is based on a simple intuition: on-line documents such as news articles and journal articles maintained in a document repository lose their values gradually as time passes. We propose the following exponential weighting formula to represent decay of a document’s influence value. Definition 1 (Document weight) Let the current time be t = τ and the acquisition time of each document di (i = 1, . . . , n) be Ti (Ti ≤ τ ). We define the weight of di at time τ , dwi |τ , by def dwi |τ = λτ −Ti (0 < λ < 1), (2) where λ is a parameter tuned according to the target document set and the intended application. We call λ a forgetting factor. Figure 1 depicts the exponential degradation of the document weight. When a document is acquired, its document weight is one. As time passes, the weight decreases exponentially. Decay speed is specified by the forgetting factor λ. The smaller the value of λ, the faster the forgetting speed becomes. For the acquisition time of on-line documents, we can use the issue date as the acquisition time. The notation “|τ ” is used to represent the value of a variable at time τ . If the context is clear, we omit “|τ ”. We describe an intuitive way of setting the forgetting factor λ’s value in Subsection 3.4. The reasons for selecting this exponential forgetting model are summarized as follows: 7
Table 1: Symbols and their definitions Symbol di λ Ti τ dwi x|τ Pr(di ) tdw tk Pr(tk |di ) Pr(tk ) Pr(di , dj ) sim(di , dj ) tfik fik idfk leni ε β γ G avg sim(Cp )
Definition document in the document set forgetting factor acquisition time of di current time weight of di value of variable x at current time selection probability of di total weight of documents in the document set index term probability that tk is selected from di occurrence probability of tk co-occurrence probability of di and dj similarity score between di and dj term frequency of tk in di number of occurrences of tk in di inverse document frequency of tk document length of di expiration parameter half-life span parameter life span parameter clustering index average similarity of documents in cluster Cp
1. The document forgetting model is based on the concept of obsolescence in citation analysis. We borrowed the basic idea of “exponential forgetting” from citation analysis literature — a typical one is shown in Eq. (1). However, we simplified it to provide a concise model and efficient implementation. The document forgetting model is based on the intuition that on-line documents such as news stories receive immediate attention from readers at the beginning, but their interest falls gradually based on exponential forgetting. 2. Using the exponential forgetting factor explained above, we can formulate an efficient statistics maintenance method for our clustering method. Details of the maintenance method are described in Subsection 3.5. 3. By simply using one parameter λ to control the degree of weight decay in the docu8
dwi 1
λτ −Ti τ
Ti
t
Figure 1: Exponential decay function ment forgetting model, the information value of every document decays at the same rate. It provides a basis for the efficient implementation of our cluster maintenance method. Although we could use different λ values for different documents, such an approach would result in high processing cost, which is not suited to on-line environments.
3.3
Similarity measure based on document forgetting model
In this subsection, we derive the document similarity measure based on a probabilistic model by considering the document forgetting model introduced above. In the following, we represent the documents in a document set by di (i = 1, . . . , n) and all the index terms in the document set by tk (k = 1, . . . , m). We assume that the acquisition time of the documents d1 , d2 , . . . , dn satisfies the relationship T1 ≤ T2 ≤ · · · ≤ Tn . Definition 2 (Document selection probability) Let Pr(di ) be the subjective probability to randomly select a document di from the document set. We define Pr(di ) as follows: def dwi Pr(di ) = , (3) tdw where dwi is the weight of di shown in Eq. (2) and tdw is the total weight of all documents in the document set: n def
tdw =
X
dwi .
(4)
i=1
The selection probability of a document is proportional to its weight. This means that old documents have smaller selection probabilities than newer ones. The probability plays an important role in incorporating the notion of forgetting in the similarity function. We next derive the conditional probability Pr(tk |di ) whose term tk is selected from document di . We simply derive the probability based on the number of occurrences of terms in a document. 9
Definition 3 (Term occurrence probability) Let tk be an index term, fik be the number of occurrences of term tk within document di . Then the conditional probability Pr(tk |di ) that tk is selected from di based on a random selection is fik def Pr(tk |di ) = Pm l=1
fil
.
(5)
The occurrence probability of tk in the entire document set can be derived by Pr(tk ) =
n X
Pr(tk |di ) · Pr(di ).
(6)
i=1
Using the above formulas and the Bayes’ theorem, we obtain Pr(dj |tk ) =
Pr(tk |dj ) Pr(dj ) . Pr(tk )
(7)
Now we consider the conditional probability Pr(dj |di ). It can be expanded as Pr(dj |di ) =
m X
Pr(dj |di , tk ) Pr(tk |di ).
(8)
k=1
We make an assumption that Pr(dj |di , tk ) ' Pr(dj |tk ) is approximately hold, then we get Pr(dj |di ) '
m X
Pr(dj |tk ) Pr(tk |di ).
(9)
k=1
Based on the above formulas, we also get Pr(di , dj ) = Pr(dj |di ) · Pr(di ) m Pr(di ) Pr(dj ) X fik fjk ' Pm . Pm l=1 fil l=1 fjl k=1 Pr(tk )
(10) (11)
This formula says that the co-occurrence probability between the two documents is based on their novelty, basically implied by Pr(di ) and Pr(dj ), and the contents of the documents. Next, we transform the above formulas to more simple ones using vector representation. Definition 4 (Vector representaiton) The document vector di of di is defined as def
di = (tfi1 · idf1 , tfi2 · idf2 , . . . , tfim · idfm ),
(12)
where tfik is the term frequency of tk within di def
tfik = fik ,
(13)
and idfk is the inverse document frequency (IDF) of tk 1
def idfk = q
Pr(tk )
.
(14)
Let leni be the document length of di : def
leni =
m X l=1
10
fil .
(15)
Using the vector representation, Eq. (11) can be transformed as: Pr(di , dj ) = Pr(di ) Pr(dj )
di · dj . leni × lenj
(16)
This co-occurrence probability Pr(di , dj ) is derived based on the notion of document novelty and the tf · idf weighting scheme of the conventional vector space model. Finally, we define the similarity metric as follows: Definition 5 (Similarity measure) Given two documents di and dj , their similarity score is defined as def sim(di , dj ) = Pr(di , dj ). (17) This definition says the co-occurrence probability between di and dj is used for their similarity score. Pr(di , dj ) is a probability to select di and dj when we select two documents randomly from the document repository. The probability will be large when two documents have similar term occurrence patterns and they have recent timestamps. On the other hand, the probability will be small when two documents do not share same terms and/or at least one of the documents is old. That means when a document is old, the chance the document finds similar documents is quite rare. Therefore, such an old document tends to be an outlier when we perform clustering. As described later, our clustering algorithm carefully excludes the influences of outliers so that clustering focusing on recent documents can be attained. In summary, our definition of document similarity — namely, document co-occurrence probability — assumes the following document-pair selection process: 1. When we select a pair of documents randomly from the document repository, two documents with similar contents (term occurrence patterns) have more chance to be selected. This is a natural assumption in information retrieval. We have derived a variation of the tf · idf weighting of the conventional vector space model in a probabilistic manner. In our framework, however, we consider an additional assumption. 2. A random document selection probability (Eq. (3)), which influences the documentpair selection probability, depends on the age of the document. The probability is determined by the forgetting model shown in Eq. (2). Incorporation of the second assumption is an inherent feature of our approach. The assumption is incorporated as a subjective probability of document selection into the probabilistic similarity derivation. The idea of exponential forgetting is inherited from the idea in informetrics, and the appropriateness of the model is examined in the experimental evaluation. 11
3.4
Intuitive parameter setting
Our clustering method has two important parameters: • forgetting factor λ (0 < λ < 1): It specifies the speed of forgetting and is introduced in Subsection 3.2. • expiration parameter ε (0 < ε < 1): This parameter is used as a threshold value to control the clustering process. When the weight of a document (dwi ) becomes smaller than ε (dwi ≤ ε), the document is omitted from the clustering process. To help decide these parameters, we use the following metaphors to impart intuitive meanings. To set the parameters λ and ε, we assume that the user gives a β value and a γ value, respectively. Their definitions are given below. Definition 6 (Half-life span and life span) A half-life span parameter β specifies the period that a document loses half of its weight. Namely, β satisfies λβ = 1/2. A life span parameter γ specifies the period that a document is “active” as the target of clustering. Then, the forgetting factor λ and the expiration parameter ε can be derived as follows: Ã
log 2 λ = exp − β γ ε = λ .
!
(18) (19)
A half-life span is a traditional concept in citation analysis [13, 15]. It is a measure of how long articles in a journal continue to be cited after publication. In our approach, we borrowed the idea from citation analysis since it provides a more intuitive way for ordinary users. For example, the parameter setting β = 7 days is easier to interpret than its equivalent parameter setting λ = 0.91. The notion of a life span is also an intuitive way to specify the expiration period. Since our clustering method clusters a time series of documents continually using novelty-based similarity, older documents become obsolete and do not contribute to the clustering result. Therefore, the expiration of obsolete documents is effective to reduce the processing cost and it does not degrade clustering quality. The procedure to delete obsolete documents is covered in Appendix B.
3.5
Efficient updates of statistics and probabilities
We introduced the document similarity measure in Subsection 3.3. Since some of the statistics and probabilities used in its definition (e.g., Pr(di ) and Pr(tk )) change their values when time has passed and when new documents are incorporated into the document set, we have to recompute their new values. Since the recomputation becomes costly for 12
large data sets, we devise an update method based on an incremental computation. It fully uses the previous statistics and probabilities values to achieve efficient updates. In practice, the statistics values at each update are stored persistently for use in subsequent updates. Because the exponential forgetting factor λ is used, we can incrementally update the statistics and probabilities used in our clustering method. The formulas at the current time of update of these statistics and probabilities can be rewritten into the function of the forgetting factor λ or the function of the statistics and probabilities of the previous update. Since the values of the statistics and probabilities of the previous update are available, we can compute the update by reusing the previous statistics incrementally with low update overhead. For example, assume that the last update was performed at t = τ and that new documents are incorporated at t = τ + ∆τ . To compute a new clustering result at t = τ + ∆τ , we need statistics values. Statistics for new documents should be obtained, but we need additional care since some statistics values (dwi , tdw, Pr(di ), and Pr(tk ), etc.) change over time. If we store previous statistics values, say dwi |τ , we can calculate new statistics values incrementally such as: dwi |τ +∆τ = λτ +∆τ −Ti = λ∆τ dwi |τ This is possible because of the exponential forgetting formula. Extending this idea, we can achieve low statistics update cost, which is linear in terms of the number of documents (n) and the number of index terms (m). In contrast, the naive approach, which computes an update from scratch, requires cost proportional to n × m. Formulation of incremental update is detailed in Appendix A.
4
Clustering algorithm
4.1
K-means method
The K-means method is a commonly used clustering method in information retrieval and other related research areas. By iteration, the method tries to refine the clusters of the previous iteration. The general algorithm is as follows: 1. Select K documents randomly as initial K clusters then generate initial cluster representatives. 2. Compare each remaining document with the cluster representatives and assign it to the most appropriate cluster. 3. When there is no change to the cluster assignment result, terminate the procedure. Otherwise, recompute the cluster representatives and return to Step 2. 13
The basic algorithm is quite simple; however, we need to clarify the following points clearly for practical implementation: • the definition of cluster representatives, • the criteria to select the most appropriate cluster in Step 2, • the convergence condition of clustering used in Step 3. In our clustering algorithm, we consider the extension to Steps 2 and 3 of the original K-means method.
4.2
Clustering index
The clustering index is a measure used to control the convergence criterion of clustering. At each iteration, the index is used to evaluate the quality of the clustering and to decide whether to stop the clustering process. Definition 7 (Clutering index) Let G be the clustering index, K be the number of clusters to be generated and |Cp | be the number of documents in cluster Cp . G is defined as: def
G=
K X
|Cp | · avg sim(Cp ),
(20)
p=1
where avg sim(Cp ) is the average similarity of documents in cluster Cp and is defined as: def
avg sim(Cp ) =
X X 1 sim(di , dj ). |Cp |(|Cp | − 1) di ∈Cp dj ∈Cp , di 6=dj
(21)
The intra-cluster similarity, avg sim(Cp ), is used as a measure to decide the goodness and poorness of a clustering result.
4.3
Clustering procedure
The clustering algorithm is shown in Figure 2. It introduces a clear criterion for clustering convergence and for handling outliers. The handling of outliers is especially important in our clustering method because most old documents have low similarities with other documents due to the process of forgetting, and therefore tend to become outliers. The clustering method excludes documents that do not contribute to improved cluster quality. Documents put in the outlier list are regarded as normal documents in the next iteration because they may not fall in the outlier list again next time, since the contents of clusters will change. In Step 1 of the iteration process of the clustering method, the computation overhead of the average similarity, avg sim, shown in Eq. (21) is very large. We have developed an efficient calculation method for it using cluster representatives by extending the idea of Scatter/Gather [12]. Details are given in Appendix C. 14
• Initial process 1. Select K documents randomly and form initial K clusters. 2. Compute cluster representatives. 3. Compute intra-cluster similarities and clustering index G. • Iteration process 1. For each document d, do the following two steps: (a) For each cluster, compute the intra-cluster similarity when d is appended to the cluster. (b) Assign d to a cluster such that the assignment causes the largest increase in the intra-cluster similarity. If no assignment increases the intra-cluster similarity, put d into the outlier list. 2. Recompute cluster representatives. 3. Recompute G and take it as Gnew . 4. If (Gnew − Gold )/Gold < δ, terminate, where δ is a pre-defined constant. 5. Otherwise, return to Step 1. Figure 2: Clustering algorithm
5
Experimental evaluation
This section describes the experiments to evaluate performance of our approach with the TDT2 corpus. In this evaluation, we also considered comparing the performance of our clustering method with other conventional document clustering methods such as a hierarchical agglomerative clustering method (e.g., Scatter/Gather [12]) and a sequential clustering method (e.g., [36]). However, these methods are not suited for our clustering context. The hierarchical clustering method works very slowly. In our clustering context, new documents are appended and obsolete documents are deleted periodically. Reconstruction of the cluster hierarchy at each update, however, is very costly. The sequential clustering method, on the other hand, allows incremental incorporation of new documents. When new documents are appended, the method decides whether it should assign each document to an existing cluster or create a new cluster. However, this method does not consider deletion of documents. Thus it is difficult to present current “hot” clusters to users.
15
5.1
Dataset
The original TDT2 corpus [1] consists of chronologically ordered news articles obtained from six newswire sources and TV/radio broadcast services, ABC, APW, CNN, NYT, PRI and VOA, from January 4th to June 30th, 1998. The TDT2 corpus was developed by the Linguistic Data Consortium (LDC) [23]. It was used to evaluate the performance of approaches taking part in the topic detection and tracking (TDT) competition program in 1998 organized by the National Institute of Standards and Technology (NIST) [29]. There are 64,398 documents in the corpus and topics are assigned to documents to describe their topics. 96 topics were selected randomly. Beyond that there are two levels of relevance in a topic assignment: fully relevant (“YES”) and slightly relevant (“BRIEF”). However, only 11,201 documents were labeled with the topics. In addition, we found that many documents among the annotated documents are marked with more than one label. In this experiment, therefore, we use only those documents marked with one “YES” label. There are 7,578 documents corresponding to 96 topics dated from January 4th to June 30th, 1998 obtained by this selection. We call this TDT2 subset “selected TDT2 corpus”. Topics in the selected TDT2 corpus are presented in Appendix D.
5.2
Evaluation of efficiency
The objective of this evaluation is to compare the efficiency of our incremental clustering with conventional non-incremental clustering. 5.2.1
Evaluation method
The selected TDT2 dataset is split into six contiguous and non-overlapping time windows. Each time window consists of news stories over 30 days, except for the last window which comprises only 28 days. The first to sixth time windows correspond to the period Jan4Feb2, Feb3-Mar4, Mar5-Apr3, Apr4-May3, May4-Jun2, and Jun3-Jun30, respectively. Statistics of the divided time window are given in Table 2. Table 2: Statistics for 30-day time window of selected TDT2 corpus First No. of docs 1820 No. of topics 30 Min. topic size 1 Max. topic size 461 Med. topic size 16.5 Mean topic size 60.67
Second Third 2393 823 44 47 1 1 875 129 6 4 54.39 17.51
16
Fourth Fifth 570 1090 39 40 1 1 96 327 5 4.5 14.62 27.25
Sixth 882 43 1 138 4 20.51
In this experiment, we consider two types of update processes: Non-incremental process: All documents in each time window are used as an input. Incremental process: The system incrementally updates the clustering result when new documents are delivered. To model this process, non-incremental clustering is first performed on the first Jan4-Feb2 time window as an initial step. After the initial clustering, the incremental process is used. The documents in the selected TDT2 corpus from February 3rd to June 30th are incrementally given with three days as an input unit. For both processes, clustering is performed using two sets of parameters: • half-life span β = 7 days, life span γ = 30 days and K = 24, • half-life span β = 30 days, life span γ = 30 days and K = 24. These half-life span values, β = 7 days and β = 30 days, correspond to forgetting factor values λ = 0.91 and λ = 0.98, respectively. Choosing parameters with quite different values may provide clear insight into the effect of the half-life span on the performance of the clustering method. In addition, the life span γ = 30 days enables all documents to stay active during the clustering period since the 30-day time window length is used. The experiment is run on a PC with a 3.2 GHz Pentium 4 CPU and 1 GB of RAM. The program is written using the Ruby programming language and executed in the Cygwin environment. 5.2.2
Evaluation results
To evaluate the efficiency of the incremental and non-incremental approaches, the computation times of statistics update and clustering consumed by the two processes are compared. Table 3 and Table 4 show the computation times required by the non-incremental and incremental clustering approaches for β = 7 days and β = 30 days, respectively. Computation time for the incremental process is the average computation time required by the incremental process to execute the three-day dataset in each time window. In the first column of the tables, “IP” stands for the incremental process and “NIP” is short for the non-incremental process. The tables suggest that with the incremental process, we can achieve faster statistics update and clustering time in general. In statistics update, the computation time is approximately proportional to the number of documents to be updated. Since the number of documents to be updated by the incremental process is relatively small compared to the ones to be processed by the non-incremental process, the incremental process is more efficient than the non-incremental process. For clustering, the computation time 17
Table 3: Computation time in seconds (β = 7) Dataset Feb3-Mar4 (IP/NIP) Mar5-Apr3 (IP/NIP) Apr4-May3 (IP/NIP) May4-Jun2 (IP/NIP) Jun3-Jun30 (IP/NIP)
Statistics Update 135 / 1585 93 / 698 48 / 535 69 / 917 63 / 712
Clustering 581 / 939 383 / 217 89 / 220 172 / 499 180 / 337
Table 4: Computation time in seconds (β = 30) Dataset Feb3-Mar4 (IP/NIP) Mar5-Apr3 (IP/NIP) Apr4-May3 (IP/NIP) May4-Jun2 (IP/NIP) Jun3-Jun30 (IP/NIP)
Statistics Update 133 / 1594 89 / 674 49 / 536 72 / 887 65 / 722
Clustering 451 / 913 265 / 239 80 / 149 134 / 256 156 / 247
depends heavily on the characteristics of the documents themselves and on the number of iterations. In incremental clustering, a new cluster structure does not change much from the previous structure even if a small number of documents are added and/or deleted, thus the incremental approach achieves faster computation time due to its fast convergence.
5.3
Evaluation of effectiveness
In this subsection, we evaluate effectiveness of the novelty-based clustering method. The objective of the evaluation is to compare effectiveness of the incremental novelty-based clustering method with the non incremental method. Settings for the experiments are the same as those in Subsection 5.2. 5.3.1
Basic evaluation measures
We introduce the evaluation method for clustering performance used in the experiments. For each cluster, the documents in the cluster are compared with the selected TDT2 topics. The number of documents which correspond to each topic and are generated in the cluster is counted and represented by a. The remaining documents in the cluster which do not belong to the topic are counted and represented by b while c is the number of documents which discuss the topic but are not generated in the cluster. They are summarized in the following Table 5. 18
Table 5: Distribution of documents
In cluster Not in cluster
On topic a c
Not on topic b d
Clustering results are then evaluated by the following performance measures [4, 35]: a a+b a Recall: r = a+c 2rp 2a F1 = = r+p 2a + b + c
Precision: p =
(22) (23) (24)
F1 is a harmonic mean of recall and precision. For each cluster, the precision, recall and F1 are computed. We say that a cluster is marked with a topic if the precision of the topic in the cluster is equal to or greater than a predefined threshold. In the experiments, we use 0.60 as the threshold value. If a cluster does not have such a topic, the cluster is not marked with any topic. We measure the global performance of our method by microaverage F1 and macroaverage F1 [35]. Microaverage F1 is obtained by merging Table 5 for each marked cluster by summing the corresponding cells and then using the merged table to produce global performance scores. Macroaverage F1 is obtained by producing per-cluster F1 scores, then averaging the corresponding scores. These two measures are expressed by the following mathematical formulas: Pk
2ai i=1 (2ai + bi + ci )
Microaverage F1 = Pk Macroaverage F1 =
i=1
k 1X F1 (ci ) k i=1
(25) (26)
To assess the quality of clusters produced by the incremental and the non-incremental processes, the precision and recall and the macroaverage F1 and microaverage F1 are computed. 5.3.2
Evaluation results
Figures 3 and 4 show the macroaverage F1 and microaverage F1 scores of the incremental and non-incremental clustering results on each specific date using β = 7 days and β = 30 days, respectively. In the figure, the dates on the x-axis are the dates that the clustering results are observed.
19
0.9 0.8 0.7
1 F
0.6 0.5 0.4 0.3 0.2 2-Feb
4-Mar
3-Apr
3-May
2-Jun
2-Jul
1-Aug
Macroaverage F1 for Incremental
Macroaverage F1 for Non-incremental
Microaverage F1 for Incremental
Microaverage F1 for Non-incremental
Figure 3: F1 scores (β = 7) These results show that the quality of clusters of the incremental process is generally better than the non-incremental process. The non-incremental approach consumes the thirty-day dataset in an execution. The incremental approach, on the other hand, executes clustering on a three-day basis. Thus, clustering effort of the incremental approach is tenfold that of the non-incremental approach. With more executions, the incremental approach has chances to optimize the association between documents in the clusters and therefore produces better clustering results.
5.4
Evaluation of the effect of parameters
The objective of the evaluation is to examine the effect of parameters on the clustering method and to investigate appropriate K values for various values of the half life span parameter. 5.4.1
Evaluation criteria based on topic novelty
Since the goal of our clustering method is to generate clusters reflecting the trend of recent topics, recent topics must be identified. As the TDT2 evaluation dataset does not provide novelty information, this subsection introduces the evaluation method used in the experiments. In the experiments, 60 days is considered a unit time window. A topic is judged as recent (R) if the topic has at least two documents in the interval 51st-60th day. Otherwise, if it has at least two documents in the interval 31st-50th day, it is judged as less recent (LR). If a topic is neither recent nor less recent, it is considered old (O). For example, 20
0.9 0.8 0.7
1 F
0.6 0.5 0.4 0.3 0.2 2-Feb
4-Mar
3-Apr
3-May
2-Jun
2-Jul
1-Aug
Macroaverage F1 for Incremental
Macroaverage F1 for Non-incremental
Microaverage F1 for Incremental
Microaverage F1 for Non-incremental
Figure 4: F1 scores (β = 30) according to the histogram in Figure 5, topic “Unabomber” is an old topic in the Jan4Mar4 and May4-Jun30 time windows and a recent topic in the Mar5-May3 time window. In the histogram in Figure 6, topic “NBA finals” is a less recent topic in the May4-Jun30 time window. 5.4.2
Evaluation method
The selected TDT2 corpus is divided into three contiguous and non-overlapping time windows, Jan4-Mar4, Mar5-May3, and May4-Jun30. Each time window consists of news stories of 60 days, except for the last time window, which has only 58 days. The statistics of the time windows are given in Table 6. Table 6: Statistics for 60-day time window of selected TDT2 corpus
No. of docs No. of topics Min. topic size Max. topic size Med. topic size Mean topic size
Jan4-Mar4 Mar5-May3 May4-Jun30 4213 1393 1972 51 61 54 1 1 1 1251 189 414 16 5 8 82.61 22.84 36.52
In this evaluation, we selected two half-life span values, β = 7 days and β = 60 days, 21
20077: Unabomber 40 35 30
nDoc
25 20 15 10 5 0
4-Jan
3-Feb
5-Mar
4-Apr
4-May
3-Jun
Figure 5: Histogram for topic 20077 which correspond to forgetting factor values λ = 0.91 and λ = 0.99, respectively. The idea behind this selection is that β = 7 assigns smaller weights to old documents and higher weights to recent ones in each time window, while β = 60 does not bias greatly toward recent topics. In other words, in 60 days, β = 7 causes weights of documents decayed from 0.91 to 0.003 and β = 60 from 0.99 to 0.5. The life span parameter is set to the same value, γ = 60 days, for each setting. We use the cluster number settings K = 8, 12, 16 and 32 for β = 7 and K = 16, 24, 32 and 40 for β = 60 and then execute our method on the Jan4-Mar4 time window of the selected TDT2 dataset. The motivation behind the selection of smaller values of K for β = 7 and larger values of K for β = 60 is that β = 7 causes weights of old documents to be nearly zero and does the same for their similarity scores with other documents. That is, they become obsolete and inactive. It is almost impossible for these documents to join a cluster. In the experiments, we use the non-incremental process of our method because the purpose of the experiments is to define appropriate parameter values for our clustering context. The experiments only require the final results when we have processed all documents in a time window. Therefore, the batch-oriented non-incremental version is suited to the experiments. 5.4.3
Evaluation results
Clustering results of the Jan4-Mar4 time window with different values of parameter K, which are evaluated by F1 measures and novelty evaluation, are given in Table 7 for β = 7 22
20087: NBA finals 40 35 30
nDoc
25 20 15 10 5 0
4-Jan
3-Feb
5-Mar
4-Apr
4-May
3-Jun
Figure 6: Histogram for topic 20087 and in Table 8 for β = 60. As shown in Tables 7 and 8, we see that topics detected by β = 7 are mostly recent and some less recent, whereas β = 60 detects recent, less recent, and old topics. For β = 7, topics generated by K = 8 and K = 12 are all recent topics and the number of a single topic detected in many different clusters is less than K = 16 and K = 32. In addition, the scores of macroaverage F1 and microaverage F1 are higher than K = 16 and K = 32. Therefore, we investigate the behavior of the clustering method further by applying it on the other two time windows using K = 8 and K = 12 for β = 7. The results are given in Table 9 for the Mar5-May3 time window and Table 10 for the May4-Jun30 time window. These results show that K = 8 produces higher F1 values than K = 12, but K = 12 detects more recent topics than K = 8. The clustering result for β = 60 in the Jan4-Mar4 time window (Table 8) shows that the macroaverage F1 and microaverage F1 of K = 16 are relatively high compared with other K’s. We think, however, that this K value is too small to enable enough topics to be generated. As mentioned in the preceding section, β = 60 causes the weights of documents decayed from 0.99 to 0.5 in 60 days. Namely, weights of documents by β = 60 do not decay very fast. In other words, they are still “highly active.” Thus K = 16 is not considered further. On the other hand, for the parameter setting of K = 40, this K-value may be too large and causes same topics contained in different clusters. Hence, we examine the performance of K = 24 and K = 32 on the other two time windows, Mar5-May3 and May4-Jun30. The results are given in Table 11 and Table 12. 23
Table 7: Clustering results (β = 7, Jan4-Mar4) Topic ID 20001 20002 20008 20013 20015 20018 20020 20021 20022 20023 20024 20026 20032 20039 20040 20044 #of clusters Macro F1 Micro F1
K=8 1 1
K = 12 1 1
K = 16 1 2
1 1
2 1 1
1
1
2 3 1 1 1
1 1 1
1 1 1
1 1 1
8 0.50 0.42
10 0.45 0.35
1 15 0.42 0.29
K = 32 3 2 1 4 6 1 1 1 1 1 1 1 1 2 1 1 28 0.35 0.19
Recent? R R LR R R R R R LR R LR R R R R R
Similar to the results of β = 7, these results show that K = 24 generates clusters of higher values of F1 than K = 32, but K = 32 generally detects more recent topics than K = 24. In summary, clustering results of β = 7 contain mostly recent topics and a few less recent ones, while β = 60 generates recent, less recent and old topics with higher F1 scores compared to β = 7. Smaller values of K are more suitable for β = 7 and larger values are more appropriate for β = 60. In the experiments, K = 8 and K = 12 are suggested for β = 7 to obtain high quality and novelty results, and K = 24 and K = 32 are recommended for β = 60 to obtain high quality but less novelty results.
5.5
Summary and discussion
In this evaluation, we have shown three types of evaluation methods to evaluate the performance of our clustering method; the first evaluation is aimed at comparing the efficiency of incremental and non-incremental clustering. The results from the experiments showed that incremental clustering is faster than non-incremental one; similar to the first evaluation, the second evaluation is intended to evaluate performance of the incremental and non-incremental clustering; however, here, it is in terms of the effectiveness of the two processes. The experimental results reveal that incremental clustering generally produces 24
Table 8: Clustering results (β = 60, Jan4-Mar4) Topic ID 20001 20002 20004 20007 20008 20009 20012 20013 20015 20018 20019 20021 20022 20023 20024 20026 20031 20032 20039 20044 20077 # of clusters Macro F1 Micro F1
K = 16 1 2
K = 24 4 3
1 2 1 1 1
1 2 2 1 1
1 1
1 1
1
1 1 1 1 1 1 22 0.66 0.56
1 1 1 15 0.81 0.82
K = 32 5 4 1 1 1 1 3 4 1 1 1 1 1 1 1 1 1 1 30 0.63 0.44
K = 40 5 4 1 1 1 1 1 3 7 1 1 1 1 1 1 1 1 1 2 1 1 37 0.59 0.36
Recent? R R O O LR LR LR R R R LR R LR R LR R LR R R R O
a better quality of clusters; in the third evaluation, several experiments were made to investigate the effect of parameters on the clustering method and to explore appropriate numbers of clusters, K, for different values of the half life span parameter. Results suggest that smaller values of half life span generate mostly recent topics, while larger values produce recent, less recent, and old topics. Beyond that, to achieve high quality novelty-based clusters, the results also suggest that smaller values of K should be used for small values of half life span and larger values of K should be considered for larger values of half life span. We observe that, in this evaluation, clustering results of β = 60 have higher F1 scores than the results of β = 7. This occurs because β = 7 results in a steep decrease of document weights and makes it difficult for some documents to join a cluster. However, the F1 measure does not consider “novelty” as is the case in our clustering context. Evaluating our method using F1 measure results in low values of F1 for small β clustering because many documents are forgotten in the clustering process, but are used for comparison
25
Table 9: Clustering results (β = 7, Mar5-May3) Topic ID 20001 20002 20015 20044 20047 20065 20067 20071 # of clusters Macro F1 Micro F1
K=8 1 1 1 1 1 5 0.52 0.41
K = 12 1 1 1 1 1 1 1 1 8 0.45 0.33
Recent? R R R R R R R LR
with the documents in the evaluated dataset. We should regard F1 scores, which do not consider novelty, as subordinary quality measures.
6
Conclusions and future work
In this paper, we have described our novelty-based document clustering method starting from the novelty-based similarity measure, the clustering algorithm, and experimental evaluation. We have shown that the incremental algorithm of our approach exhibits good performance in the evaluation, both in terms of efficiency and effectiveness. Smaller half life span clustering performs better in detecting recent topics while the larger half life span one performs well in a general setting in which novelty of a topic is not considered. Thus the former is more suitable for our clustering context than the latter. Further, we see that our method can answer our research problem; the method has shown that it is suited for an on-line setting where users are interested in acquiring new information. The method is more flexible and can be adapted to the user’s requirement. Using a small forgetting factor, clustering results will contain mostly new documents. But if users are interested in obtaining clusters with better quality rather than new information, then they should use a large forgetting factor. Our future work concerns the exploration of an evaluation measure that is better suited to our novelty-based clustering context. We also plan to investigate a method to show the entire process of the clustering method in a graphical user interface. This will make the system easier to use.
26
Table 10: Clustering results (β = 7, May4-Jun30) Topic ID 20001 20002 20023 20044 20083 20086 20087 20093 20096 # of clusters Macro F1 Micro F1
K=8 1 1 1 1 1 1 1 7 0.71 0.64
K = 12 1 2 1 1 1 1 1 1 1 10 0.64 0.57
Recent? R R R R R R LR R R
Acknowledgements This research is partly supported by the Grant-in-Aid for Scientific Research (16500048) from Japan Society for the Promotion of Science (JSPS), Japan, and the Grant-in-Aid for Scientific Research on Priority Areas (18049005) from the Ministry of Education, Culture, Sports, Science and Technology (MEXT), Japan. In addition, this work is supported by the grants from Kayamori Foundation of Information Science Advancement and Secom Science and Technology Foundation.
References [1] Allan, J. (ed.): Topic Detection and Tracking: Event-based Information Organization. Kluwer, Boston (2002) [2] Allan, J., Harding, S., Fisher, D., Bolivar, A., Guzman-Lara, S., Amstutz, P.: Taking Topic Detection and Tracking from Evaluation to Practice. Proc. of the 38th Hawaii International Conference on System Sciences, pp. 1–10 (2005) [3] Avramescu, A.: Actuality and Obsolescence of Scientific Literature. Ameri. Societ. for Info. Sci. 30, pp. 296–303 (1979) [4] Baeza-Yates, R., and Ribeiro-Neto, B.: Modern Information Retrieval. AddisonWesley, Harlow, England (1999) [5] Can, F.: Incremental Clustering for Dynamic Information Processing. ACM Trans. Inf. Sys. 11(2), pp. 143–164 (1993) 27
Table 11: Clustering results (β = 60, Mar5-May3) Topic ID 20001 20002 20015 20019 20023 20024 20032 20039 20042 20044 20047 20048 20056 20063 20065 20067 20071 20076 20077 # of clusters Macro F1 Micro F1
K = 24 3 1 1 1 1 1 1 1 1 2 1 1 1 2 2
20 0.72 0.70
K = 32 2 1 3 1 1 1 1 1 3 1 2 1 1 2 1 2 1 1 26 0.68 0.63
Recent? R R R LR R O O O O R R LR R R R R R R R
[6] Chakrabarti, D., Kumar, R., Tomkins, A.: Evolutionary Clustering. Proc. of 12th ACM SIGKDD conference, pp. 554–560 (2006) [7] Charikar, M., Chekuri, C., Feder, T., Motwani, R.: Incremental Clustering and Dynamic Information Retrieval. Proc. of 29th ACM Symposium on Theory of Computing (STOC), El Paso, Texas, USA, May 4-6, pp. 626–635 (1997) [8] Chaudhuri, B.B.: Dynamic clustering for time incremental data. Pattern Recognition Letters, 15(1), pp. 27–34 (1994) [9] Chen, H.H., Kuo, J.J., Huang, S.J., Lin, C.J., Wung, H.C.: A Summarization System for Chinese News from Multiple Sources. Journal of the Ameri. Socie. for Info. Sci. and Tech. (JASIST), 54(13), pp. 1224–1236 (2003) [10] Cohen, E., Strauss, M.: Maintaining Time-Decaying Stream Aggregates. Proc. of 20th ACM Symposium on Principles of Database Systems, San Diego, California June 9-11, pp. 223–233 (2003)
28
Table 12: Clustering results (β = 60, May4-Jun30) Topic ID 20001 20002 20004 20005 20008 20015 20019 20023 20044 20047 20070 20071 20072 20074 20076 20077 20082 20086 20087 20091 20093 20096 20098 # of clusters Macro F1 Micro F1
K = 24 3 3 1
K = 32 3 5 1
1 1 1 1 1 1 1 1 1 1 2 1 1 1 1 1 23 0.77 0.74
1 1 3 2 1 1 1 1 1 2 1 1 1 2
Recent? R R LR O LR R LR R R R R LR LR LR LR O O R LR R R R O
29 0.66 0.57
[11] Cui, C., Kitagawa, H.: Topic Activation Analysis for Document Streams Based on Document Arrival Rate and Relevance. Proc. of the 20th Annual ACM Symposium on Applied Computing, Santa Fe, New Mexico, March 13-17, pp. 1089–1095 (2005) [12] Cutting, D., Karger, D.R., Pedersen, J.O., Tukey, J.W.: Scatter/Gather: A Clusterbased Approach to Browsing Large Document Collections. Proc. of 15th ACM SIGIR conference, pp. 318–329 (1992) [13] Diodato, V.: Dictionary of Bibliometrics. The Haworth Press, New York (1994) [14] Eichmann, D., Srinivasan, P.: Adaptive Filtering of Newswire Stories using TwoLevel Clustering. Information Retrieval, 5, pp. 209–237 (2002) [15] Egghe, L., Rousseau, R.: Introduction to Informetrics: Quantitative Methods in Library, Documentation and Information Science. Elsevier, Amsterdam (1990) 29
[16] Franz, M., McCarley, J.S., Ward, T., Zhu, W.J.: Unsupervised and Supervised Clustering for Topic Tracking. Proc. of ACM SIGIR Conference, pp. 310–317 (2001) [17] Ishikawa, Y., Chen, Y., Kitagawa, H.: An On-line Document Clustering Method Based on Forgetting Factors. Proc. of 5th European Conference on Research and Advanced Technology for Digital Libraries (ECDL), Darmstadt, Germany, September 4-9, pp. 325–339, (2001) [18] Jain, A.K., Murty, M.N., Flynn, P.J.: Data Clustering: A Review. ACM Computing Surveys 31(3), (1999) [19] Khy, S., Ishikawa, Y., Kitagawa, H.: Novelty-based Incremental Document Clustering for On-line Documents. Proc. of 2nd International Workshop on Challenges in Web Information Retrieval and Integration (WIRI), Atlanta, April 3, pp. 41–50 (2006) [20] Kleinberg, J.: Bursty and Hierarchical Structure in Streams. Proc. of ACM SIGKDD Conference, pp. 91–101 (2002) [21] Kumar, R., Novak, J., Raghavan, P., Tomkins, A.: On the Bursty Evolution of Blogspace. World Wide Web Journal 8(2), pp. 159–178, June (2005) [22] Kumaran, G., Allan, J.: Text Classification and Named Entities for New Event Detection. Proc. of ACM SIGIR Conference, pp. 297–304 (2004) [23] Linguistic Data Consortium (LDC), http://www.ldc.upenn.edu/ [24] Leuski, A., Allan, J.: Improving Realism for Topic Tracking Evaluation. Proc. of ACM SIGIR Conference, pp. 89–96 (2002) [25] MacQueen, J.: Some Methods for Classification and Analysis of Multivariate Observations. Proc. of 5th Berkeley Symp. Math. Statist. Prob., 1, pp. 281–297 (1967) [26] Mei, Q., Liu, C., Su, H.: A Probabilistic Approach to Spatiotemporal Theme Pattern Mining on Weblogs. Proc. of WWW Conference, pp. 533–542 (2006) [27] Mei, Q., Zhai, C.X.: Discovering Evolutionary Theme Patterns from Text – An Exploration of Temporal Text Mining. Proc. of SIGKDD Conference, pp. 198–207 (2005) [28] Nallapati, R., Feng, A., Peng, F., Allan, J.: Event Threading within News Topics. Proc. of 13th ACM CIKM conference, pp. 446–453 (2004) [29] National Institute of Standards http://www.nist.gov/speech/tests/tdt/ 30
and
Technology
(NIST),
[30] Radev, D., Otterbacher, J., Winkel, A., Blair-Goldensohn, S.: NewsInEssence, Summarizing Online News Topics. Proc. of Communications of the ACM, pp. 95–98 (2005) [31] Salton, G., McGill, M.J.: Introduction to Modern Information Retrieval. McGrawHill, New York (1983) [32] Salton, G.: Automatic Text Processing: The Transformation, Analysis, and Retrieval of Information by Computer. Addison-Wesley Publishing, Reading, Massuchusetts (1989) [33] Sebastiani, F.: Machine Learning in Automated Text Categorization. ACM Computing Surveys, 34(1), pp. 1–47 (2002) [34] Stokes, N., Carthy, J.: First Story Detection using a Composite Document Representation. Proc. of the first International Conference on Human Language Technology Research, San Diego, USA, pp. 1–8 (2001) [35] van Rijsbergen, C.J.: Information Retrieval. Butter Worths, Sydney (1979) [36] Yang, Y., Pierce, T., Carbonell, J.G.: A study on retrospective and on-line event detection. Proc. of 21st ACM SIGIR Conference, pp. 28–36 (1998) [37] Yang, Y., Carbonell, J.G., Brown, R.G., Pierce, T., Archibald, B.T., Liu, X.: Learning Approaches for Detecting and Tracking News Event. IEEE Intel. Sys. 14(4), July/August, pp. 32–43 (1999) [38] Yang, Y., Zhang, J., Carbonell, J., Jin, C.: Topic-conditioned Novelty Detection. Proc. of ACM SIGKDD Conference, pp. 688–693 (2002) [39] Zhang, Y., Chu, C.H., Ji, X., Zha, H.: Correlating Summarization of Multi-source News with K-way Graph Bi-clustering. SIGKDD Explorations, 6(2), pp. 34–42 (2004) [40] Zhang, Y., Yu, J.X., Hou, J.: Web Communities Analysis and Construcion. Springer, Germany (2006) [41] Zhant, T., Ramakrishnan, R., Livny, M.: BIRCH: An Efficient data clustering method for very large databases. Proc. of ACM SIGMOD Conference, pp. 103–114 (1996)
31
Appendix A Update method of statistics and probabilities Let the last update time of the given document set consisting of n documents d1 , . . . , dn be t = τ . Namely, the most recent documents are incorporated into the document set at t = τ . Then suppose that n0 new documents dn+1 , . . . , dn+n0 are appended at the time t = τ +∆τ . Therefore, their acquisition times are Tn+1 = · · · = Tn+n0 = τ +∆τ . Let all the index terms contained in the document set at time t = τ be t1 , . . . , tm and the additional terms incorporated by the insertion of documents dn+1 , . . . , dn+n0 be tm+1 , . . . , tm+m0 . In the following discussion, we assume that n À n0 and m À m0 hold. 1. Updating of dwi ’s: First we consider the update of document weights of documents d1 , . . . , dn . We have already assigned a weight dwi |τ to each document di (1 ≤ i ≤ n) at the last update time t = τ . These weights have to be updated to dwi |τ +∆τ in this update time. Since the relationship dwi |τ +∆τ = λτ +∆τ −Ti = λ∆τ dwi |τ
(27)
holds between dwi |τ and dwi |τ +∆τ , we can easily derive dwi |τ +∆τ from dwi |τ by simply multiplying λ∆τ to dwi |τ . This property for the efficient update is due to the selection of the exponential forgetting factor in our document forgetting model. For the new incoming documents dn+1 , . . . , dn+n0 , we simply set dwi |τ +∆τ = 1 (n + 1 ≤ i ≤ n + n0 ). The computational complexity of this step is estimated as O(n + n0 ) ≈ O(n). 2. Updating of tdw: For the total weight of all the documents tdw, we can utilize the following update formula: tdw|τ +∆τ =
0 n+n X
λτ +∆τ −Tl = λ∆τ tdw|τ + n0 .
(28)
l=1
The processing cost is O(1). 3. Calculation of Pr(di )’s: Pr(di ), the occurrence probability of document di , is given by dwi |τ +∆τ Pr(di )|τ +∆τ = . (29) tdw|τ +∆τ Since we have already obtained dwi |τ +∆τ and tdw|τ +∆τ in Step 1 and 2, we can easily calculate Pr(di ) when it is required. 4. Maintenance of Pr(tk |di )’s: Since Pr(tk |di ) does not depend on time, we have to compute it only for the new documents dn+1 , . . . , dn+n0 . If we roughly suppose that the number of terms contained in each document be a constant c, this step requires O(cn0 ) = O(n0 ) computation time. 32
5. Updating of Pr(tk )’s: The formula of Pr(tk )|τ can be transformed as Pr(tk )|τ =
n X dwi |τ i=1
=
tdw|τ
· Pr(tk |di )
n 1 X dwi |τ · Pr(tk |di ). tdw|τ i=1
(30)
f Now we define Pr(t k )|τ as def
f Pr(t k )|τ =
n X
dwi |τ · Pr(tk |di ),
(31)
i=1
then Pr(tk )|τ is given by Pr(tk )|τ =
f Pr(t k )|τ . tdw|τ
(32)
f By storing Pr(t k )|τ instead of Pr(tk )|τ , we can achieve the incremental update. f When we need the new value Pr(tk )|τ +∆τ , we can compute it from Pr(t k )|τ +∆τ and tdw|τ +∆τ using the above formula. f We can derive the update formula for Pr(t k ): ∆τ f f Pr(t · Pr(tk )|τ + k )|τ +∆τ = λ
0 n+n X
Pr(tk |di ).
(33)
i=n+1
Now we define ∆ Prsum (tk ) as def
∆ sum Pr (tk ) =
0 n+n X
Pr(tk |di ),
(34)
i=n+1
then we get a simplified update formula ∆τ f f Pr(t · Pr(tk )|τ + ∆ Pr (tk ). k )|τ +∆τ = λ sum
(35)
Since it takes O(n0 ) time to compute a ∆ Prsum (tk ) value, we need O(n0 ·(m+m0 )) ≈ O(n0 m) time for all the documents. Based on the above discussion, the total cost to update statistics and probabilities in an incremental manner is given by O(n) + O(1) + O(n0 ) + O(n0 m) ≈ O(n + n0 m).
(36)
On the other hand, the naive scheme that calculate statistics and probabilities on each update has O((n + n0 ) · (m + m0 )) ≈ O(nm) computation time and is expensive for on-line document clustering applications. Now we summarize the above ideas. We persistently store and incrementally maintain f the following statistics: dwi ’s, tdw, and Pr(t k )’s, and achieve the update cost O(n + m). Other statistics and probabilities (Pr(di )’s, Pr(tk |di )’s, and Pr(tk )’s) are computed when they are needed. 33
B Deletion of obsolete documents To remove obsolete documents from the clustering target documents, we take the following approaches: 1. First we consider the deletion condition of old documents. In this paper, we take a simple approach: if the document weight dwi for a document di satisfies the condition dwi ≤ ε (37) for a small positive constant ε, we delete the document di . In practice, we delete the document weight dwi , maintained as described in the previous section, from a persistent storage. 2. When we delete dwi of the deleted document di , we have to propagate the deletion to other statistics. For tdw, the total weight of all the documents, we have to modify it as tdw = tdw − dwi according to its original definition. However, since now dwi ≈ 0, tdw − dwi ≈ tdw holds so that we do not have to modify tdw actually. 3. We also need to delete fik ’s, the term occurrence frequencies for di , to reduce the storage cost. Therefore, we simply delete fik ’s for all the term tk ’s that satisfy fik > 0. f 4. Additionally, we have to delete Pr(t k ) for each term tk contained in di , but we should remind that the term tk may be contained in other documents. In such a case, we should not delete these values because they are still active. To solve this problem, we simply use a reference counter for each term: when the reference counter becomes zero, we can safely delete the statistics values for the term.
C Update method of intra-cluster similarity Let m be the total number of index term. The cluster representative cp of cluster Cp is defined by def (38) cp = (cp1 , cp2 , . . . , cpm ), where def
cpk =
X Pr(di ) · tfik · idfk di ∈Cp
leni
(1 ≤ k ≤ m).
(39)
The similarity between cluster representatives of cluster Cp and Cq is defined by def
cr sim(Cp , Cq ) =
m X p q
ck ck .
(40)
k=1
The self similarity of cluster representative of cluster Cp , cr sim(Cp , Cp ), can be expanded as (41) cr sim(Cp , Cp ) = |Cp |(|Cp | − 1) · avg sim(Cp ) + ss(Cp ), 34
where ss(Cp ) is the sum of the similarity of each document in cluster Cp with itself and defined as follows: def X ss(Cp ) = sim(di , di ). (42) di ∈Cp
The average similarity in cluster Cp , avg sim(Cp ) shown in Eq. (21), can be written as avg sim(Cp ) =
cr sim(Cp , Cp ) − ss(Cp ) . |Cp |(|Cp | − 1)
(43)
If cluster Cr = Cp ∪ Cq and Cp , Cq have no same elements (Cp ∩ Cq = ∅), then avg sim(Cr ) = [cr sim(Cp , Cp ) + 2cr sim(Cp , Cq ) + cr sim(Cq , Cq ) − ss(Cp ) − ss(Cq )] /[(|Cp | + |Cq |)(|Cp | + |Cq | − 1)].
(44)
If Cq is a singleton cluster, that is Cq = {dq }, avg sim(Cr ) =
cr sim(Cp , Cp ) + 2cr sim(Cp , Cq ) − ss(Cp ) |Cp |(|Cp | + 1)
(45)
That is, to compute the avg sim of an existing cluster Cp when dq is appended to the cluster, we need to compute the similarity of cluster representatives cr sim(Cp , Cq ) only since cr sim(Cp , Cp ), ss(Cp ) and |Cp | are computed once when cluster Cp is created and can be used as many times as required in one clustering iteration. By using the Eq. (45), we can reduce the cost to re-compute avg sim when a document is appended to a cluster. We can formulate similar update formulas for deletion when a document is removed from a cluster. They are omitted due to the space.
D Selected TDT2 dataset In this section, we show the complete selected TDT2 dataset in Table 13. In the table, we show Topic ID, Count which is the total number of documents contained in the topic, and Topic Name which corresponds to the Topic ID.
35
E Examples of the clustering results In this section, we show some instances of the clustering results. Table 14 shows the result obtained on March 4, K = 24, β = 7 days, γ = 30 days, by using the incremental process mode. In Table 14, the cluster # is the system generated cluster number; # of docs is the total number of docs in each generated cluster; Keywords is the top ten high score keywords in each cluster; TDT topic is the corresponding TDT topic ID; Recall and precision is the values of the recall and precision measure of the cluster. This example shows that our clustering approach exhibits good performance in terms of cluster quality as well. It generates high precision and relatively high recall except for some clusters which have low recall. In the above table, cluster# 4 is not marked with any TDT topic. Closer look into the result reveals that the cluster is a mixture of documents on many different topics. The precision of each topic in the cluster is not large enough to marked the topic to the cluster. In addition, some topics such as topic 20015 about “Current Conflict with Iraq” and 20013 about “1998 Winter Olympics” are marked to many clusters. This is because these topics are very large and “hot topics” at that time. Thus, the temporal weights and hence similarity scores between documents in the same topics become even stronger. Similarly, we show another two clustering results in Table 15 and 16. Table 15 and Table 16 are the results for May4-Jun30 time window, β = 7, γ = 60, by using the non-incremental process with different K values; K = 8 for Table 15 and K = 12 for Table 16. Additional information, norm sim val value1 , is added in the two tables. This norm sim val is the intra-cluster similarity of a cluster. It is defined as a product of |Cp | · avg sim(Cp ) where |Cp | is the number of documents in cluster Cp and avg sim(Cp ) is the average similarity in cluster Cp . It appears in the formula of the clustering index G (Eq. (20)) and represents how the cluster is appropriate in terms of self-similarity and cluster size.
1
Please note that the value of norm sim val should be smaller or equal to the value of number of documents in the cluster. However, in the results, the values of some clusters appear greater than the number of documents in the cluster. This is because, in the implementation, we omitted non-necessary computation which involves weighting a constant factor to all similarity scores while we are in a clustering process but does not contributes to the clustering results.
36
Table 13: Selected TDT2 corpus from Jan4-Jun30 1998 Topic ID 20001 20002 20004 20005 20006 20007 20008 20009 20010 20011 20012 20013 20014 20015 20016 20017 20018 20019 20020 20021 20022 20023 20024 20025 20026 20027 20028 20029 20030 20031 20032 20033 20034 20035 20036 20037 20038 20039 20040 20041 20042 20043 20044 20046 20047 20048 20050 20052
Count 1034 923 19 38 3 15 56 47 7 18 150 530 2 1439 6 17 99 110 32 53 30 125 38 1 70 1 12 7 2 36 126 83 16 2 5 33 1 119 6 26 29 15 277 5 93 125 11 6
Topic Name Asian Economic Crisis Monica Lewinsky Case McVeigh’s Navy Dismissal & Fight Upcoming Philippine Elections Israeli Palestinian Raids Fossett’s Balloon Ride Casey Martin Sues PGA Karla Faye Tucker Mountain Hikers Lost State of the Union Address Pope visits Cuba 1998 Winter Olympics African Leaders and World Bank Pres. Current Conflict with Iraq $1 Million Stolen at WTC Babbitt Casino Case Bombing AL Clinic Cable Car Crash China Airlines Crash Tornado in Florida Diane Zamora Violence in Algeria Shevardnadze Assassination Attempt Shoplifter’s Hand Amputated Oprah Lawsuit Pharoah’s Tomb Mary Kay LeTourneau Buffett Buys Silver Pension for Mrs. Schindler John Glenn Sgt. Gene McKinney Superbowl ’98 David Satcher Comfirmed Holocaust Museum Resignation Rev. Lyons Arrested Quality of Life, NYC LaSalle Boat FOUND India Parliamentary Elections Tello (Maryland) Murder Grossberg baby murder Asteroid Coming?? Dr. Spock Dies National Tobacco Settlement Great Lake Champlain?? Viagra Approval Jonesboro shooting JJ the Whale Strike in Germany
37
Topic ID 20053 20054 20055 20056 20057 20058 20059 20060 20061 20062 20063 20064 20065 20066 20067 20068 20069 20070 20071 20072 20073 20074 20075 20076 20077 20078 20079 20080 20081 20082 20083 20084 20085 20086 20087 20088 20089 20090 20091 20092 20093 20094 20095 20096 20097 20098 20099 20100
Count 5 1 1 49 7 1 1 8 2 2 16 11 60 5 7 8 3 415 201 1 1 50 7 225 117 15 8 1 1 4 17 5 8 138 79 5 23 1 51 3 12 5 4 64 2 9 1 8
Topic Name Capps Replacement Elections Albright to Canada Boeing Discrimination Suit James Earl Ray’s Retrial? World Figure Skating Champs Guinness Gag UCONN Spring Weekend POW Memorial Museum Kenya boosts Tourism Mandela visits Angola Bird Watchers Hostage Race Relations Meetings Rats in Space! Marcus Allen Retires Spanish Dam Broken DiBella Treatment CURES Cancer? Carter reunion India, A Nuclear Power? Israeli-Palestinian Talks (London) Tony Awards Mother-Tongue Teaching Nigerian Protest Violence Food Stamps Anti-Suharto Violence Unabomber Denmark Strike Akin Birdal Shot & Wounded Human Rights.Ethiopia Bad juice Abortion clinic acid attacks World AIDS Conference Job incentives Saudi Soccer coach sacked GM Strike NBA finals Anti-Chinese Violence in Indonesia Afghan Earthquake Unwed Fathers’ Law German Train derails No Fat Drug Puerto Rico phone strike Nazi-plundered Art Turkish Military Officers Fired Clinton-Jiang Debate Martin Fogel’s law degree Cubans returned home Oregon bomb for Clinton? Goldman Sachs - going public?
Table 14: Clustering results on March 4, K = 24, β = 7, γ = 30, IP Cluster# 0
# of docs 14
1
37
2
16
3
196
4
20
5
11
6
143
7
24
8
5
9
6
10
9
11
46
12
31
13
21
14
25
15
26
16
25
17
75
18
50
19
58
20
58
21
520
22
25
23
35
Keywords georgian, shevardnadz, georgia, kidnapp, presid, attempt, observ, assassin, releas, suspect olymp, medal, snowboard, gold, marijuana, sport, rabagliatti, canadian, ross, test martin, tour, cart, pga, casei, golfer, profession, advantage, unfair, won olymp, medal, gold, won, skate, women, japan, nagano, game, winter protest, demonstr, abacha, student, ralli, govern, call, presid, dai, polic troop, gulf, iraq, georgia, persian, region, pentagon, ft, continu, anthrax iraq, agreem, weapon, council, annan, unit, secur, inspector, deal, secretari tucker, execut, death, texa, court, convict, suprem, karla, m, fay lyon, charge, church, nation, convent, baptist, theft, racket, investig, henri silver, price, buffett, investor, ounc, berkshir, market, compani, metal, percent kill, people, algeria, algier, bomb, algerian, attack, milit, islam, train iraq, kuwait, gulf, iraqi, militari, ship, oil, war, saddam, forc crash, airline, plane, taiwan, peopl, china, kill, airport, taipei, ground bomb, clinic, rudolph, atlanta, birmingham, alabama, eric, women, lyon, suspect winfrei, texa, beef, oprah, cattl, price, rancher, juri, cow, disea cabl, italian, investig, jet, marin, ski, babbitt, itali, fly, crew zamora, murder, sentenc, sheinbein, israel, kill, trial, fomer, prosecutor, life econom, indonesia, currenc, economi, presid, asian, asia, govern, crisis, suharto tornado, florida, peopl, central, victim, kill, week, damag, clinton, home hockei, team, olymp, czech, game, canada, player, gold, goal, republ lewinski, presid, clinton, jordan, monica, hous, white, investig, juri, grand iraq, presid, annan, iraqi, weapon, militari, secretari, unit, baghdad, saddam mckinnei, sexual, accus, sergeant, major, gene, armi, former, court, martial parti, india, elect, govern, seat, congress, bjp, vote, hindu, parliam
38
TDT topic 20024
Recall 0.48
Precision 1.00
20013
0.08
0.95
20008
0.70
1.00
20013
0.44
1.00
20015
0.01
1.00
20015
0.16
1.00
20009
0.96
1.00
20036
1.00
1.00
20029
1.00
1.00
20023
0.39
1.00
20015
0.04
0.85
20020
1.00
0.97
20018
0.36
1.00
20026
0.66
1.00
20019
0.25
0.65
20022
0.81
0.84
20001
0.41
1.00
20021
0.96
1.00
20013
0.13
1.00
20002
0.22
1.00
20015
0.45
0.75
20032
0.36
1.00
20039
0.54
1.00
(no topic)
Table 15: Clustering results for K = 8, β = 7, γ = 60, May4-Jun30, NIP Cluster# 0
# of docs 135
1
89
2
54
3
92
4
32
5
15
6
19
7
79
Keywords japan, asia, yen, economi, econom, market, financi, japanes, crisi, world bill, tobacco, lewinski, starr, presid, clinton, senat, hous, republican, monica presid, clinton, china, chines, right, human, jiang, beij, tiananmen, squar strike, gm, worker, plant, motor, michigan, flint, north, unit, union lewinski, presid, tripp, grand, clinton, juri, hous, white, monica, former algeria, singer, milit, berber, matoub, muslim, report, kill, peopl, algier aid, drug, world, confer, viru, geneva, research, hiv, develop, report game, bull, chicago, saudi, jazz, jordan, team, utah, nba, world
TDT topic 20001
Recall 0.54
Precision 0.80
norm sim val 34.99
(no topic)
22.33
20096
0.85
0.98
68.67
20086
0.60
0.90
69.04
20002
0.15
1
95.57
20023
0.75
0.80
66.68
20083
0.88
0.79
76.34
20087
0.81
0.81
20.29
Table 16: Clustering results for K = 12, β = 7, γ = 60, May4-Jun30, NIP Cluster# 0
# of docs 101
1
41
2
54
3
81
4
17
5
15
6
19
7
64
8
101
9
16
10
6
11
37
Keywords japan, asia, yen, economi, japanes, financi, crisi, market, econom, asian bill, tobacco, senat, republican, smoke, clinton, presid, democrat, compani, cigarett presid, clinton, china, chines, right, human, jiang, beij, tiananmen, squar strike, gm, plant, worker, motor, michigan, flint, north, unit, auto lewinski, tripp, presid, juri, grand, linda, clinton, monica, hous, white algeria, singer, milit, berber, matoub, muslim, report, kill, peopl, algier aid, drug, world, confer, viru, geneva, research, hiv, develop, report game, bull, chicago, jazz, jordan, utah, nba, citi, final, championship viagra, peopl, india, weapon, nuclear, drug, train, workder, iraq, report saudi, citi, world, report, th, team, coach, rank, expens, viagra telephon, puerto, rico, sale, dlr, compani, worker, sabotag, protest, million lewinski, presid, starr, clinton, hous, white, monica, lawyer, counsel, independ
39
TDT topic 20001
Recall 0.5
Precision 0.98
norm sim val 30.78
20044
0.35
0.80
22.03
20096
0.85
0.98
68.67
20086
0.59
1
66.30
20002
0.08
1
92.78
20023
0.75
0.80
66.68
20083
0.88
0.79
76.34
20087
0.81
1
16.55
(no topic)
12.40
(no topic)
28.10
20093
0.5
1
55.64
20002
0.18
1
40.03