Nov 15, 2010 - OH + NO2+ M. OH + CO. HO2 + O. HO2 + OH + M. HO2 + O3. HO2 + HO2. HO2 + N. HO2 + NO2+ M. H2O2 + 0. H2O2 + OH. H2O + O('D).
Atmosphere-Ocean
ISSN: 0705-5900 (Print) 1480-9214 (Online) Journal homepage: http://www.tandfonline.com/loi/tato20
A numerical model for one‐dimensional simulation of stratospheric chemistry G.S. Henderson , J.C. McConnell , E.M.J. Templeton & W.F.J. Evans To cite this article: G.S. Henderson , J.C. McConnell , E.M.J. Templeton & W.F.J. Evans (1987) A numerical model for one‐dimensional simulation of stratospheric chemistry, AtmosphereOcean, 25:4, 427-459, DOI: 10.1080/07055900.1987.9649285 To link to this article: http://dx.doi.org/10.1080/07055900.1987.9649285
Published online: 15 Nov 2010.
Submit your article to this journal
Article views: 39
View related articles
Citing articles: 5 View citing articles
Full Terms & Conditions of access and use can be found at http://www.tandfonline.com/action/journalInformation?journalCode=tato20 Download by: [192.30.84.18]
Date: 25 November 2016, At: 07:21
A Numerical Model for One-Dimensional Simulation of Stratospheric Chemistry G.S. Henderson, J.C. McConnell and E.M.J. Templeton Department of Earth and Atmospheric Sciences York University, North York, Ontario M3J 1P3 and W.F.J. Evans Atmospheric Environment Service 4905 Dufferin St, Downsview, Ontario M3H 5T4
[Original manuscript received 4 September 1986; in revised form 10 August 1987]
ABSTRACT We describe a one-dimensional (1-D) numerical model developed to simulate the chemistry of minor constituents in the stratosphere. The model incorporates most of the chemical species presently found in the upper atmosphere and has been used to investigate the effect of increasing chlorofluorocarbon (CFC) emissions on ozone (O3). Our calculations confirm previous results that O3 depletions in the 20-25 km region, the region of the O3 maximum, are very sensitive to the relative abundances of Clx and NOy in the lower stratosphere for high Clx amounts. The individual abundances of lower stratospheric Clx and NOy amounts are very sensitive to upper tropospheric mixing ratios, which, in turn, are determined largely by surface input fluxes and heterogeneous loss processes. Thus the behaviour of column O3 depletions at high Clx levels is greatly affected, albeit indirectly, by tropospheric processes. For high Clx levels the Ox flux from the stratosphere to the troposphere is dramatically reduced, leading to a large reduction in tropospheric O3. Some of the variation between different published 1-D model results is most likely due to this critical dependence of O3 depletion on NOy-Clx ratios. Model simulations of time-dependent CFC effects on ozone indicate that if CFCs were to remain at constant 1980 emission rates while N2O increased at 0.25% a-1 and CH4 increased at 1% a-1, we could expect a 2.2% decrease in total column O3 (relative to the 1980 atmosphere) by the year 2000. However, if CFC emission rates were to increase by 3% a-1 (current estimates are 5-6% a-1), we would predict a depletion of 2.7% by the year 2000. The calculations for times beyond the year 2000 suggest that the effects on total O3 will begin to accelerate. If methyl chloroform emissions are added at 7% a-1 (current estimates are 7-9% a-1) to the above CFC-N2O-CH4 scenario we calculate total O3 depletions by the year 2000 that are 41% larger than those calculated without. This suggests that if the emissions of methyl chloroform continue to increase at their present rate then methyl chloroform could have a significant effect upon total O3. RÉSUMÉ On décrit un modèle à une dimension conçu pour simuler la chimie des constituents secondaires de la stratosphère. Le modèle inclut la plupart des espèces chimiques qui se
ATMOSPHERE-OCEAN 25 (4) 1987, 427-459 0705-5900/87/0000-0427$01.25/0 © Canadian Meteorological and Océanographie Society
428 / G.S. Henderson, W.F.J. Evans, J.C. McConnell and E.M.J. Templeton trouvent actuellement dans la haute atmosphère et a été utilisé pour déterminer l'effet de l'accroissement des émissions des chlorofluorocarbones (CFC) sur l'ozone (O3). Nos calculs confirment les résultats déjà obtenus voulant que les réductions de l'O3 aux alentours de 20 à 25 km, région du maximum de l'O3, soient très sensibles aux hautes concentrations relatives des Clx et NOy dans la basse stratosphère en présence de fortes concentrations de Clx. La présence des hautes concentrations des Clx et NOy dans la basse stratosphère est très sensible aux rapports de mélange de la haute troposphère, qui à leur tour sont dictés en grande partie par les flux d'apports en surface et les processus hétérogènes de perte. Par conséquent le comportement des réductions de la colonne de l'O3 en présence de hautes concentrations de Clx est grandement affecté, quoiqu'indirectement, par les processus troposphériques. Pour les fortes concentrations de Clx, le flux des Ox de la stratosphère vers la troposphère, est grandement réduit, entraînant une réduction considérable de l'O3 troposphérique. Les différences entre les résultats des modèles à une dimension sont, en toute probabilité, causées par cette dépendance critique entre la diminution de l'O3 et les rapports NOy-Clx. Les simulations du modèle des effets temporels du CFC sur l'ozone indiquent que si les niveaux des émissions du CFC demeuraient les mêmes que ceux de 1980, et que si N2O augmentait au taux de 0,25 % a-1 et si CH4 augmentait au taux de 1 % a-1, on pourrait anticiper à l'arrivée de l'année 2000, une diminution (par rapport à l'atmosphère de 1980) de 2 % dans la colonne totale de O3. Cependant si les taux d'émission du CFC augmentaient de 3 % a-1 (les estimations actuelles sont de 5 à 6 % a-1), la prévision devient alors une diminution de 2,7% vers l'arrivée de l'année 2000. Les calculs pour les années succédant l'année 2000 suggèrent que les effets sur l'O3 total s'intensifieront rapidement. Si l'on incluait les émissions du methyl de chloroforme au taux de 7 % a-1 (notons que les estimations actuelles varient entre 7 et 9 % a-1) dans le scénario du CFC-N2O-CH4 on trouve, par calcul, que la diminution de l'O3 vers l'arrivée de l'année 2000 devient 41 % supérieure à celle calculée sans son inclusion. Ceci suggère que si les émissions du methyl de chloroforme continuent à augmenter à leur taux actuel, ils pourraient avoir un effet significatif sur l'O3 total.
1 Introduction A one-dimensional chemical model has been developed to investigate the distribution of minor constituents in the 0- to 60-km height range, i.e. lower mésosphère, stratosphere and troposphere. A 1-km step size is employed over this height range. The approximations used to model heterogeneous processes in the troposphere, such as rainout, result in reduced accuracy in the simulation of tropospheric species. The model has been used extensively to study a number of problems in stratospheric chemistry over the past few years (e.g. Evans et al., 1982a, b). However, the full details of the model have not been previously published. It is our intention in the present paper to fully describe the present status of the model and to provide some results obtained during recent simulations. 2 Model description The chemical species presently included are: O( 3 P), O 2 , O 3 , O('D), N, NO, NO 2 , NO3, N 2 O 5 , HNO3, HNO4, N 2 O, H, HO 2 , H 2 O, H 2 O 2 , OH, H 2 , Cl, CIO, C1NO3, HC1, HOC1, CO, CO 2 , CH 4 , CH3C1, CH3CCI3, CFC13, CF2C12, CC14, CH 2 O, O,(O(3P) + O(XD) + O 3 + NO 2 ), NOy(N + NO + NO 2 + NO 3 + 2N 2 O 5 + HNO3 + HNO4), CU(C1 + CIO + CINO3 + HC1 + HOC1), and HO^H + OH +
A Numerical Model for i-D Simulation of Stratospheric Chemistry / 429 HO2). The model can be used to simulate global average conditions by adopting insolation conditions appropriate to 30° latitude at equinox. It can, of course, be run for other insolation conditions; recently we have used it to study the Antarctic ozone hole problem (Evans et al. 1986a, b). A finite-difference completely implicit version of the 1-D continuity equation
17
= Pi Limfi
(1)
~
is set up for each constituent, where / , is the volume mixing ratio, m is the total number density, K is the eddy diffusion coefficient, P is the production rate (molecules cm" 3 s" 1 ), L is the loss frequency (s" 1 ) and the vertical flux of the j'th species is given by 4>, = —Kmdfj/dz. We obtain N non-linear equations in N unknowns, which are solved sequentially using a tridiagonal solver. The eddy diffusion coefficient is, of course, an important parameter and at present is uncertain. Indeed it has been suggested that it may be more appropriate to use different values for different species due to the differing chemical time constants of species within air parcels (Holton, 1986). As a standard profile we adopt an expression based on a suggestion of Hunten (1975) as modified by Hudson (1977) where:
{
2 X 10 5 cm 2 s~'
axlO^m^ 3
0km < z < 10km
1
z 14 /9 43
10km O2 + O -* O2 + O('D) -> 0 + 0 -H>
-> -> -> -> -» -> -* ->
Ji
h h
OH + O H + OH H2 + 0 OH + OH OH + O NO + 0 N+ 0 NO 2 + O NO + O 2
h, J6
h J» J9 Jm Jn
-> N2 + 0('D)
Jl2
-• -> -> -> ••> ->
Jn
HO 2 + NO 2 NO 2 + N 0 3 OH + NO2 CH 3 + H H 2 C0 + 0 H + H H + CI
Jl4 Jl5
Jl6
-» co + o -> -»
Cl + O Cl + NO 3
Jn JiS
->•
C H 3 + Cl
J,9 J10 Jix
••> ••> ••> ••> -» ••> -» -» ->
H2CO + OH + C1 CO + 2HF + 2C1 CO + HF + 3C1 C 0 + 4C1 OH + Cl H2CO + OH + CO + 3C1 CH3O + OH HCO + H CO + H 2
J22
J23 J24 J2S J26 J21
J2S J29
* Dotted arrows indicate final oxidation products. t Absorption cross-sections were taken from DeMore et al. (1985).
(1985) have been taken from the sources indicated in Table 2. In a few cases the reactions have been written in a form that gives the final oxidation products. The reaction rate for the reaction H + HO2 -*• products
k9, k1Q, kn
has been taken from Sridharan et al. (1982) since their study gives the product channels and is the most recent and direct study. In addition, some reactions of importance in the mésosphère have been included for completeness. The influx of NO from the thermosphère into the upper levels of the model depends on the details of the N chemistry, some of which has not been considered in the report of DeMore et al. (1985). The reactions H + N 0 2 -»• NO + OH
fc13
H 0 2 + N -»• NO + OH
k21
and
A Numerical Model for i-D Simulation of Stratospheric Chemistry / 431 TABLE 2. Chemical reactions rates and products* included in the model Reactions 0 + O+ M -> O 2 + M O + O3 -» 2O 2 -> O 3 + M 0 + O2 + M O('D) + M -> O + M - * 2O 2 O('D) + O3 0('D) + N2 + M -> N2O + M -> OH + CH 3 O('D) + CR, • •> H2CO + 2OH -> OH + O 2 H + O3 H + HO 2 ->• 2OH -» H2O + O H + HO 2 -> H 2 + O 2 H + HO 2 -* HO 2 + M H + O2 + M H + NO 2 -> NO + OH - * HO 2 + O 2 OH + O3 OH + OH -> H2O + O OH + OH + M -» H 2 O 2 + M -» H + O 2 OH + O -> H2O + O 2 OH + HO 2 OH + H 2 -> H + H2O -»• H2O + CH 3 OH + CH4 ••> H 2 O + H 2 CO + OH OH + NO 2 + M -» HNO3 + M -> CO 2 + H OH + CO -> OH + O 2 HO2 + O HO2 + OH + M -> H2O + O 2 + M -» OH + 2O 2 HO2 + O 3 -> H 2 O 2 + O 2 HO2 + HO 2 HO2 + N - * NO + OH HO2 + NO 2 + M -» HNO4 + M -» OH + HO 2 H2O2 + 0 H2O2 + OH -» H2O + HO 2 H2O + O('D) -» 2OH N + OH -f NO + H N + O3 -* NO + O 2 -» NO + O N + O2 N + NO -» N 2 + O -* N2O + O N + NO2 N2O + O('D) -» N 2 + O 2 N2O + O('D) - * 2NO NO + O3 -»• NO 2 + O 2 -» 2NO2 NO + NO 3 NO + 0 + M -* NO 2 + M -• C H 3 + HC1 Cl + CH4 ••> HC1 + H2CO + OH Cl + HO 2 -» HCI + O2 C1 + O 3 -» C1O + O 2 -» OH + CIO Cl + HO2
Rates
References
8.0 x 10" 12 e~206aiT 2.05 x 1 0 " " e989lT 1.2 x 10"'° 1.4 x 10" 1 0 1.4 x \o-'°e-™>T 6.4 x 1 0 " " 6.6 x 10" 12 3.0 x 10" 1 2 m5/T
4.8 x 1 0 - " e~ 1.6 x 1 0 - 1 2 e - 9 4 O / r 4.2 x \Q-ne-7iiiT
2.2 x 10"" eullT 1.7 x 10"" « 4 l 6 ' r 6.1 x io->2e-2 HCl + OH -> HCl + H ->• HCl + C1NO, -» CINO3 + 0 -» -> CINO3 + OH CCU + O('D) -> CFCI3 + O('D) -» CF2CI2 + O('D) -> -> CH3CI + OH CH3CC13 + OH -> HOC1 + Cl -» HOC1 + OH -> HOC1 + 0 -» H2CO + OH -» H2CO + 0 -> CH3 + O 2 + M -> CH3O2 + NO -* CH3O + O 2 -»• CH3O2 + HO2 -» HCO + O 2 -»
HCl + HO 2 Cl + O 2 Cl + NO2 HO2 + CI HOC1 + O HOCI + O2 CINO3 + M OH + Cl CI + H2O Cl + H 2 2C1 + HNO3 O 2 + Cl + NO 2 HOC1 + NO 3 CO + 4C1 CO + HF + 3C1O CO + 2HF + 2C1O CO + HCl + H2O + OH 2CO + 2H2O + 3C1O 2C1 + OH H2O + CIO OH + CIO H2O + CO + HO 2 OH + CO + HO 2 CH 3 O 2 + M CH3O + NO2 H2CO + HO 2 CH3OOH + O 2 CO + HO 2
"Dotted arrows indicate final oxidation products. a) DeMoreetal. (1985). b) All three-body reaction rates are calculated from the generalized expression and species specific data given in JPL 85-37. c) Sridharan et al. . (1982). ivQvilvll
1 UVVO £U W VUlvUlULvU
11 KSH1
References
1.1 x 1 0 - " e~9mT
4.7 x 10"" ) times the appropriate cross-section over wavelength and solid angle ft = (0, ) z» X) =
(2)
where z is the altitude, \ is the wavelength, Q[ ,- is the cross-section for channel / of species / and x is the solar zenith angle. The wavelength range over which 7,,/ is integrated is from 1755 to 4175 Â; the
A Numerical Model for i-D Simulation of Stratospheric Chemistry / 433 solar Lyman-a line at 1216 Â is also included ( 1 Â = 10~ 10 m). Aside from Lyman-a the range is further subdivided into three regions: (a) 1755-2000Â, (b) 2000-2900À, and (c) 2900-4175 Â. In region (a) a small interval is used owing to the fine structure of the Schumann-Runge (S-R) band system as discussed later. In regions (b) and (c) the wavelength integration is performed with a 50-Â grid. For wavelengths below 2900 Â, multiple scattering is ignored and the integral of/x over dQ, reduces to Fx, the solar flux at height z. Above 2900 Â we allow for multiple Rayleigh scattering from the lower atmosphere and surface using the method of Yung (1976), which allows for the polarization of the Rayleigh scattered light. In this case the integral over dil reduces to
where T\(Z, X) = ^jQ\jN(j;z)/cos(x) is t n e slant optical depth, QKj is the total absorption cross-section of species j , and N(j; z) is the vertical column abundance of species j above z. The term e~TX in (3) allows for extinction of the direct solar beam due to O 3 , O 2 and N 2 . The term A(z, x) in equation (3) allows for Rayleigh scattering of the solar beam due to N 2 and O 2 , and for reflection off a Lambertian surface. We typically adopt wavelength independent albedos of 25% for scenario calculations but we have used values of 80% for polar modelling. To evaluate the correction, we divide the scattering medium into a number of layers of varying optical depth and single scattering albedo. We find that, because of the rapid variation of T with X. in this region, at least 10 carefully spaced layers are needed throughout the troposphere and stratosphere to give reasonably accurate results for all wavelengths >2900À. In the S-R region (1750-2000 Â), absorption is predominantly due to the narrow vibrational bands of O 2 but also includes an underlying continuum. Since this region is a region of rapidly varying cross-sections the optical depth is calculated using the parametrization of Nicolet and Peetermans (1980). They have performed detailed calculations of the transmission through the S-R band system and suggest the following parametrization as sufficiently accurate for most aeronomical calculations. The optical depth in the S-R region is given as
i>XCl,0>
,4,
\ cosx The O2 absorption cross-section in this wavelength region is calculated from
where
= a X (N(°2'
Z)
X
and a, b, c, d, crm and (TM are taken from Nicolet and Peetermans (1980) and are all a function of wavelength.
434 I G.S. Henderson, W.F.J. Evans, J.C. McConnell and E.M.J. Templeton At Lyman-a the optical depth is calculated using the absorption cross-section suggested by Nicolet (1981) where 9
Qi2i6A,o 2 =4.17xl0-' x
/MO • z)\~0083
U' \ cos x /
cm2 — s 1019 molecules cm"2
for = 1(T 20 cm2
cos x
° 2 ; z ) < 1019 molecules cm" 2 cos x Some constituents have a number of photodissociation channels (cf. Table 1). In particular, O 3 may dissociate to produce O 2 and O(3P) (subsequently referred to as 0) or O(1D), and H2O to H + OH or H2 + O. To obtain the O('D) yield for O 3 photolysis the O 3 total cross-section is multiplied by the temperature-dependent quantum yield, V(k,T) defined by JPL85-37 (DeMore et al., 1985). The quantum yields for NO2 for wavelengths greater than 3750 À are obtained from interpolation of the values given in JPL 85-37. For wavelengths outside this range the quantum yield is defined as : for
M
^ x = 1.0
\ C1NO3 + M
k6x
The reduction in NO 2 is much less than that in NOy since the enhanced photolysis (due to reduced O3) of N 2 O 5 and both the photolysis of HNO 3 and its reaction with
A Numerical Model for i-D Simulation of Stratospheric Chemistry / 445 enhanced OH (cf. Prather et al., 1984) release NO*. The destruction of O 3 via photolysis of HOC1 occurs via the following reaction scheme.
H0 2 + CIO - » HOC1 + O2 H0C1 + hv -> OH + Cl
'25
o2 + o2
OH + O3 -» HO2 + Cl + O 3
- • C1O
net result: 2O 3 - * 3O 2
(VI)
Somewhat less important is the O 3 destruction due to C1NO3 photolysis and reaction scheme (VII). C1NO3 + hv -» Cl + NO 3 CIO + NO 2 + M -* CINO3 + M NO 3 + hv -» NO + O 2
J20
k6i Ju
Cl + O 3 -* CIO + O 2
ksi
NO + O 3 -* NO 2 + O 2
kZ9
net result: 2 O 3 - * 3O 2
(VII)
The low O3 values of run S7 in the troposphere are a direct result of the decreased influx of O 3 from the stratosphere into the troposphere. As mentioned earlier, the O 3 balance in the troposphere is between influx from the stratosphere and tropospheric photochemical production and loss. For runs S5 and S7 there is little change in tropospheric chemical loss. However, the influx from the stratosphere has been dramatically reduced by 25-30% resulting in reduced tropospheric O 3 levels, as can be clearly seen in Fig. 1. We note that our model does not produce as much self-healing around 20-25 km as some of the models in the WMO report, and we have attempted to investigate this further. In tracing back the development of our model we have noticed that the effect of self-healing has been reduced in going from the JPL 83-62 reaction set to the JPL 85-37 reaction set. But a more important effect is the addition of KNiOt, which simulates average daytime N 2 O 5 abundances. Without the inclusion of this rate or a different averaging process, there would be much less daytime N 2 O 5 than that estimated from our fully diurnal model since the NO 3 required to produce the N2O5 is suppressed by photolysis. The presence of N 2 O 5 during the day, even though it is decreasing from sunrise to sunset, serves to reduce the effective amount of NO* present during the daylight hours that is available to destroy O 3 . In addition, adding the # N2Oj rate also results in an enhancement of the effective CLyNO* ratio.
446 / G.S. Henderson, W.F.J. Evans, J.C. McConnell and E.M.J. Templeton
\
/
X \ \ UJ Q
1. /
. —
—
•(
Si LOW NOy S9 LOW NOy S9 HIGH NOy
\
.
!
1 -100
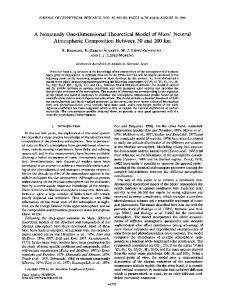
Fig. 2
-80
-60 -40 -20 PERCENTAGE CHANGE
2C
Depletion in total O 3 versus height for steady-state runs SI (1980 CFC flux) and S9 (2 x CH4) with NO, flux = 10s and 1010 molecules cm" 2 s~l, respectively.
This implies that a non-linear condition will be achieved for smaller values of Cl x . To investigate this effect we have made a few runs with the input tropospheric flux of HC1 set to zero. This change in the boundary condition reduces the lower stratospheric Cl, levels sufficiently to cause an increase in the self-healing. We have also made runs with the NOy boundary flux input as NO, which also results in an increase in the self-healing effect. Both these changes illustrate the delicate nature of the balance between NO* and Cl* levels in the lower stratosphere. d Methane The percentage O 3 depletion versus height for a doubling of CH4 abundances, run S9, is shown in Fig. 2 for both low and high NO>, boundary conditions. In both cases there is a reduction in O 3 above 40 km due to enhanced H2O levels resulting from oxidation of the additional CH 4 . The O 3 is destroyed principally via the catalytic cycle k17 and fc23 OH + O HO 2 + O
H + O2
*17
OH + O 2
with the HO 2 being regenerated via &i2. There is, however, an increase in O 3 in the 30-40km region (cf. Table 7a), due to CH4 converting reactive Cl and CIO to HC1 via reaction jfc51. Cl + CH4 - • CH3 + HC1
"51
A Numerical Model for i-D Simulation of Stratospheric Chemistry / 447 The increased methane therefore reduces the efficiency of the Cl* catalytic destruction of O 3 in the region of highest loss of 0* due to Cl* (e.g. Gidel et al., 1983). This effect is also observed when one compares runs SI and S2 (Table 7a). In the 15-30 km region there is a decrease in O 3 . This is again attributable to the oxidation of the additional CH 4 to H2O which in turn leads to larger OH and HO2 concentrations. However, in this case the destruction of O 3 occurs via ki4 and k25. The higher OH and HO 2 levels also result in increased HN0 3 and HNO4 densities with a concomitant reduction of both the NO 2 and NO densities, and the efficiency of the NO* catalytic cycle. The resulting decrease in NO* destruction of O 3 below 30 km is more than compensated by the increase in the HO* destruction. The efficiency of the Cl* cycle in this region is increased owing to the reduction in NO* and owing to the subsequent reduction of the effect of k51 CIO + NO
-H>
Cl + NO 2
k57
which serves to divert CIO destruction of O*. In addition, higher free Cl and CIO abundances result from the larger OH densities and the effects of fc63. HC1 + OH -> Cl + H2O
k63
However, the Cl* levels for this run are low so that the overall effect upon O 3 destruction is small. In the troposphere for the low boundary flux of NOj, the O 3 levels are almost unchanged. However, for the high boundary flux of NOy the O 3 levels are increased owing to smog generation of O 3 . As a result the column O 3 value increases from — 1.0 to +1.0%. The result obtained using the low NOy boundary flux with no CFCs is lower than the results given in the WMO report, which are more in accord with our results for the high NOy boundary flux. e Nitrous Oxide The results for the effects of a 20% increase in N2O (S10), shown in Table 5, Table 7a and Fig. 3, indicate a decrease in total O 3 of 0.8%, which is consistent with the WMO results (WMO, 1986). The depletion in total O 3 is a result of the increased NO generated via reaction &38. O('D) + N2O -> 2NO
k3S
Stratospheric formation of NO* from N 2 O occurs around 20-40 km, the region where catalytic destruction of O 3 by NO* is most efficient. The calculated depletion of O3 at 40km is 3% (Table 7a) while the maximum depletion of 3.8% occurs at 36km (Fig. 3). Below 20km, there is little change in O 3 for the low NOy boundary condition. For the high NO,, boundary condition O 3 is increased since tropospheric NO* levels are in the regime where increases lead to an increase in O 3 via the smog reaction scheme (I). f Chlorofluorocarbons, Methane and Nitrous Oxide The column and 40-km O 3 depletions for runs S4, S6 and S8 with emissions of CFCs, and increases in both CH4 and N 2 O are given in Tables 5 and 7a. The
448 / G.S. Henderson, W.F.J. Evans, J.C. McConnell and E.M.J. Templeton
UJ
Si LOW S10 LOW
-1 00
-80
-60
NOy NOy
-40
-20
20
PERCENTAGE CHANGE
Fig. 3 Depletion in total O 3 versus height for steady-state runs SI (1980 CFC flux) and S10 (1.2 x N2O)
percentage depletions in O 3 with height are shown in Fig. 4 and indicate the dominant effect of the Cl catalytic cycles for these C\x levels. One of the principal differences between these cases and those with just CFC emissions (cf. Fig. 1) is that there is more O 3 reduction above 45 km owing to reactions ki7 and k2% as discussed above. There is also less O3 reduction in the 35-45 km region owing to the enhanced CH4, which results in Cl being tied up as HC1. The main difference below 25 km is due to the increased generation of O 3 owing to the smog reactions in the troposphere and lower stratosphere that result from increased CO and NO* levels. Similar to runs S5 and S7, runs S6 and S8 have column depletions in total O 3 that are considerably higher than those reported in WMO (1986), and as we have noted earlier, this is related to the NOy boundary flux and CLf-NO* non-linearities discussed previously. The depletions at 40 km are similar to the values reported in the WMO document (WMO, 1986). Comparison of the column depletions for runs SI, which only includes CFCs, and S4, which includes CFCs, N2O and CH 4 , indicates that the effect of the CFCs, N2O and CH4 on O 3 depletion is not simply additive but involves a complex interaction between the different species. g Time-Dependent Runs The depletions in total O 3 calculated for the various scenarios given in Table 4 are shown in Table 6 (results obtained with a high input surface NOV flux are shown in
A Numerical Model for i-D Simulation of Stratospheric Chemistry / 449
Q
Z>
o
S 4 LOW NOy S6 LOW NOy S8 LOW NOy
- t 00
Fig. 4
-80
-60 -40 -20 PERCENTAGE CHANGE
20
Depletion in total O 3 versus height for steady-state runs with chlorofluorocarbons, methane and nitrous oxide: S4 (1980 CFC flux, 2 x CH 4 , 1.2 x N 2 O), S6 (8ppbv Cl,, 2 x CH4, 1.2 x N2O) and S8 (15ppbv Cl,, 2 x CH 4) 1.2 x N2O) with NO,, flux = 108 molecules cm" 2 s"1.
parentheses). Table 7b shows the depletions calculated at 40km for the same scenarios, while Fig. 5 illustrates the percentage column O 3 depletion with time for several of the scenarios given in Table 4. By 1980, total O 3 has decreased by 1.6 and 1.3% for the low NOy and high NOy cases, respectively. The calculated depletions in total O 3 for 1980 are typical of current models (e.g. Gidel et al., 1983; Wuebbles, 1983; Wuebbles et al., 1983). By the year 2000 our model calculates a depletion in total O 3 of 2.3% (1.8%) for scenario A, in good agreement with the results of Gidel et al. (1983) who reported a depletion of ~ 3.0% for CFC13 and CF2C12 emission sources similar to those that we have used. (As we noted earlier in the text, to facilitate comparison with the WMO report (WMO, 1986) we refer time-dependent O 3 depletions to a 1980 atmosphere with CFCs.) Wuebbles (1983) and Wuebbles et al. (1983) calculate values of 1.1% and —1.2%, respectively, by 2000 using constant 1980 CFC emissions. We obtain depletions of 4.3% (3.5%) by 2030 and 6.0% (5.0%) by 2080 for scenario A. Wuebbles et al. (1983) obtain depletions of 2.0 and 3.1% by 2030 and 2080, respectively, for the same conditions while Wuebbles (1983) obtains 2.2 and 3.5%. For scenario A! with N 2 O increasing and CFCs present at 1980 emission levels, the O3 levels at 40 km are always lower owing to the presence of the additional NO,. However, column O 3 depletions, except for a period around the year 2000, are always less owing to the impact of the Ox generating mechanism. For A 2 , the O 3 depletions at 40km are always less than for A owing to the effect of k5X. Likewise,
450 / G.S. Henderson, W.F.J. Evans, J.C. McConnell and E.M.J. Templeton
A
3
o 1
LU
a z < x o
o C\J
\
\
1
LU
O
, tropospheric mixing ratios these ratios will affect lower stratospheric NO* levels and thus, for scenarios with CFCs added, the Cl* generated exceeds NO* levels earlier than it does if a model has higher tropospheric NOj, ratios. The results will therefore reflect this difference by exhibiting non-linear effects earlier in the scenario with correspondingly larger depletions in total O 3 at any given time. Such an effect is observed for our scenario model calculations when we compare the results for input surface fluxes for NOV of 108 and 1010 molecules cm" 2 s" 1 (Table 6, Figs 5-8). The differences between the two sets of results are a consequence of the non-linearity effect occurring earlier
) 1 / y
a
•i - / '/
V
\
\
\ - \
o ""- - —._
• |
i • \i
1995 —
—
-80
-60
-40
•
T
- I 00
20
-20
!•'
',1
_
1985 2 0 00 2030 2080
- -— —
i
2030 2080
o
-100
i
-80
-60
y
1-U
—,
1
-40
-20
1
1
0
• 20
o
J :\
b
E
\
LU Q
i \
V \
•
-
O
\
1985 —
-100
—
2030 2080 -80
-60
1985 -- 2000 — — 2030 2049
i -40
PERCENTAGE
-20 CHANGE
fi0
O
20
-100
-80
-60
-40
PERCENTAGE
-20
20
CHANGE
Fig. 7 Depletion in 0 3 versus height for time-dependent runs with NO ? flux = 108 molecules cm" 2 s"': (a) A3 (constant 1980 CFC flux, l % a " ' increase in CH4, 0.25%a" 1 increase in N 2 O);(b)B, (1.5%a" 1 increase in CFCs, l%a~' increase in CH4,0.25% a" 1 increase in N 2 O);(c)C, (3% a" 1 increase in CFCs, l%a~' increase in CH4, 0.25%a"' increase in N 2 O); (d) D, (5%a~ ] increase in CFCs, l % a " ' increase in CH 4 , 0.25%a"' increase in N2O).
"
-
'
"
'
'
/
'
•'
c
1
(
1 1
1985 —
-100
-80
. -60 " -40
-20
0
20
-100
—
ÏP
2030 2080 -80
-60
-40
-20
o to
ITUDE(km) 30 45
'
/
y
' ;i
•
---^'
b
/
20
0
', 1
d
/
i ^ ~
• .
\
"- \
"\ i j) 1985 —
—
i i i i
2030 2080
o -100
-80
---— —
-60 -40 -20 PERCENTAGE CHANGE Fig. 8
20
-100
-80
-..
1985 2000 2030 2050
-60 -40 -20 PERCENTAGE CHANGE
Same notation as Fig. 7 but with NO^, flux = 1O10 molecules cm
2
s '.
\\
•
20
454 / G.S. Henderson, W.F.J. Evans, J.C. McConnell and E.M.J. Templeton
\
\
HI CD
•
\
5 5 '
\ \ \ \
LU
, fluxes. However, for high Cl^ and low input surface NOj, flux values we calculate O 3 depletions greater than many other models. This is related to the phenomenon described by Prather et al. (1984). They showed that when Cïx values in the lower stratosphere exceeded the NOy levels, the O 3 depletion increased in a non-linear fashion with increasing Cl^. This is due to partial titration of NOy into C1NO3 in the region of the O 3 peak, which allows the Cl catalytic cycle to proceed with less interference from k57. In addition, other Clx cycles also play an important role. We have noticed the above effect but have also found that it is even more sensitive to lower stratospheric NOy levels than had been previously realized. The increased sensitivity results from the low tropospheric NOy amounts that we have adopted, which impact on NOy values in the lower stratosphere. The lower stratospheric NOj, levels will not respond equally at all heights, so that a simple scaling of NOj, would produce somewhat different results. In addition, the effects of selfhealing are much less pronounced (e.g. see Fig. 3a of Prather et al., 1984). The stratosphere has an impact on the troposphere by virtue of the transport of O 3 into that region. Our results show that this stratospheric flux may be severely depleted at high CLt levels. Additionally, the above results show that the tropospheric chemistry may also have an impact upon the stratosphere and thus our results serve to emphasize that knowledge about tropospheric chemistry, and, in particular, NO* levels is critical for determining the onset of non-linear depletions in total O 3 caused by increasing Cl*. As is well known (e.g. Logan, 1983; Callis et al., 1983), generation of tropospheric O 3 by smog-type reactions is critically dependent on the tropospheric NO* levels. This will have important implications on the climate regime since an increase in tropospheric ozone will have a significant greenhouse effect (Dickinson and Cicerone, 1986). Increasing CFC emissions will have a significant influence upon the amount of total O 3 in the atmosphere, and if the emission rates continue at present levels (5-6% a ') we will see a catastrophic loss of O 3 . The point in time at which this occurs will depend upon the onset of non-linear Cl* effects upon O 3 loss and these will in turn depend on the amounts of NO y , CH4 and N2O in the atmosphere. The CH4 and N2O have a masking effect upon the total O 3 depletion but do not significantly affect the calculated depletions at 40 km. It is in the 35-45 km region that the effect of the increasing CFCs will be first observed. Our model also indicates that increasing emission rates of methyl chloroform comparable with present day estimates (7-9% a" 1 ) will have a very significant effect upon the magnitude of any calculated depletions in ozone. At present the model tropospheric chemistry is being upgraded to include a more comprehensive CH4-NO^-smog reaction scheme, as well as bromine chemistry and
A Numerical Model for i-D Simulation of Stratospheric Chemistry / 457 additional chlorine compounds OC1O, C1O2 and C12O2, which may play a role in the Antarctic O 3 problem. The model is being run for scenarios and conditions other than equinox, and for a greater variety of perturbations (Evans et al., 1986a, b; Henderson and McConnell, 1986). These results will be reported elsewhere. Acknowledgements JMcC acknowledges support from the Natural Sciences and Engineering Research Council of Canada and the Atmospheric Environment Service of Canada.
References ANDERSON, I.C. and J.S. LEVINE. 1987. Simulta-
neous field measurements of biogenic emissions of nitric oxide and nitrous oxide. J. Geophys. Res. 92: 965-976. BORTNER, M.H. and J. BAUER (Eds). 1978. De-
fense Nuclear Agency reaction rate handbook. 2nd Edit., Rev. No. 7, DNA 1948H.
ment of NO 2 , HNO 3 during a stratospheric warming at 54°N in February. Geophys. Res. Lett. 9: 493-496. ; c.T. MCELROY, J.B. KERR and J.C. MC-
CONNELL. 1982b. Simulation of October 23, 1980 STRATOPROBE flight. Geophys. Res. Lett. 9: 223-226.
CALLIS, L.B.; M. NATARAJAN and R.E. BOUGHNER.
; J.C. MCCONNELL, B.W. BOVILLE and G.S.
1983. On the relationship between the greenhouse effect, atmospheric photochemistry, and species distribution. J. Geophys. Res. 88: 1401-1426.
HENDERSON. 1986a. Chemical and dynamical effects on the Antarctic ozone anomaly. Eos, 67: 251. ; , AND . 1986b. The simulation of Antarctic ozone with chemical and dynamical effects. Geophys. Res. Lett. 13: 1323-1326. GALBALLY, I.E. 1985. The emission of nitrogen to the remote atmosphere. Background paper in: The Biogeochemical Cycling of Sulfur and Nitrogen in the Remote Atmosphere, J.N. Galloway, R.J. Charlson, M.O. Andrae and H. Rodhe (Eds), D. Reidel, Hingham, Mass.
CICERONE, R.J.; s. WALTERS and s.c. Liu. 1983.
Nonlinear response of stratospheric ozone column to chlorine injections. J. Geophys. Res. 88: 3647-3661. CRUTZEN, P.J. 1970. The influence of nitrogen oxide on the atmospheric ozone content. Q.J.R. Meteorol. Soc. 96: 320-325. . 1973. Gas phase nitrogen and methane chemistry in the atmosphere. In: Physics and Chemistry of Upper Atmospheres, B.M. McCormac (Ed.), D. Reidel, Dordrecht, Holland, pp. 99-124. . 1974. Estimates of possible variations in total ozone due to natural causes and human activities. Ambio, 3: 301-210. D E M O R E , W.B.; J.J. MARGITAN, M.J. MOLINA, R.T. WATSON, D.M. GOLDEN, R.F. HAMPSON, M.J. KURYLO, C.J. HOWARD and A.R. RAVISHANKARA.
1985. Chemical kinetics and photochemical data for use in stratospheric modeling. JPL Publ. 85-37, Jet Propulsion Lab., Pasadena, Calif. DICKINSON, R.E. and R.J. CICERONE. 1986. Future
global warming from atmospheric trace gases. Nature, 319: 109-115. EHHALT, D.H. 1974. The atmospheric cycle of methane. Tellus, 26: 58-70. EVANS, W.F.J.; J.B. KERR, C.T. McELROY, R.S.
O'BRIEN and J.c. MCCONNELL. 1982a. Measure-
GIDEL, L.T.; P.J. CRUTZEN and J. FISHMAN. 1 9 8 3 .
A two-dimensional photochemical model of the atmosphere, 1: Chlorocarbon emissions and their effect on stratospheric ozone. J. Geophys. Res. 88: 6622-6640. GRAHAM, R.A.; A.M. WINER and J.N. PITTS. 1 9 7 8 .
Pressure and temperature dependence of the unimolecular decomposition of HO2NO2. J. Chem. Phys. 68: 4505-4510. HAO, W.M.; S.C. WOFSY, M.B. MCELROY, J.M. BEER
and M.A. TOQAN. 1987. Sources of atmospheric nitrous oxide from combustion. J. Geophys. Res. 92: 3098-3104. HARRISON, H. 1970. Stratospheric ozone with added water vapor: Influence of high altitude aircraft. Science, 170: 734-736. HENDERSON, G.S. and J.C. MCCONNELL. 1 9 8 6 . O H
response to partial solar eclipse. Eos, 67: 251. HERMAN, J.R. and c.J. MCQUILLAN. 1985. Atmo-
458 / G.S. Henderson, W.F.J. Evans, J.C. McConnell and E.M.J. Templeton spheric chlorine and stratospheric ozone nonlinearities and trend detection. J. Geophys. Res. 90: 5721-5732. HOLTON, J.R. 1986. A dynamically based transport parameterization for one-dimensional photochemical models of the stratosphere. J. Geophys. Res. 91: 2681-2686. HUDSON, R.D. (Ed.). 1977. Chlorofluoromethanes and the stratosphere. NASA Rep. RP-1010, Greenbelt, Md. HUNTEN, D.M. 1975. Vertical transport in atmospheres. In: Atmospheres of Earth and the Planets, B.M. McCormac (Ed.), D. Reidel, Dordrecht, Holland, pp. 59-72. JOHNSTON, H. 1971. Reduction of stratospheric ozone by nitrogen oxide catalysts from supersonic transport exhaust. Science, 173: 517-522.
Organization for Economic Cooperation and Development, Publ. ENV/CHEM/PJC/81.93, Paris, France. PRATHER, M.J. 1981. Ozone in the upper stratosphere and mesosphere. J. Geophys. Res. 86: 5325-5338. ; M.B. MCELROY and s. WOFSY. 1984. Re-
ductions in ozone at high concentrations of stratospheric halogens. Nature, 312: 227-231. PRINN, R.G.; P.G. SIMMONDS, R.A. RASMUSSEN, R.D. ROSEN, F.N. ALYEA, C.A. CARDELINO, A.J. CRAWFORD, D.M. CUNNOLD, P.J. FRASER a n d
j.E. LOVELOCK. 1983. The Atmospheric Lifetime Experiment 1: An introduction, instrumentation, and overview. J. Geophys. Res. 88: 8353-8367. RASMUSSEN, R.A. a n d M.A.K. KHALIL. 1 9 8 1 . A t -
mospheric methane (CH4): Trends and seasonal of reactions of hydrogen atoms with HCl, Cl 2 cycles. J. Geophys. Res. 86: 9826-9832. and NOCl, and chlorine atoms with H 2 and STOLARSKi, R.s. and R.J. CICERONE. 1974. StratoNOCl. J. Chem. Soc. Faraday Trans. 2, 78: spheric chlorine: A possible sink for ozone. 1249-1259. Can. J. Chem. 52: 1610-1615. LOGAN, J.A. 1983. Nitrogen oxides in the tropoSRIDHARAN, U . C . ; L.X. QIU and F. KAUFMAN. 1 9 8 2 . sphere: Global and regional budgets. J. GeoKinetics and product channels of the reaction of phys. Res. 88: 10,785-10,807. HO2 with O and H atoms at 296K. J. Phys. Chem. 86: 4569-4574. ; M.J. PRATHER, s.c. WOFSY and M.B. MCSTROBEL, D.F.S. and M.B. MCELROY. 1970. The ELROY. 1981. Tropospheric chemistry: A global F2-layer at middle latitudes. Planet. Space Sci. perspective. J. Geophys. Res. 86: 7210-7254. 18: 1181-1202. MCCONNELL, J.c. and H. SCHIFF. 1978. Methyl chloroform: Impact on stratospheric ozone. WATSON, R.T.; M.A. GELLER, R.S. STOLARSKI a n d Science, 199: 174-177. R.F. HAMPSON. 1986. Present state of knowledge of the upper atmosphere: An assessment McFARLAND, M.; D. KLEY, J.W. DRUMMOND, A.L. SCHMELTEKOPF and R.J. WINKLER. 1979. Nitric report, processes that control ozone and other oxide measurements in the equatorial Pacific climatically important gases. NASA Ref. Publ. region. Geophys. Res. Lett. 6: 605-608. RP-1162, Washington, D.C. MOLINA, M.J. and F.S. ROWLAND. 1974. StratoWEISS, R.W. 1981. The temporal and spatial distrispheric sink for chlorofluoromethanes: Chlorine bution of tropospheric nitrous oxide. J. Geoatom catalyzed destruction of ozone. Nature, phys. Res. 86: 7185-7195. 249: 810-812. WOFSY, s.c.; M.B. MCELROY and Y.L. YUNG. 1975. NicoLET, M. 1981. The solar spectral irradiance The chemistry of atmospheric bromine. Geoand its action in atmospheric dissociation prophys. Res. Lett. 2: 215-218. cesses. Planet. Space Sci. 29: 951-974. WORLD METEOROLOGICAL ORGANIZATION (WMO). . 1984. On the photodissociation of water 1982. The stratosphere 1981. Theory and measvapour in the mesosphere. Planet. Space Sci. urements. Global Ozone Research and Monitor32: 871-880. ing Project Rep. No. 11, Geneva, Switzerland. • and s. CIESLIK. 1980. The photodissocia. 1986. Atmospheric ozone 1985, assessment of our understanding of the processes contion of nitric oxide in the mesosphere and stratotrolling its present distribution and change. Ibid. sphere. Planet. Space Sci. 28: 105-115. No. 16. and w. PEETERMANS. 1980. Atmospheric absorption in the O 2 Schumann-Runge band WUEBBLES, D.J. 1983. Chlorocarbon emission scenarios: Potential impact on stratospheric ozone. spectral range and photodissociation rates in the J. Geophys. Res. 88: 1433-1443. stratosphere and mésosphère. Planet. Space Sci. 28: 85-103. ; F.M. LUTHER and J.E. PENNER. 1983. OECD. 1980. Report on chlorofluorocarbons. Effect of coupled anthropogenic perturbations
KITA, D. and D.H. STEDMAN. 1982. Kinetic studies
A Numerical Model for i-D Simulation of Stratospheric Chemistry / 459 on stratospheric ozone. J. Geophys. Res. 88: 1444-1456. YUNG, Y.L. 1976. A numerical method for calculating the mean intensity in an inhomogeneous Rayleigh scattering atmosphere. J. Quant. Spectros. Rad. Trans. 16: 755-761.
ZIMMERMAN, P.R. ; J.P. GREENBERG, S.O. WANDIGA
and P.J. CRUTZEN. 1982. Termites: A potentially large source of atmospheric methane, carbon dioxide and molecular hydrogen. Science, 218: 563-565.