Transitional Waters Bulletin TWB, Transit. Waters Bull. 2(2007), 47-57 ISSN 1825-229X, DOI 10.1285/i1825229Xv1n2p47 http://siba2.unile.it/ese/twb
A patch use behaviour approach to model leaf litter breakdown in aquatic environment Alemanno* S., Mancinelli G., Basset A. Department of Biological and Environmental Sciences and Technologies, University of Salento, S.P. Lecce-Monteroni - 73100 Lecce, Italy. RESEARCH ARTICLE *
Corresponding author: Tel.: +39 0832 298606; Fax: +39 0832 298722; e-mail:
[email protected]
Abstract 1 - We present a mechanistic model of reed leaves decomposition in a Mediterranean coastal lagoon (Lake Alimini Grande, Puglia, Italy). Our aim is to assess the importance of the heterogeneity of leaf detritus and of the different rules of patch colonization by macroinvertebrates on reed detritus processing. 2 - To this end, we propose two versions of the model (homogeneous and heterogeneous detritus model) where the microflora is supposed to complete all the life cycle on a leaf patch, while the macroinvertebrates move towards or left the patch according to patch attractiveness. 3 - The threshold of patch attractiveness and the number of colonizers are the behavioural sources of variation in the model. The effects of the behaviour of invertebrate consumers on detritus mass loss are tested by a multi-factorial ANOVA design. A field study on reed leaf decomposition in Lake Alimini Grande is used as reference to set a number of biological parameters. 4 - Simulated leaf detritus loses weight according to a negative exponential model. The comparison between simulated and experimental data selects the heterogeneous detritus model for describing reed leaf decomposition. Behaviourally–related characteristics of invertebrate consumers also affect decomposition rates, which are directly related to invertebrate abundance and inversely to resource attractiveness threshold. The model results suggest that reed leaf decomposition in Lake Alimini Grande is probably driven by microbial activity. Keywords: decomposition, Phragmites australis, behavioural approach, patch dynamics, model simulations.
Introduction Reed stands are among the most productive ecosystems of temperate zones, but a large portion of the annual plant production is not consumed by herbivores and enters the detrital pool in the form of litter (Mann, 1988). In such aquatic ecosystems, decomposition of dead organic matter is a key process regulating the regeneration of carbon and nutrients and represents an important link between primary and secondary production in detritus-based food web (Fenchel and Jørgernsen, 1977). Litter decomposition in aquatic ecosystems is mainly a biological process involving bacteria,
© 2007 University of Salento - SIBA http://siba2.unile.it/ese
fungi, and invertebrates. On a temporal scale, it proceeds in three distinct stages: i) leaching, i.e. the rapid weight loss due to the washing out of dead leaf soluble constituents; ii) conditioning, i.e. the modification of leaf matrix by microorganisms due to enzymatic activities; iii) fragmentation, i.e. the physical break up from the coarse detritus mostly mediated by shredder feeding (Graça, 2001 and literature cited). However, these three processes are not easily separable, since one influences the others. An example of this is that fungi and bacteria convert a portion of detrital organic matter into microbial biomass transforming the detrital
TWB 2 (2007)
Alemanno et al
substrate into a more nutritious food source for detritus feeders (Bärlocher and Kendrik, 1975; Suberkropp 1992). At the same time, shredders fragmenting the detrital matrix promote microbial activity increasing the available detrital surface for colonisation (Hargrave, 1970; Howe and Suberkropp, 1994) and spreading microfungal spores (Rossi, 1985). The rate of plant litter decomposition can vary considerably depending on environmental factors such as temperature, nutrients, and oxygen, and internal factors such as leaf quality (Webster and Benfield, 1986). Among factors depending on leaf quality, the concentration of nutrients, especially nitrogen, and the content of fibre such as lignin, cellulose, and hemicellulose are the most important factors that affect breakdown rates (e.g. Valiela et al., 1979). In particular, reed (Phragmites australis) leaf detritus is predominantly composed of structural polymers that are resistant to decay (Dinka et al., 2004). Here, the relevance of leaf quality and biological agents on the decomposition of P. australis leaves in a coastal lagoon of Southern Italy has been studied through model simulations. There are many possible approaches for modelling decomposition processes. In fact, depending on the desired degree of analytical complexity, generality, and predictive power, the model can or cannot include the effect of abiotic factors, resource quality, and decomposer dynamics. Two major groups of models can be identified: models focused on transformation of detrital mass (Webster, 1983; Moran et al., 1988; Gessner et al., 1999; Asaeda et al., 2002) and models focused on decomposer population dynamics (Van Wensen et al., 1997; Hieber and Gessner, 2002; Schimel and Weintraub, 2003). Most of decomposition models do not take into account the behavioural constraints affecting the colonization of decaying detritus by benthic macroinvertebrates. Recently, a relevant role of short-term space use mechanisms that regulate the colonization of invertebrates on decaying detritus and detritus decomposition rates has been emphasised (Mancinelli et al. 2005). Detritivores are known to ignore patches until
© 2007 University of Salento - SIBA http://siba2.unile.it/ese
some threshold of resource availability is attained and to abandon them after a partial depletion of the resources (Basset 1995 and literature cited). In the present study, we designed a simple mechanistic model of leaf decomposition in aquatic systems to evaluate: 1) the influence of resource quality and 2) the importance of behavioural aspects of macroinvertebrate foraging habits in modelling decomposition processes. To this end, we designed two versions of the model; one model which considers a chemically homogeneous detrital matrix and another model where the detritus is heterogeneous, being partitioned into a labile and a refractory fraction. In both versions the behavioural components of leaf patch colonisation by macrofauna were explicitly included in order to increase the realism of the model accounting for the shortterm space use of detritivore consumers.
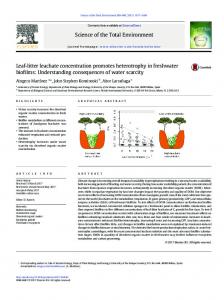
Methods Outline of the model The model simulates the transfer of dry mass through a tri-trophic food chain composed of coarse particulate organic matter (CPOM) leaf detritus, bacteria (BAC), fungi (FUN), and detritivores (DET) (Fig. 1A and 1B). Specifically, it describes the degradation process of Phragmites australis [(Cave.) Trin. ex Steud.] leaves as the result of leaching, microbial mineralization, and macroinvertebrate consumption. In what follows, the basic assumptions of this model are explained. CPOM is a non-renewable resource and it is considered to be a homogeneous matrix for the homogeneous detritus model (“HOD” model hereafter) and a heterogeneous matrix for the heterogeneous detritus model (“HED” model). In the latter model, a fast-decomposing subcompartment has been included in the CPOM pool accounting for the decomposition of the most labile particulate organic matter (LCPOM). In both models, fungi and bacteria are assumed to grow on CPOM (and L-CPOM in the “HED” model) and to derive all carbon for sustaining their growth from the leaf detritus itself. The growth of fungi and bacteria is
48
TWB 2 (2007)
A patch use behaviour approach to model leaf litter breakdown in aquatic environment
intrinsic mortality and to detritivore grazing; two different terms accounting for respiratory costs, one related to maintenance and another associated to growth, are also included.
governed by the logistic equation while the uptake, supporting standing biomass, is limited by the Michaelis–Menten equation. Mass losses from the microbial compartments are due to
number
(A)
threshold
DET out
DET in DET n
DET b
BAC cons
FUN mort
BAC ratio
FUN resp
BAC mort
BAC resp
FUN
BAC
FUN cons FUN ratio
FUN uptake
BAC growth
FUN growth
BAC uptake MASS LOSS
microflora
shredding
CPOM BAC dec
FUN dec
leaching
threshold number
DET out
DET in
(B)
DET n
fungi ratio DET b
bac ratio BAC cons
FUN mort
FUN cons
FUN resp
BAC mort
BAC resp
FUN
BAC microflora BAC growth
FUN growth
BAC uptake
FUN uptake
DET ing rate
leaching
FUN growth 2
FUN growth 1
MASS LOSS
FUN uptake 2
FUN uptake 1
BAC dec REF FUN dec CPOM LABILE LAB FUN dec
FUN dec
shredding
Figure 1.Conceptual diagram of STELLA® of the HOD Model (A) and the HED Model (B). Detritivore consumers are expected to colonize and abandon the leaf patch according to patch profitability. When the resource (fungal biomass) increases up to a threshold level the detritivores enter the patch. Conversely, under the threshold, they abandon it. The threshold level is estimated on the base of the relationship
© 2007 University of Salento - SIBA http://siba2.unile.it/ese
between fungal biomass and macroinvertebrate biomass, while the number of invertebrates is randomly selected from within a fixed range. Detritivore growth is not modelled and the individual mass of invertebrates is assumed to be constant throughout the simulations. Moreover, invertebrates consume the microflora
49
TWB 2 (2007)
Alemanno et al
together with the leaf matrix in different proportions, according to the assumption that they prefer microbial resources. The above illustrated biological processes are translated into mathematical equations while the
description of the behavioural aspects of detritivore colonization and the leaching process is carried out using logical functions (i.e., if, then, else) (Tab. 1).
Table 1. List of mathematical and logical functions used in the Models. n°
mathematical functions
(1) Coarse Particulate Organic Matter (CPOM) temporal variation : HOD model dCPOM FUN = −l ⋅ CPOM − gfun ⋅ FUN ⋅ 1 − dt FUNmax
CPOM BAC − g ⋅ BAC ⋅ 1 − − ufun ⋅ FUN ⋅ (k fun + CPOM) bac BACmax
CPOM − F ⋅ i ⋅ DETb − ubac ⋅ BAC ⋅ (k bac + CPOM) leaf det
HED model dCPOM FUN LPOM FUN = −l ⋅ CPOM − gfun ⋅ FUN ⋅ 1 − +g ⋅ FUN ⋅ 1 − − ufun ⋅ FUN ⋅ + dt (k funL + LPOM) funR FUNmaxL FUNmaxR CPOM BAC CPOM −ufun ⋅ FUN ⋅ − g ⋅ BAC ⋅ 1 − − F ⋅ i ⋅ DETb − ubac ⋅ BAC ⋅ ( k fun + CPOM) bac ( k bac + CPOM) leaf det BACmax
(2) Labile-Coarse Particulate Organic Matter (L-CPOM) temporal variation : HED model dL − CPOM FUN L − CPOM = gfun1 ⋅ FUN ⋅ 1 − − ufun1 ⋅ FUN ⋅ dt (k funL + L − CPOM) FUNmax1
(3) Fungal biomass (FUN) temporal variation: HOD model dFUN FUN CPOM FUN FUN = gfun ⋅ FUN ⋅ 1 − − r ⋅ g ⋅ FUN ⋅ 1 − ⋅ idet ⋅ DETb + ufun ⋅ FUN ⋅ − mrfun ⋅ FUN − mfun ⋅ FUN − Fmicro ⋅ dt FUN + BAC (k fun + CPOM) fun fun FUNmax FUNmax
HED model dFUN FUN LPOM FUN = gfun ⋅ FUN ⋅ 1 − + g ⋅ FUN ⋅ 1 − − ufun ⋅ FUN ⋅ + dt (k funL + LPOM) funR FUNmax FUNmaxR CPOM FUN FUN −ufun ⋅ FUN ⋅ −r ⋅g ⋅ FUN ⋅ 1 − idet ⋅ DETb − mrfun ⋅ FUN − mfun ⋅ FUN − Fmicro ⋅ FUN + BAC (k fun + CPOM) fun fun / funR FUNmax/maxR
(4) Bacterial biomass (BAC) temporal variation: dBAC BAC CPOM BAC BAC = gbac ⋅ BAC ⋅ 1 − − r ⋅ g ⋅ BAC ⋅ 1 − ⋅ idet ⋅ DETb + ubac ⋅ BAC ⋅ − mrbac ⋅ BAC − mbac ⋅ BAC − Fmicro ⋅ dt FUN + BAC (k bac + CPOM) bac bac BACmax BACmax
(5) Detritivores (DETn) numerical abundance temporal variation: dDETn = ( DETn_in ) − (DETn_out ) dt
a) DETin b) DETout
{
}
= if ( FUN > T ⋅ DETb ) then round random ( 0, N) else ( 0 )
{
}
= if ( FUN < T ⋅ DETb ) then round random (DETn ) else ( 0 )
(6) Detritivores biomass (DETb) temporal variation: dDETb = DETib ⋅ DETn dt
Calibration The model was calibrated using data from both experiments and literature. Specifically, data about leaching, invertebrate individual average mass, and initial weight for leaf packs were
© 2007 University of Salento - SIBA http://siba2.unile.it/ese
taken from a study on the decomposition of P. australis leaf detritus in Lake Alimini Grande (Apulia, Italy) (Mancinelli et al., 2005), while for the ingestion rate of detritivores, data from a laboratory experiment carried out on the two
50
TWB 2 (2007)
A patch use behaviour approach to model leaf litter breakdown in aquatic environment
estimated according to the percent of lignin content of P. australis leaves (Dinka et al., 2004). On the other hand, initial values for the microbial state variables were obtained from literature data (Findlay and Arsuffi, 1989). All parameters and initial values are shown in Tab. 2. The models were programmed using Stella 8.0® (HPS System, Inc. 2003) simulation software with runs of 8 weeks and time steps of 1 day.
marine detritivores Gammarus insensibilis and Lekanesphaera monodi was used (Manganelli and Rossi, 1996). Other parameters used in the model were taken from literature. All microbial metabolic rates were obtained by works focused on P. australis breakdown (Komínková et al., 2000; Buesing and Gessner, 2005). The saturation constants of the HED model (kbac and k funL) were assumed to be a little percent (0.1%) of the initial resource (Hieber and Gessner, 2002) while that of the HOD (kfun) was
Table 2. List of state variables (A) and parameters (B) used in the Models A) Symbols, description, units and values for the state variables Symbols
Descriptions
Units
Values
BAC CPOM L–CPOM DETb DETn FUN
Bacterial Biomass Coarse Particulate Organic Matter Labile–Coarse Particulate Organic Matter Detritivore Biomass Detritivore Number Fungal Biomass
mg dry mass mg dry mass mg dry mass mg dry mass number mg dry mass
0.025 3000 870 0.69 0 5
B) Symbols, descriptions, units and values for the parameters Symbols
Descriptions
Units
Model values
Literature values Ref.
BACmax DETib Fmicro Fleaf FUN max FUN maxR gbac gfun gfunR idet kbac kfun kfunL l mbac mfun mrbac mrfun1 rbac rfun ubac ufun
max BAC biomass Detritivores individual biomass Fraction of microflora ingested Fraction of leaf detritus ingested max fungal biomass max fungal biomass bacterial max growth rate fungal max growth rate fungal max growth rate on ref. fract. detritivores max ingestion rate CPOM half-saturation constant for BAC CPOM half-saturation constant for FUN L–CPOM half-saturation constant for FUN leaching rate bacterial mortality rate fungal mortality rate bacterial maintenance respiration rate fungal maintenance respiration rate bacterial respiration rate fungal respiration rate bacterial max uptake rate fungal max uptake rate
d–1 mg d–1 d–1 d–1 d–1 d-1 d-1 d-1 d-1 mg mg mg d-1 d-1 d-1 d-1 d-1 d-1 d-1 d-1 d-1
0.003 0.69 0.75 0.25 0.075 0.075 3 1.5 0.007 0.37 3 300 9 0.02 0.2 0.02 0.1 0.1 0.7 0.7 0.1 0.1
0.5% CPOM 0.69
5-8.5% CPOM 5-8.5% ref. fract. 3.4 2.56 0.007 0.17–0.57 0.1% CPOM 10% CPOM 0.1% LPOM 8% CPOM 0.24-0.72 0.15 0.15 0.7 0.39-0.88 0.15 0.15
1 9 10 10 1 1 2 3 1 4 5 8 5 9 6 11 7 7 1 1 7 7
1) Kominkova, 2000; 2) Buesing, 2006; 3) Van Wensen, 1997; 4) Manganelli, 1996; 5) Hieber, 2002; 6) Servais, 1985; 7) Moran, 1989; 8) Dinka, 2004; 9) Field experiment; 10) Estimated from various literature data 11) Estimated on the basis of bacterial mortality rates.
© 2007 University of Salento - SIBA http://siba2.unile.it/ese
51
TWB 2 (2007)
Alemanno et al
Factorial design A factorial design was developed in order to select the best agreement between observed and simulated data and to evaluate the influence of different rules of patch colonization and of the chemical quality of detrital matrix on decomposition rates. Specifically, we investigated the effects of the number of invertebrates entering the leaf patch, the threshold level of patch attractiveness (defined as “Number” and “Threshold”, respectively), and the quality of leaf detritus resource (“Resource”). Three level were chosen for “Number” (10, 30 and 50) and “Threshold” (1, 5 and 20), and two for “Resource” (HED and HOD). The “Number” and “Threshold” values were chosen according to various literature data and simulation results. Then, parallelism tests based on ordinary least square correlative analyses between observed and simulated mass loss were carried out in order to select the best agreement between observed and simulated data. Finally, two- and Three-Way ANOVAs were performed to test the effects of the different levels of both “Threshold” and “Number” factors on decomposition rates. Field experiment The study was undertaken in Lake Alimini Grande, a coastal brackish lagoon located in Puglia (South-East Italy) in the Adriatic Sea. The lagoon is 3.03 km long and has a maximum width of 1.34 km. The maximum depth is 3.5 m, and the water surface is ~1.26 km2 , depending on tidal cycles and freshwater inflows (see Mancinelli et al. 2005 for further information on the study site). An experimental site was located on the western coast of the lagoon, close to a reed stand. Senescing leaves of Phragmites australis were collected from Lake Alimini Grande reed stands and air dried. Aliquots of leaf fragments were weighed to the nearest mg after drying at 60°C for at least 72 h (‘leaf packs’: 3.000 ± 0.001 g dry mass) and enclosed in ballasted net bags (0.5 cm mesh size) to facilitate their manipulation and retrieval. A total of 164 leaf packs were placed at each experimental site on October 17th, 1998. 4 leaf packs per site were immediately used for
© 2007 University of Salento - SIBA http://siba2.unile.it/ese
determinations of the initial mass at t = 0. Subsequently, 4 leaf packs per site were collected after 4 days from the start of the experiment; pack collection was carried out daily for the following 39 days. In the field, leaf packs were singularly enclosed underwater in plastic bags and transferred at 4°C to the laboratory, where they were washed with tap water to remove invertebrates. Leaf fragments were subsequently dried and weighed according to the aforementioned procedures. Invertebrates were recognized and enumerated. Their individual dry mass was determined after drying at 60°C for at least 72 h. Nonlinear regressions were carried out to calculate the decay rate coefficient of reed leaf detritus according to a single negative exponential model mt = m0 *e -kt (Olson, 1963) where m0 is the initial dry mass, mt is the leaf pack dry mass at time t (both expressed in mg) and k is the decomposition constant.
Results and Discussions Reed leaf pack in Lake Alimini Grande lost mass according to a negative exponential model (r = 0.9181, d.f.= 42, P