A Pattern Matching System for Linking TCAD and EDA Frank E. Gennari and Andrew R. Neureuther University of California, Berkeley
[email protected] Abstract A software system has been written that analyzes a mask layout and searches for locations sensitive to residual processing effects. Pattern matching is used to determine where the layout geometry most closely resembles a problematic shape. The system was designed to quickly provide feedback to the designer as to which areas in the mask must be altered. The goal is to find and rank order the locations of the worst-case effects in a full chip layout within an hour. A number of different algorithms have been developed based on converting the layout from polygons to a bitmap, edges, or rectangles and triangles. Higher-order primitives such as rectangles require that the pattern be pre-integrated in one or two dimensions. Results employing the rectangle and triangle algorithm show that all edges on a mask layer of several square centimeters can be processed in less than an hour.
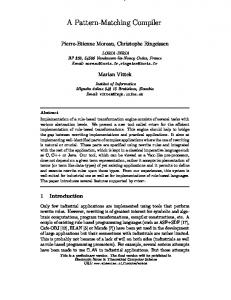
involving complex floating-point number weights. In the case of lens aberrations, the match shape is the inverse Fourier transform (IFT) of the optical path difference function. This gives a circular bitmap match pattern of complex numbers where the magnitudes of the pixel contributions fall off with radius. A typical 128 by 128 pixel pattern yields reasonable speed vs. accuracy and is scaled to represent a radius of several wavelengths. Other applications of pattern matching include analyzing effects due to misalignment, defects, reflective notching, laser-assisted thermal processing, ChemicalMechanical Polishing (CMP) dishing, and flare. Some of the possible match pattern functions are given in Figure 1. Applications of pattern matching are described in more detail in [1]. For example, the match pattern used to find locations sensitive to laser-assisted thermal processing is a negative 1/R2 function, and the patterns associated with defects and misalignment are Gaussian.
1. Introduction As the critical dimension in optical lithography continues to shrink and additional phases are added to masks, it is becoming more important to determine where the layout is affected the most by non-ideal process conditions. If the most problematic shapes can be identified and represented in an unambiguous form, then these test patterns can be used to locate areas in any layout that are the most sensitive to these process effects. After the ‘hot spots’ have been found, the designer can use these results to go back and alter the geometry to reduce the sensitivity to these effects. This procedure will reduce the effects of imperfect optics on the printing of the image from the mask to the wafer, improving the yield of the design. Alternatively, these locations can be recorded and later examined after fabrication as a method of narrowing down mask inspection regions. Locations of interest can be filtered to include only points along edges, line ends, inside corners, and/or outside corners. The general pattern matching method presented here can be used to search for matches between any userdefined bitmap image and any set of input polygons
0-7695-2093-6/04 $20.00 2004 IEEE
Figure 1: Pattern matcher test patterns for various applications.
2. Software system A 2D pattern-matching algorithm has been developed to scan over the layout and compute, for each point of interest, the correlation of the actual local layout geometry to the shape of the test pattern(s). The goal of the software is to find and rank order the locations of the worst-case effects in a full chip layout based on the highest match factors. A block diagram of the pattern
matcher is shown in Figure 2. The pattern generator reads a set of Zernike polynomials representing an aberrated pupil function, or any other user-defined equation, in order to generate the pattern bitmap of complex numbers. The main pattern matcher executable then reads the pattern, a user input parameter file, and a (possibly multilayer) mask layout in CIF, GDSII, or custom pattern matcher format. The pattern matcher is capable of reading GDSII and CIF layouts directly, storing them in compact hierarchical form for efficient access to geometry. The pattern matcher is run, and a resulting sorted table of the highest match factors and their locations for each pattern is output as well as JPEG images of the patterns over the match locations. An arbitrary number of patterns can be used in one matching run and several layouts can be combined and run together. ,
, # $ %
&
'
!
! "
( .
(
"
!
*+!
together spatially into sub-regions of a partition for fast access to local collections of shapes. The third step is the matching loop itself, where all of the runtime is usually spent. The number of X,Y points tested depends on whether the user is searching all or part of the layout and if the match locations are specified to be corners, edges, line ends, or all points on a layout grid (typically 1/6 to 1/10 a feature size). Even if the points are constrained to lie on the edges of features, the number of test locations can be in the billions for a layout of several square centimeters. Therefore, it is critical to minimize the time taken to compute the match factor at a point. The time per point is equal to (1) the number of geometric primitives that overlap the pattern at that point times (2) the time taken to add the contribution of a primitive to the accumulated match factor. Example numbers and times of primitives for a typical layout and 128x128 pattern are shown in Table 1. Edge/rectangle strip primitives are much more efficient than pixel primitives, and rectangle/triangle primitives are even better. The improved efficiency of using edges and rectangles comes at a cost of increased algorithm complexity and more special cases.
!
Primitive % )
" %
Figure 2: Pattern matcher block diagram.
In addition to the main matching programs, the system includes a tool for flattening and converting CIF and GDSII layouts into the internal layout format of the pattern matcher. The pattern matching software also provides a graphical interface for the user to view the layout with the highest scoring match locations highlighted. This software is available in several forms: a UNIX version integrated with the Cadence DF II CAD tool, a standalone MS Windows PC version with OpenGL GUI support, and several versions of a public web interface to the system. This web version allows remote users to input their layouts and aberrations into the system and take advantage of the full power of the tool.
3. Algorithms The matching algorithm itself has three main steps. First, the input shapes are split into geometric primitives depending on the matching algorithm. Next, the primitives are spatially subdivided and sorted to permit efficient access to local areas of data. This includes partitioning the layout into smaller overlapping areas and locally flattening any hierarchy. The primitives are sorted by Y-value and then by X-value, and may be grouped
0-7695-2093-6/04 $20.00 2004 IEEE
Avg. # in 128 x 128 pattern 16384 600
Cost/ primitive 1 2
Total cost
Pixel 16384 Edge/Rect 1200 Strip Rectangle 20 4 80 Triangle 5 4-12 (5) 20-60 (25) Table 1: Comparison of geometric primitives. Each of the pattern matching algorithms relies on the fact that the match factor is a linear sum of contributions from the weights of each of the primitives overlapping the pattern. The contribution of each primitive is independent of the others and can be added in any order. Several other classifications of algorithms can be used for pattern matching, such as Fourier Transform-based methods, but they typically do not take advantage of the large groups of similar layout pixels, small number of unique layout pixel values, and limited set of filtered query points, and are thus typically less efficient.
3.1. Polygon Splitting Complex input layout shapes are difficult to store, access, and process quickly inside of the matching loop, and for this reason they are split into simpler elements as a preprocessing step. The input polygons are split into geometric primitives, which consist of pixels, edges, rectangles, and triangles depending on the matching method used. The overall goal of the polygon splitting algorithm is to produce a minimal, non-overlapping set of
smaller primitives that together cover the entire area inside the polygon and none of the area outside the polygon. Most of the polygons found in an integrated circuit mask layout are Manhattan, consisting of alternating horizontal and vertical line segments with no diagonal edges. These polygons are first split into rectangles that are snapped to the layout grid. Each grid element that lies inside the polygon is extracted as a rectangle, and then merged with rectangles to the right and above to produce a small number of maximally expanded rectangles. If the bitmap algorithm is to be used, then the layer weight of each of the rectangles is added to the layout bitmap matrix through a scan conversion process. Alternatively, if the edge intersection algorithm is used, then the rectangles are split into horizontal strips one pixel wide that lie between two opposite edges of each rectangle. Polygons with diagonal lines pose a problem since they cannot be split directly into rectangles aligned with the X- and Y-axes. A simple solution would be to convert the diagonal edges into stair-step sequences of horizontal and vertical line segments discretized on the layout grid such as in scan conversion, resulting in a Manhattan polygon that can be split into a number of rectangles. A better method is to split the polygon into a small set of right triangles as well as rectangles. The number of resulting primitives is usually much lower that when splitting into only rectangles due to the large number of rectangles required to accurately approximate a diagonal edge.
3.2. Bitmap Algorithm The bitmap algorithm is the simplest method for computing a match factor at each point, but it is also the slowest. In order to execute the inner matching loop, each input shape must be converted into a large bitmap, specifically a matrix of complex numbers representing the magnitude (transmittance) and phase of mask openings. The match factor at a location is computed by iterating over every pixel inside the boundary of the pattern positioned at that location. Each complex number pixel in the layout is multiplied by the corresponding complex number pixel in the pattern, and every pixel’s contribution is summed over the entire area. Assume each complex number in the layout and pattern is purely real. If the layout pixel and pattern pixel have the same sign, then they match and a value equal to the product of the magnitudes (importance) of those pixels is added to the match factor, increasing the correlation. If the signs differ, then the match factor is similarly decreased. Therefore, the closer a collection of layout shapes at the match location resembles the pattern shape, the higher its match factor will be.
0-7695-2093-6/04 $20.00 2004 IEEE
3.3. Pre-Integration The trick to speeding up the match factor computation is to avoid touching each of the many pixels in the pattern. Since the sum of pattern pixel values overlapping a polygon is required for the match factor, and iterating through each pixel is not desired, the pattern values must be rearranged so that the sum of a large number of pixels can be determined with only a few operations. In the extreme example where the pattern is entirely covered by a shape, every pixel value in the pattern must be added up to determine the sum of pixels under the shape. Obviously, it is much better to sum up the pixels only once and then use that single number every time this situation occurs. Similarly, the sum of the right half of the pattern can be precomputed, stored, and used any time a shape overlaps exactly the right half of the pattern. It may appear that there are an enormous number of pixel group combinations that must be stored in order to make this algorithm work. However, what happens when a shape overlaps exactly the left half of the pattern? The sum of the pixels overlapping this area can be precomputed and stored, or it can be calculated by subtracting the sum of pixel values in the right side of the pattern from the total sum of pixels in the entire pattern. In this way a series of additions and subtractions of a small number of carefully chosen pixel blocks will yield the area covered by an enormous number of actual pixel blocks. This is the basis of an algorithm that preintegrates the pattern in various directions and allows a series of differences of pre-integrated table lookups to determine the sum of pixel values under a shape of arbitrary size and position. In order to implement this idea and efficiently add contributions from edge/rectangle strips to the match factor, the pattern can be pre-integrated horizontally in 1D. Each pre-integrated matrix element is equal to the sum of all pattern values at that location and to the right. Then, if a rectangle strip spans from location (X1,Y) to (X2,Y), instead of summing each pattern pixel from X1 to X2 along row Y, the same number can be obtained by the taking the difference of the pre-integration matrix at X1,Y and X2,Y. The number of operations is reduced from (X2-X1) to 2. This is used in the edge algorithm of section 3.4. This idea can be extended to pre-integration in 2D so that rectangular blocks of pixel values are stored instead of only 1D strips, as in the rectangle algorithm described in section 3.5. A 2D matrix pre-integrated to the right and above is obtained by taking the 1D pre-integration matrix and performing 1D pre-integration in the Y-direction. Each new matrix element represents the sum of pattern values at that location and in the region above and to the right of that location.
3.4. Edge Intersection Algorithm A useful observation can be made about the layout pixel values. Since the layout consists of only a few unique layers, for instance 0- and 180-degree phase mask regions, the layout pixels take on a discrete number of values. Moreover, these values appear together in large blocks of pixels because the grid resolution is usually much smaller than a feature size. This is especially true for large rectangle fills. Similarly, large areas of zero pixels, which denote the absence of a layer, are also common and can be skipped completely. The 1D pre-integration matrix can be used to compute the sum of pattern values under a rectangle strip (between two edges at a particular Y value) in two operations instead of N. The contribution of the entire rectangle to the match factor is thus the sum of the contributions in each row Y contained in the rectangle.
3.5. Rectangle Algorithm The edge intersection algorithm can be taken a step further for even more efficient addition of rectangle contributions to the match factor. If the pattern can be pre-integrated in 1D to allow 1D rectangle strips to be added efficiently, then the pattern can be pre-integrated again in an orthogonal direction to allow an entire 2D rectangle to be added even more efficiently. Assume the rectangle extends from lower left corner X,Y to upper right corner X+N,Y+M. The sum of pattern pixel values under the rectangle can be computed starting with the sum of all pattern pixels above and to the right of the lower left corner of the rectangle. This may overestimate the size of the rectangle. The problem is corrected by subtracting off the sum of pattern pixels above and to the right of the upper left corner, and subtracting the sum of pattern pixels above and to the right of the lower right corner. Since some area has been subtracted twice, it must be corrected by adding the sum of pattern pixels above and to the right of the upper right corner of the rectangle. In summary, the sum of pattern pixel values under the rectangle is equal to P0[X,Y] – P0[X,Y+M] – P0[X+N,Y] + P0[X+N,Y+M], where P0 is the 2D pre-integration matrix. This number is multiplied by the rectangle’s layer weight to get the contribution of the entire rectangle to the match factor. This takes only four operations as opposed to N*M, assuming the rectangles have been spatially sorted so that it is easy to determine which overlap the pattern at a given location. The rectangle algorithm is by far the fastest and most efficient of the three. It is similar to the geometry processing algorithms used in OPC tools. Similar algorithms are used for OPC calculations, such as the polygon convolution algorithm of Cobb [2], which
0-7695-2093-6/04 $20.00 2004 IEEE
relies on lookup tables to store the linear intensity contributions from each polygon edge.
3.6. Triangle Algorithm Some input layouts contain diagonal edges, usually with angles at multiples of 45 degrees where the technology allows. For example, permitting poly lines to jog diagonally around contacts can lead to denser layout structures. These non-Manhattan polygons must be split into a very large number of rectangles to accurately approximate the sloped edges. In many cases, right triangles can be used to replace these large collections of tiny rectangles in efficiently representing a diagonal polygon edge. The number of primitives will often be reduced to a fraction of the size of the required rectangle set. However convenient this may seem, it comes at a price: triangles are much more complex to process and involve the computation and storage of a large number of pre-integration matrices. Refer to Figure 3 for a graphical description of the triangle algorithm. "2
4"
" "33
52
3 /
" "66
6
2 "3 12
13
" "44
0
3 2
4
"2
7
"2 3 6 "4 "6
7& 1 282'9 7& 1 283'9 "2& 1 283':"2& 1 382'
Figure 3: Triangle Algorithm.
In the case of 45-degree triangles, eight 2D preintegration matrices are used, four for each quadrant and four for each of the lower octants. These matrices are precomputed for 90- and 45-degree angular regions beginning at a point in the pattern and continuing to the edges of the pattern matrix. Pixels that lie exactly on a diagonal edge can be fully counted, not counted at all, or counted as one half their actual pattern value for highest accuracy. There are four possible right triangle orientations corresponding to four unique positions of the right angle. The remainder of this section will assume the triangle is oriented with its right angle in the lower left corner and its hypotenuse oriented from the upper left to the lower right. Two 2D pre-integration matrices are required for this case. Matrix P0 represents the sum of pattern pixel values above and to the right. Matrix O1 represents the sum of pixel values in the octant between 315 and 360 degrees.
First, the P0 pre-integration matrix is used to retrieve the sum of pattern pixel values above and to the right of the triangle’s right angle point at X1,Y1. Then P0 at the top left corner (X1,Y2) of the triangle is subtracted, leaving an area of pattern pixel values that extends from the left vertical leg of the triangle to the right side of the pattern area and includes the entire triangle. Next, the value of O1 of the top left (X1,Y2) triangle point is subtracted to remove the pattern pixel values to the right of the triangle’s diagonal edge. This operation subtracts a 45-degree angular slice of the pattern between 315 and 360 degrees. If this area extends beyond the bottom of the triangle, the extra area must be added back in and is equal to the value of O1 at the lower right (X2,Y1) corner of the triangle. Thus four operations are involved: P0(X1,Y1) – P0(X1,Y2) - O1(X1,Y2) + O1(X2,Y1). A triangle may need to be split if it only partially overlaps the pattern, and the memory lookup is in a large matrix. In addition, contributions from triangles that are not multiples of 45 degrees must be added using a variant of the edge algorithm. Thus processing is somewhat slow.
section of FPGA interconnect that was artificially modified to create a phase-shift mask. The blue layout area represents 0-degree phase, red represents 180-degree phase, and black is chrome. Green in the pattern matches with 0 phase (blue layout) and red matches with 180 phase (red layout). A close-up of one of the trifoil match locations with match factor of 0.169 is shown. Coma match factors are as high as 0.34. 0
3.7. Clipping One problem with the matching algorithms as presented so far occurs when the primitive shape only partially overlaps the pattern area. If the shape extends beyond the pattern area, then lookups in the preintegration tables outside of the computed region will fail. This means that the shapes must be clipped to the pattern area before the table lookups are performed. In the case of edges and rectangles, these primitives are easily clipped to the bounding box of the pattern using min() and max() to yield a primitive of the same type. However, additional difficulties arise when clipping a triangle to a rectangular area. In some cases the intersection of the two shapes is no longer a triangle. This shape must be further split on the fly into smaller shapes consisting of a possible smaller triangle of the same orientation and up to two new rectangles. There are a number of cases to consider when splitting the polygon resulting from clipping, but fortunately these cases can be enumerated efficiently without having to resort to the slow arbitrary non-Manhattan polygon splitting algorithm. The contribution from each of the resulting primitives is then added to the match factor in the usual way for rectangles and triangles. The worst-case number of operations required to add the contribution of a 45-degree right triangle to the match factor is therefore actually 12, since each of up to three shapes requires four operations.
4. Results Figure 4 is an example pattern-matching run of the trifoil and coma aberration patterns on a 140x170 m
0-7695-2093-6/04 $20.00 2004 IEEE
Figure 4: Trifoil and coma patterns matched on 0/180 FPGA layout.
Shown in Figure 5 is the geometry that is sensitive to the coma aberration in a two-layer mask designed in a 0.5 m technology. This layout includes 45-degree lines, demonstrating how the pattern matcher can handle nonManhattan geometry through triangle extraction. Any number of patterns can be processed in one matching run and either the top N matches or all matches above a user threshold are reported. The PC version of the software uses OpenGL graphics to provide the user with an interactive view of the layout with zoom, pan, show/hide layers, measurement tools, and screen captures of images such as those in Figures 4 and 5. Pattern-matching accuracy has been verified against aerial image intensity simulations obtained from the UC Berkeley SPLAT simulator. Figure 6 is an initial plot of simulated intensity change vs. normalized match factor as calculated by the pattern-matching software. Odd aberrations show an approximately linear relationship between predicted and actual intensity changes, while even aberrations show little simulated intensity change due to the electric fields of the intensity spillover adding in time-phase quadrature. The reasons for deviation from a linear relationship are currently being investigated, and may be due to small integration errors in the SPLAT simulator. Additional pattern matching verification results can be found in [3].
Figure 5: Coma pattern match on two-layer mask layout with 45-degree edges.
eleven levels of hierarchy, and 35.3 million rectangles if flattened. The coma test pattern was a 128x128 bitmap with pixel size of 100nm, and the layout contained 2.6 billion potential edge match points, though only about 20% of these points were tested due to filtering by an internal adaptive coherency/match factor prediction algorithm. The pattern matching software took 42 minutes of runtime and 140MB of memory to read the layout, compute the top 1000 match locations, and display the results. Several of the layouts that contained 45-degree diagonal edges were observed to have a large runtime when the polygons were split into rectangles only. The addition of triangles to the data structure allowed the same geometry to be represented with equivalent or even greater accuracy using a much smaller number of primitives. Thus the rectangle/triangle algorithm showed a factor of 2-3.5 improvement in runtime over the rectangle only algorithm.
6. Conclusions
Intensity Change vs . M atch Factor 0.3
0.25
abs(di)
0.2
"
Coma(co s) Coma(sin)
0.15
Sp herica l HO Co ma(co s)
0.1
0.05
+ 0 0
0.1
0.2
0.3
0 .4
0 .5
0 .6
0.7
ab s(M F)
Figure 6: Simulated intensity change vs. match factor prediction for various aberration patterns and layouts.
5. Performance The rectangle-based matching algorithm was tested on a number of large layouts in various technologies with one or more layers. These layouts were examined for sensitivity to the coma lens aberration and others. In all cases, the actual match time was proportional to the number of rectangles in the flattened layout (though it was not actually flattened) times the layout density. The density increased with the number of overlapping layers, but in actual mask layouts each layer would represent a different phase and thus would not overlap. Therefore, one layer is sufficient to demonstrate the matching performance. In the timing tests, an older 1GHz Pentium III computer with 512MB of RAM was used. The largest test layout consisted of the 234MB GDSII file of the active area mask layout of a microprocessor with area 417mm2,
0-7695-2093-6/04 $20.00 2004 IEEE
The pattern matching software tool described above is capable of identifying areas in a mask layout where process effects can lead to problems in the printed shapes. The main executable together with the supporting conversion tools provide the designer with a graphical interface to run the software with any pattern image, any type of layout, and with user-defined input parameters, all on a standard desktop PC. The innovative new rectangle and triangle algorithms allow the pattern matcher to run at speeds greater than that of OPC. A designer can run the pattern matcher on the raw GDSII file of a layer of an entire microprocessor layout while eating lunch and return to find a list of many thousands of geometries sensitive to the process effects of interest. This system is a fast, inexpensive alternative to the iterative mask design process that can hopefully be applied to many areas of design for manufacturability and perhaps even other complex optical systems.
References [1] A. Neureuther, F. Gennari, “No-Fault Assurance: Linking Fast Process CAD and EDA,” SPIE Vol. 4889, 10/02. [2] Nick Cobb, “Fast Optical and Process Proximity Correction Algorithms for Integrated Circuit Manufacturing,” PhD Thesis, University of California, Berkeley, 1998, pp. 38-45.
[3] F. Gennari, G. Robins, and A. Neureuther, “Validation of the Aberration Pattern-Matching OPC Process,” SPIE Vol. 4692B, 3/02.