www.nature.com/scientificreports
OPEN
received: 19 June 2015 accepted: 25 August 2015 Published: 23 September 2015
A peptide identification-free, genome sequence-independent shotgun proteomics workflow for strain-level bacterial differentiation Wenguang Shao1,*, Min Zhang2,*, Henry Lam1,3 & Stanley C. K. Lau2,4 Shotgun proteomics is an emerging tool for bacterial identification and differentiation. However, the identification of the mass spectra of peptides to genome-derived peptide sequences remains a key issue that limits the use of shotgun proteomics to bacteria with genome sequences available. In this proof-of-concept study, we report a novel bacterial fingerprinting method that enjoys the resolving power and accuracy of mass spectrometry without the burden of peptide identification (i.e. genome sequence-independent). This method uses a similarity-clustering algorithm to search for mass spectra that are derived from the same peptide and merge them into a unique consensus spectrum as the basis to generate proteomic fingerprints of bacterial isolates. In comparison to a traditional peptide identification-based shotgun proteomics workflow and a PCR-based DNA fingerprinting method targeting the repetitive extragenic palindromes elements in bacterial genomes, the novel method generated fingerprints that were richer in information and more discriminative in differentiating E. coli isolates by their animal sources. The novel method is readily deployable to any cultivable bacteria, and may be used for several fields of study such as environmental microbiology, applied microbiology, and clinical microbiology.
Sensitive and accurate differentiation of bacteria is important not only to microbiology but also many disciplines of basic and applied sciences. DNA fingerprinting has been one of the most commonly used strategies, as it offers a good balance between detection performance and operational convenience1. In recent years, proteomic fingerprinting using mass spectrometry (MS) has emerged as a robust alternative2. By taking a snapshot of the system-wide expression profile under specific growth conditions, proteomic fingerprinting may reveal subtle differences between closely related bacterial strains that cannot be resolved by using DNA fingerprinting2. Proteomic fingerprints can be generated using MS analysis of intact proteins (top-down) or digested peptides (bottom-up). Matrix-assisted laser desorption ionization (MALDI) time-of-flight (TOF) MS is a top-down technique widely used for rapid identification of clinically relevant bacteria at the genus and species levels3,4. Bacteria are identified through the matching of their MS profiles to those of previously characterized strains without involving protein identification. MALDI-TOF-MS is relatively high in throughput and easy to perform, requiring only the mixing and air-drying of intact cells in a matrix prior to MS analysis. However, its MS profile quality, mass accuracy, data richness, and reproducibility
1
Division of Biomedical Engineering, The Hong Kong University of Science and Technology, Clear Water Bay, Hong Kong. 2Division of Environment, The Hong Kong University of Science and Technology, Clear Water Bay, Hong Kong. 3Department of Chemical and Biomolecular Engineering, The Hong Kong University of Science and Technology, Clear Water Bay, Hong Kong. 4Division of Life Science, The Hong Kong University of Science and Technology, Clear Water Bay, Hong Kong. *These authors contributed equally to this work. Correspondence and requests for materials should be addressed to H.L. (email:
[email protected]) or S.L. (email:
[email protected]) Scientific Reports | 5:14337 | DOI: 10.1038/srep14337
1
www.nature.com/scientificreports/ # of isolates
# of samples
Collected
Tested
Source
Collection site (all in Hong Kong)
Sewage
Soil pipe, Hong Kong University of Science & Technology
2
20
20
Cow
Country park, Sai Kung
6
20
20
Dog
Pet shop, Tuen Mun
4
20
19
Pig
Farm, Yuen Long
4
20
14
Total
73
Table 1. Fecal sources of E. coli isolates used in this study. Each sewage sample was collected on a different day, and each fecal sample was collected from a different individual. Originally, 20 isolates were collected from the samples of each source. But some isolates of the dogs’ and pigs’ samples lost their viability in the frozen stock. Therefore, fewer isolates were tested for those two sources.
have yet to be improved so as to deliver the resolution and discriminative power required for consistent bacterial differentiation at the strain level4. Contrarily, shotgun proteomics is a bottom-up technique that involves tryptic digestion of the total proteins extracted from cell lysate, followed by liquid chromatography (LC) coupled with tandem mass (MS/MS) spectrometry analysis of the peptide mixture5,6. Bacterial differentiation and identification typically involve the assignment of MS/MS spectra to peptide sequences that are in silico digested from protein sequences translated from publicly available bacterial genome sequences7,8. This technique has been used successfully in differentiating closely-related strains of Helicobacter pylori as well as pathogenic strains of E. coli and Yersinia pestis from non-pathogenic ones2,9. LC-MS/MS offers high detection sensitivity and high dynamic range, resolving thousands of peptide species that vary widely in abundance within a sample10. However, the unambiguous assignment of MS/ MS spectra to peptides ultimately depends on the availability of genome sequences of the bacteria concerned11,12. The term proteogenomics inscribes the strong links between genome sequence data and protein/peptide identification13. Although the number of genome sequences available in the public domains has been increasing at unprecedented rates, there remain many bacterial species yet to be sequenced. For species that have been sequenced, a species is often represented by the genome sequence(s) of only one or a few representative strains. This may undermine the vast gene pool that is present in the pangenome of a bacterial species14 and may limit the resolving power of shotgun proteomics for strain-level differentiation and identification. Recently, a novel peptide identification-free, and thus genome sequence-independent, shotgun proteomic workflow has been developed15. This workflow uses a similarity-clustering algorithm to group MS/MS spectra that are likely derived from the same peptide ion and subsequently merge them into a unique consensus spectrum as the basis to generate proteomic fingerprints. The workflow has been used successfully in fingerprinting the remnant blood meals in the blacklegged tick (Ixodes scapularis), and tracing the blood meal to the vertebrate host that a tick had last fed on. In this study, we tested this peptide identification-free proteomics workflow as a novel fingerprinting method for bacterial differentiation and identification (referred to as UNID-proteomic fingerprinting hereafter). The test model was comprised of E. coli isolates pertaining to four species of animal hosts of contrasting diet and habitat. E. coli is prevalent in the enteric environments of mammalian hosts. Nonetheless, each animal species features a unique combination of diet, gut anatomy, physiology, and behavior that shape the conditions of its enteric environment, which in turn, enriches for a different diversity of E. coli populations16. The tracing of E. coli isolates to animal sources has important implications to epidemiology and the control of food and water hygiene17. We evaluated the accuracy and sensitivity of UNID-proteomic fingerprinting in differentiating and identifying the animal sources of the E. coli isolates in reference to those of a conventional proteomic workflow that involved peptide identification18 (ID-proteomic fingerprinting hereafter) and a typical PCR-based DNA fingerprinting method that targeted the repetitive extragenic palindromes (REP) elements in bacterial genomes19,20. The procedures, working principal, performance, advantages, limitations, and potential application of UNID-proteomic fingerprinting are discussed below.
Methods
E. coli isolates. Eighty E. coli isolates were obtained from four sources (raw sewage, and the freshly
voided feces of feral cows, pet dogs and farm pigs) (Table 1). Sewage was collected from the soil pipe of a pet-free university dormitory and hence assumed to be from humans exclusively. The isolation was performed using CHROMagar ECC, which is designed to suppress the growth of Gram-positive bacteria, and to differentiate E. coli from other Gram-negative bacteria by the formation of blue colonies as a result of β -d-galactosidase and β -d-glucuronidase activities21. The blue colonies isolated as putative E. coli were verified for identity using two different PCR assays. One was a multiplex PCR targeting the gene
™
Scientific Reports | 5:14337 | DOI: 10.1038/srep14337
2
www.nature.com/scientificreports/
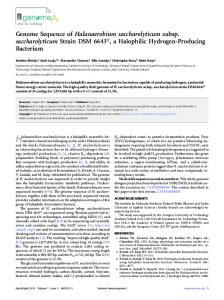
Figure 1. Flowchart for the major steps in sample preparation, data acquisition, and data analysis involved in UNID-proteomic, ID-proteomic, and REP-PCR fingerprinting.
that encodes a respiratory oxidase in E. coli (the cytochrome bd complex), and the genes that encode the enzymes whose activities would lead to the blue coloration of E. coli colonies on CHROMagarTM ECC (lactose permease, β -d-galactosidase and β -d-glucuronidase)22. The other PCR method targeted a ca. 544 bp fragment of the 16S rRNA gene specific to E. coli23. Isolates that were detected positive for all five genes were stocked at − 80 °C until use. The primers of the two PCR assays are in Supplementary Table S1. E. coli isolates were cultured to early stationary phase and washed to obtain cell pellets for DNA and protein extraction (Fig. 1) as described in the Supplementary Methods. However, the stocks of seven isolates (six of pig and one of dog) became non-cultivable during the course of this study, as they showed no growth in the culture medium in repeated attempts. There remained 73 isolates to complete the study (Table 1).
LC-MS/MS analysis. Each cell pellet was lysed and it had protein digested with trypsin as detailed
in the Supplementary Methods. Tryptic digest eluted in 0.1% formic acid (FA) in water was injected to an LTQ Velos dual-pressure ion trap mass spectrometer (Thermo Fisher Scientific) that was interfaced to a nano-electrospray ion source (spray voltage 1.6 kV, capillary temperature 250 °C), a Thermo Accela 600 pump, and an Accela autosampler LC. A BioBasic-18 column was used (dimension: 150.0 × 0.1 mm, particle size: 5 μ m; Thermo Scientific). Solvents A and B in the mobile phase (flow rate: 150 μ l min−1) were 0.1% FA in water and 0.1% FA in acetonitrile, respectively. The chromatographic conditions and data acquisition method are described in the Supplementary Methods. LC-MS grade water and acetonitrile were from J. T. Baker. All other supplies and reagents were from Sigma-Aldrich, unless specified.
Proteomic fingerprinting without peptide identification. One run of LC-MS/MS analysis was
performed for each E. coli isolate (Fig. 1). The MS/MS spectra of all isolates were compiled into a spectral dataset and converted into the mzXML format using msConvert24. Then, the MS/MS spectra were subjected to a quality-checking algorithm using SpectraST25. MS/MS spectra would pass the quality check when having: (i) ≥ 35 fragments, (ii) a precursor m/z > 350 Th, (iii) the m/z of the heaviest and the lightest fragment differed by > 350 Th, and (iv) > 5% of the total intensity represented by fragments that were larger than the precursor m/z. Criterion four served to differentiate peptide ions (typically multi-charged upon electrospray ionization) from non-peptide ions (typically single-charged). MS/MS spectra passing the quality check were analyzed using the similarity-clustering algorithm of SpectraST15,25. MS/MS spectra that had (i) precursor m/z differed by 0.7 were regarded as replicate spectra derived from multiple observations of the same peptide ion species, and were hence merged into a unique consensus spectrum (UNID-consensus spectrum hereafter) after peak alignment and noise-filtering (Fig. 1). These procedures resulted in a spectral library that contained entries of individual UNID-consensus spectra along with the number and origin (i.e. which E. coli isolate) of the replicate spectra constituting each of them. Then, for each isolate, the numbers of replicate spectra that constituted its individual UNID-consensus spectra were normalized using the total number of MS/MS spectra acquired for the isolate. The collection of UNID-consensus spectra (i.e. presumably each represented a different peptide ion species) and the normalized abundance of the constituting replicate spectra (i.e. relative spectral counts of individual presumptive peptide ion species) associated with each isolate were used as the proteomic fingerprint (UNID-proteomic fingerprint hereafter) of the isolate (Fig. 1).
Proteomic fingerprinting based on peptide identification. The MS/MS spectral dataset was
also subjected to peptide identification (Fig. 1). A protein database was constructed by combining all reviewed E. coli proteins in the UniProt-SwissProt database, and the common contaminant proteins listed
Scientific Reports | 5:14337 | DOI: 10.1038/srep14337
3
www.nature.com/scientificreports/ in the common Repository of Adventitious Proteins. Then, the protein database was appended to an equal-size decoy database generated by random shuffling of amino acids between tryptic sites26. Two traditional sequence database searching engines, namely OMSSA (ver 2.1.8)27 and X!Tandem with K-score plugin (ver 2011.12.01.1)28, were used with parameters as follows: (i) trypsin as the digestion enzyme, (ii) allowing the missing of one internal tryptic cleavage, (iii) carbamidomethylation on cysteines as a fixed modification, (iv) oxidation of methionine as a variable modification, (v) mass tolerances of + /− 3 Da for precursors, and (vi) + /− 1 Da for product ions. Refinement search was enabled in X!Tandem in an error tolerant mode, allowing the identification of single nucleotide polymorphism. The search results were analyzed and combined using PeptideProphet and iProphet29 in the Trans Proteomic Pipeline (v4.5.3)30. Upon filtering with a global false discovery rate of 1%, as estimated by a target-decoy strategy, MS/MS spectra that were identified to the same peptide were merged into a unique consensus spectrum (ID-consensus spectrum hereafter) after peak alignment and noise-filtering. For each E. coli isolate, the collection of ID-consensus spectra and the relative abundance of the constituting MS/MS spectra were used as its ID-proteomic fingerprint (Fig. 1).
Interspersed repetitive extragenic palindromes (REP)-PCR fingerprinting. DNA was extracted
from cell pellet as described in the Supplementary Methods. REP sequences were PCR-amplified using primers Rep1R-I (5′ -ICGICGICATCIGGC-3′ ) and Rep2-I (5′ -ICGICTTATCIGGCCTAC-3′ ) and resolved using gel electrophoresis as described previously31. On each 15-lane gel, the first and the last lanes were not used so as to minimize intra-gel distortion of fingerprints whereas the 2nd, 8th, and 14th lanes were loaded with a 1-Kb DNA ladder. Images of REP-PCR fingerprints captured from the gels after ethidium bromide staining were transformed into densitometric curves and aligned to that of the 1-Kb DNA ladder using Bionumerics version 6.5 (Applied Maths) (Fig. 1).
®
Data analysis. All analyses were conducted in R32 with the “ape”33 or “mixOmics” package34. E. coli
isolates were compared pairwise for similarity in each fingerprinting type using Pearson correlation coefficient. The similarity matrices were visualized using multidimensional scaling (MDS). Differences among the four source groups (sewage, cow, dog and pig) were tested using the analysis of similarity (ANOSIM). Jackknife analysis was used as an internal measure of the accuracy of a fingerprint library in classifying a query isolate to the correct source35. For each source group, the percentage of its isolates being correctly assigned to the group was determined as the rate of correct classification (RCC). An average RCC (ARCC) was determined for all source groups in a library. Since UNID-proteomic fingerprinting did not involve peptide identification, selected UNID-consensus spectra were computationally evaluated for their likelihood of being derived from peptides. Briefly, partial least squares discriminant analysis (PLS-DA) was conducted to rank the UNID-consensus spectra for their relative importance (referred to as “loading” in PLS-DA terminology) in differentiating E. coli isolates by source group36. For each source group, UNID-consensus spectra of the top ten highest loading were subjected to de novo sequencing to deduce a peptide’s amino acid sequence from its MS/MS spectra without searching a protein database37,38. De novo sequencing was conducted with PEAKs studio (version 7.0; build 20131119)39 with default parameters, except that: i) parent mass error tolerance was 1.5 Da, ii) fragment mass error tolerance was 0.5 Da, iii) trypsin as digestion enzyme, iv) carbamidomethylation (+ 57.02 Da, C) as fixed modification, v) oxidation (+ 15.99 Da, M) as variable modification, and vi) maximum variable post-translation modification allowed per peptide was three. Sequence tags were identified with at least one b or y ion matched within the fragment mass error tolerance.
Accession number. The mass spectrometry proteomics data have been deposited to the ProteomeXchange Consortium40 via the PRIDE partner repository with the dataset identifier PXD001646.
Results and Discussion
UNID- and ID-consensus spectral libraries. A total of 1,188,790 MS/MS spectra were obtained
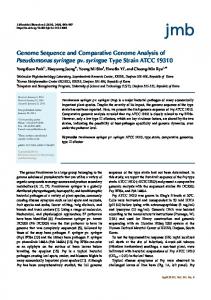
from the tryptic digest of the 73 E. coli isolates. Using the similarity-clustering algorithm, 61% (734,723) of the MS/MS spectra were merged into 19,950 UNID-consensus spectra; the remaining ones were discarded for being regarded as low-quality or non-peptide derived. On the contrary, the conventional workflow of peptide identification could made use of only 11.9% (142,376) of the MS/MS spectra and merged them into 5,025 ID-consensus spectra. The consensus spectra (both UNID and ID) varied in ubiquity, from being associated with only one isolate to being associated with all isolates tested (Fig. 2). There were 3,414 UNID-consensus spectra and 1176 ID-consensus spectra being isolate-specific. The numbers decreased as the ubiquity of the consensus spectra increased, except for those that were almost universally present in all isolates tested (i.e. ≥ 70 isolates) (Fig. 2), resembling the U-shaped distribution of gene frequency typically observed for the pangenome of a bacterial species41,42. Such distribution was more obvious for the UNID-consensus spectra than the ID counterparts (Fig. 2). E. coli exhibits a very high level of genome plasticity43. The sizes of the > 2,400 genome sequences of E. coli currently available in the Genbank differ by as much as 2 Mb, varying between 4.0 and 5.9 Mb. Among the ~16,000 homolog gene clusters that have been identified for the E. coli pangenome, only 10% belong to the core genome; the remaining ones distribute variably among strains44. Despite the intense
Scientific Reports | 5:14337 | DOI: 10.1038/srep14337
4
www.nature.com/scientificreports/
Figure 2. The ubiquity of the UNID- and ID-consensus spectra obtained. Data shown are the number of consensus spectra that belonged to each level of ubiquity, from being associated with only one isolate tested to being associated with all 73 isolates tested.
Source group
UNID-Proteomic
ID-Proteomic
REP-PCR
Sewage
Cow
Dog
Sewage
Cow
Dog
Pig
0.572
0.850
0.758
0.451
0.744
0.693
Dog
0.764
0.997
0.666
0.981
Cow
0.979
Global
0.950 0.814
Sewage
Cow
Dog
0.539
0.929
0.982
0.647
0.375
0.514 0.735
0.640
Table 2. ANOSIM comparison of UNID-proteomic, ID-proteomic, and REP-PCR fingerprints among E. coli isolates of different source groups. Results shown are the R-values of ANOSIM for global and pairwise comparison. The R-values vary between 0 and 1, where 0 represents that the groups concerned were identical and 1 represents that the groups were completely different. All R-values shown are statistically significant (p