textures, these techniques cannot explain how the HVS responds to the texture content. HCI is thus necessary to verify computer vision theories. An alternative ...
Eurographics 2006, Short Presentation
A Perceptual Approach to Texture Scaling based on Human Computer Interaction Irene Cheng and Walter Bischof Department of Computing Science, Univ. of Alberta, Edmonton, CANADA, {lin, wfb}@cs.ualberta.ca
Abstract The trade-off between texture quality and data size is often an important factor for online multimedia applications including 3D games, virtual reality, as well as for applications designed for portable devices. Although a number of state-of-the-art texture compression techniques have been proposed in the literature, there is little research on optimal resolution reduction, and especially on how the human visual system responds to texture scaling. In this paper, we investigate the visual discrimination of scaled textures and the threshold above which quality improvement is imperceptible. A perceptual approach based on human computer interaction is proposed along with its applications. Our contribution lies in introducing texture scaling over and above texture compression in order to achieve more efficient data transmission and quality preservation. Categories and Subject Descriptors: I.3.6 [Computer Graphics]: Methodology and Techniques; I.3.7 [Computer Graphics]: Threedimensional Graphics and Realism; [Computer Graphics]: Applications
1. Introduction As more hardware and software graphics platforms support texture mapping, virtual scenes that are required by multimedia applications are becoming more complex, making greater use of high resolution texture images. The cost of high resolution texture is large data size, which adversely affects latency, transmission time, quality of service and visual quality. Although many state-of-the-art data compression algorithms with good compression ratios [GW02] [LD04] were proposed in the literature, little research has been carried out to study texture scaling using a perceptual approach. Texture scaling refers to reducing the resolution of an image, which, combined with an efficient compression algorithm, can provide efficient data transmission. Some interesting research topics in Internet applications these days are about texture resolution. For example, one discussion was whether 5122 or even greater resolution texture should be used in cube games. A game programmer suspected what he saw was 5122 texture, but it turned out that the resolution used was 2562. Obviously texture resolution should not be higher than the display dimension multiplied by the dot density (in dpi, dots per inch). But can we use a lower resolution without affecting perception, and if so, what should the resolution be? This question is relevant not only in games, but also in other multimedia applications, including, for example, teleconferencing and virtual museums. In this paper, we apply a perceptual approach based on human computer interaction (HCI) to design efficient texture scaling. Based on observers’ responses to computer generated images, we determine the optimal resolution of transmitted texture data. A perceptual approach was already used by Lindholm et al. [LSC*02], but their focus was on the effect of terrain-texture resolution on the perceived speed of self-motion, whereas we focus on the perceived quality of slowly moving 3D objects. Bravo et al. studied the perception of texture on folded surfaces [BF01], where textures were mapped onto three panels folded like a brochure. Each panel was textured with an oriented noise pattern and the observers had to determine which side panel matched the center panel of the surface texture. Bravo et al. found that
observers were often consistently wrong, although the judgments were accurate when the panels were placed flat and each panel was compared individually. This shows that viewing perspective can affect the discrimination ability. In order to simulate perspective in different orientations and the perception of depth in multimedia applications, texture images were mapped on 3D cubes in our experiments. Another reason to use 3D cubes is to separate the geometric factor from the texture factor. It has been shown in earlier perceptual experiments that a surface with more complex structures requires a higher texture quality than a flat surface in order to preserve similar visual quality [CB05]. A perceptually-based approach was presented by Dumont et al. [DPF01]. In their algorithm, texture region with greater visual importance was assigned higher resolution. The determination of visual importance was dictated by view-point, illumination, texture contrast and frequency content. In contrast, our approach is view-independent and is intended to take advantage of the psychophysical limit of the human visual system (HVS) instead of the texture properties. While Gouraud interpolated vertex color was used in their model, photorealistic texture mapping is used in ours. Our method, supported by psychophysical experimental results, can be applied in conjunction with an efficient compression algorithm. The rest of this paper is organized as follows: Section 2 describes the methodology and the perceptual experiments. Section 3 analyzes the experimental results. Section 4 discusses the applications. Section 5 discusses future work and finally Section 6 gives the conclusion. 2. Visual discrimination of texture scaling 2.1. Methodology In order to determine how the human visual system responds to texture scaling, we performed perceptual experiments using a two-alternative-forced-choice (2AFC) task [Wat93] [SB94]. Although image processing and pattern recognition techniques can be used to analyze the structural and syntactic content of textures, these techniques cannot explain how the HVS responds to the texture content. HCI is thus necessary to verify computer vision theories. An alternative approach is to
discover the HVS response first and then analyze such behaviour. In this paper, we follow the latter approach. 2AFC is a procedure for determining thresholds that is commonly used in psychophysical experiments and has been shown to produce reliable results. In our experiments, observers were presented with two slowly rotating cubes (stimuli) displayed side-by-side so that the observer could compare the projected texture, mapped onto the six surfaces of each cube, in different perspectives. Since the visual discrimination power decreases as velocity increases [BKT86], the cubes were rotated slowly and could be stopped by the observer, because the focus of our experiments is on the texture factor and not on the temporal factor. A randomly selected texture image was mapped on each cube. Both cubes had the same dimension with face area of n x n pixels. One cube was mapped with a texture of the original resolution ResO, i.e. n x n pixels, on each face; and the other cube was mapped with a lower resolution texture ResL scaled up using 4-neighbour bilinear interpolation. We apply the 4-neighbour bilinear interpolation algorithm because it is commonly used in image processing. The observer then decided whether the left or right cube had a better quality. The response was considered correct if the cube mapped with the original resolution was chosen. We implemented the 2AFC task with the two-up-one-down staircase algorithm [WL65]. In this procedure, ResL is raised by ∆Res after two correct responses and ResL is reduced by ∆Res after one incorrect response. This staircase procedure satisfies the equation:
p 2 = (1 − p) + p(1 − p) = 1 − p 2 (1) where p is the probability of a correct answer. The procedure converges to an equilibrium (visual threshold) for p = 70.7%, where the probabilities of raising or reducing ResL are equal. Equation (1) guarantees that random choice responses by the observers (p = 50%) do not converge to the equilibrium. If the initial value of ResL is too low, many trials are required before the equilibrium is reached. This is not desirable because the result may be biased due to fatigue [CB04]. Among the many scaling algorithms, pixel mixing is commonly used by developers because it tends to replicate what the HVS sees as the image moves closer to or further away from the viewpoint [Web1]. While the discrete sampling algorithm preserves the same set of colors, it generates less smooth images when scaling down. The linear scaling algorithm is faster but can lead to lower image quality. We therefore adopted pixel mixing in our experiments. 2.2. Perceptual experiments based on human computer interaction
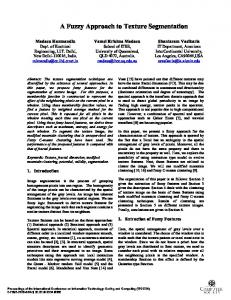
Fig. 1: Each cube face is 1602 pixels. (Left) Texture of 1442 pixels interpolated to 1602 pixels. (Right) Original texture resolution of 1602 pixels.
Fig. 1 shows an example of two stimuli in our experiments, presented using a JAVA3D interface simulating textures mapped on two 3D objects. In the first set of experiments, five JPEG images (Fig. 2) of 2562 pixels (Res256) were each scaled down to lower resolution images by reducing 2i pixels linearly in the x and y directions, resulting in an image set S = {Res2i | 1 ≤ i ≤ 128}. Each lower resolution was generated by scaling down ResO in order to preserve a high image quality when generating the set S.
Fig. 2: Five images of 2562resolutions were used in the first set of experiment.
Fig. 3: Response curve of an observer using ResL = 90% x ResO.
Fig. 4: Response curve of an observer using ResL = 80% x ResO. Six test resolution levels (n2 = 2562, 1922, 1602, 1282, 962 and 642) were chosen. In each loop, the six test levels were shuffled and presented to the observers in random order. At each test level, ResO and Res2i were displayed side by side, and a randomly selected image was used. The observer had to determine which of the two stimuli had a better quality − ResO or Res2i. The initial value of 2i was set at 90% of ResO. The value was then raised or reduced as defined by the staircase procedure. There were a total of 60 loops resulting in a total of 360 responses (Fig. 3). The response curve at test level 1602 was steeper compared to the others. A similar trend appeared when using ResL = 80% x ResO (Fig. 4). To verify the consistency of this pattern, we collected the responses from 20 observers (Fig. 5). The average equilibrium resolution expressed as a percentage of the original resolution ResO at each test level is shown in Table 1. We used different starting values in the range from 60% to 90% for ResL. When ResL was too low, some test levels might not be
3
able to achieve equilibrium in 60 loops. If the curve for an observer did not converge in the last 20 loops, the data was excluded from the results. At each test level, the average of the last 20 loops was computed for each observer. Fig. 5 shows the average taken from each of the 20 observers and the overall average (dot symbol) at each test level. It was found that at test level 1602, the visual discrimination ability was weaker for all observers, compared with that at other test levels. Five sets of images were tested by the observers (Set 1 is shown in Fig. 2). One image was selected at random in every trial. The idea was to simulate a dynamic application environment with a variety of textures, with the observer not knowing beforehand what texture would appear next.
In all experimental conditions, we consistently found low discrimination ability around the 1602 test level. Extending beyond the 2562 test level, we noticed that the general trend of the responses follows a wave pattern with peaks and troughs (Fig. 6). The HVS is complex and it is difficult to detect the peaks and troughs using simple statistics such as MSE (mean square error) [TPA98]. We also compared the relative change on luminosity, and each of the RGB colors at 85% scaling for test levels 160 (trough) and 192 (peak). Fig. 7 shows that the two levels have similar mean and standard deviation values; it is thus difficult to predict the peaks and troughs using these values.
Fig. 5: Responses collected from 20 observers show that at test level 1602, visual discrimination on the scaled images is relatively lower compared to that at other test levels.
Fig. 7: Analysis of the kimono texture in Fig. 1. The relative changes on luminosity, and the RGB colors at 85% resolution are similar at test levels 160 and 192.
Level Avg.
64 86.7%
96 92.5%
128 90.3%
160 72.7%
192 91.5%
256 86.4%
Table 1: Equilibrium resolution expressed as a percentage of the original resolution ResO at each test level. The experiments were conducted in a research laboratory with indoor incandescent lighting. The observers were seated at a normal viewing distance of about 20 inches in front of the display. Both color and greyscale texture images were tested. Some images had a salient content, such as cats and dogs, others had random patterns. Furthermore, the evaluations were carried out on three different monitors with resolutions of: 1280 x 1024, 1152 x 900, and 1024 x 768; and dimensions of: 16” x 12”, 15” x 12”, and 12” x 9” respectively. The time spent by each observer excluding inter-block breaks was between 16 and 30 minutes. It is interesting to note that longer time did not bring higher correctness. 3. Analysis of results
Two important observations can be drawn from these studies: 1) The responses from 20 observers show that in general texture qualities are difficult to discriminate if the difference in resolution between the two stimuli is within 10%. This outcome is consistent with the study on relative change and Just-Noticeable-Difference discussed in [CB05a]. 2) The second observation, that the discrimination power is relatively lower at the 160 test level and a multiple of 160, is not something one would predict. We encoded our textures using JPEG because of its wide support and usage on the web and in online applications. JPEG provides good compression ratio while preserving satisfactory data quality. In order to find out whether the wave pattern is caused by the JPEG encoding and decoding process, we also performed similar experiments using BMP images. Again the wave pattern was obtained. This pattern is most likely caused by a combination of factors, namely the pixel mixing algorithm employed in the scaling process, the 4neighbour bilinear interpolation used in JAVA for rendering, and possibly some perceptual factors. It is not the goal of this paper to discuss the exact causes of this perceptual behaviour. However, we try to measure and model HVS responses to texture scaling and show its applications. Based on observation (1), multimedia applications can take advantage of this perceptual response to improve the efficiency of image visualization and transmission. 4. Applications
Fig. 6: Experimental results show that the general trend of the equilibrium resolution as a percentage of the test level follows a wave pattern.
Based on the equilibrium curve in Figure 6, we can reduce the texture resolution, to a certain extent, without any noticeable degradation in visual quality. If E is the vertical axis in Fig. 6,
the resulting bandwidth savings from this reduction would be (1 – E2). The saving values are plotted in Fig. 8, and appear to closely fit a sine curve:
2πx y = y0 + a sin + c b
(2)
where a, b, c and y0 are constants. The fitted curve has a confidence level of 95%. It can be seen that the saving is relatively higher when ResO is around 160. In the current experiments, we did not use cubes of large dimension due to limited screen resolution. We will leave the study on higher cube dimensions to future research. Some example textures comparing the original and equilibrium resolutions are shown in Fig. 9.
Fig. 8: Based on Fig. 6, the saving corresponding to each test level is fitted into a sine curve.
Fig. 9: Test level 160: LHS is 160 and RHS is 75% resolution interpolated. It can be seen that the baboon and kimono texture quality on both cubes are similar. 5. Conclusion and Future work In this paper we introduced a novel perceptual approach based on human computer interaction to define a response curve to texture scaling. By taking advantage of the visual discrimination ability, high resolution texture images can be scaled to the equilibrium resolution without significant degradation in quality. Our perceptual approach can also be used to evaluate the efficiency of different scaling algorithms, e.g. bicubic interpolation and pixel mixing, by comparing the response curves. In order to utilize transmission bandwidth efficiently while preserving high data quality, a compact 3D mesh representation method was proposed in [BFH05]. Our texture scaling approach can be integrated with any mesh reduction technique and texture compression algorithm to optimize bandwidth usage. Differing from simple synthetic texture and color per vertex, which can be described procedurally, our texture scaling technique is designed for high resolution photorealistic texture. In future work, we will study the response curves for images of different brightness and complexity. We will revisit the Visual Quality Prediction model [CB05] by incorporating texture resolution as a visual predictor.
Fig. 10: From left to right, the queen models, textured mapped and mesh, have 1296, 900 and 542 vertices respectively. A simple case of 3D texture mapping was presented in this paper in order to study the effect of texture scaling on human perception. The work will be extended in the future to study increasingly complex meshes. Incrementally increasing the complexity of a mesh can be systematically achieved following a scale-space approach incorporating the Just-NoticeableDifference (JND) on a mesh. For example, the queen texture can be mapped on increasingly complex scale-space models of the queen (Fig. 10). At every given scale we will need to generate the equilibrium resolution curves and study its variation with increasing complexity of meshes. Also, it will be beneficial to incorporate view-point, texture properties and other environmental factors in the user evaluation to analyze their effects on the result. References [BF01] M. J. Bravo and H. Farid, “The perception of texture on folded surfaces,” Perception, 30(7), 2001, pp. 819-832. [BFH05] R. Berndt, D. Fellner and S. Havemann, “Generative 3D Models: A key to more information within less bandwidth at higher quality,” In Proc. of Web3D 2005, pp 111-121. [BKT86] Boff K., Kaufman L. and Thomas J., “Handbook of perception and human performance, Sensory Processes and Perception,” A WileyInterscience Publication, Vol. I, 1986. [CB04] I. Cheng and A. Basu, “Reliability and Judging Fatigue Reduction in 3D Perceptual Quality Estimation,” 2nd Int’l Symposium on 3DPVT, September 2004, 6 pages, Thessaloniki. [CB05] I. Cheng and P. Boulanger, “A Visual Quality Prediction Model for 3D Texture,” EUROGRAPHICS, 2005, 4 pages. [CB05a] I. Cheng and P. Boulanger, “A 3D Perceptual Metric using Just-Noticeable-Difference,” EUROGRAPHICS, 2005, 4 p. [DPF01] R. Dumont, F. Pellacini and J. Ferwerda, “A PerceptuallyBased Texture Caching Algorithm for Hardware-Based Rendering,” In Proc. Eurographics Workshop on Rendering Techniques, Jun 2005, pp.249-256. [GW02] R. C. Gonzalez and R. E. Woods, “Digital image processing,” 2nd Edition, Prentice Hall 2002. [LD04] Z. N. Li and M. S. Drew, “Fundamentals of multimedia,” Pearson Prentice Hall 2004. [LSC02] J. M. Lindholm, A. A. Scharine, S. Chaudhry and B. J. Pierce, “Effects of terrain-texture resolution on the perceived speed of simulated self-motion,” Journal of Vision, 2(7), Nov 2002, pp. 507a. [SB94] R. Sekuler and R. Blake, “Perception,” 3rd Edition, McGrawHill, Inc. 1994. [TPA98] C. Taylor, Z. Pizlo and J. Allebach, “Perceptually relevant image fidelity,” in Proc. of IS&T/SPIE Int’l Symposium on Electronic Imaging Science and Technology, 110-118, 1998. [Wat93] A. B. Watson, “Digital images and human vision,” The MIT Press, Cambridge-London 1993. [Web1] http://netpbm.sourceforge.net/doc/pamscale.html [WL65] G. B. Wetherill and H. Levitt, “Sequential estimation of points on a psychometric function,” British Journal of Mathematical and Statistical Psychology, 18, 1965, pp. 1-10.