Therefore the weight w(xi) indicates the importance the pixel xi has in .... Experiment results. a) distance as a function of the number of learning trials. b) time ...
A Perceptual User Interface Using Mean Shift Edson Prestes1 , Anderson P. Ferrugem1 , Marco A. P. Idiart2 , and Dante A. C. Barone1 Universidade Federal do Rio Grande do Sul, Instituto de Inform´atica-UFRGS, P.O. Box 15064, and 2 Instituto de F´ısica-UFRGS, P.O. Box 15051, 91501-970 Porto Alegre, RS - Brazil {prestes, ferrugem, idiart, barone}@inf.ufrgs.br 1
Abstract. This work describes a perceptual user interface based on the Mean Shift algorithm to control mouse events by gestures using a generic usb camera. To demonstrate the usefulness of our work, we present two preliminaries experiments that are controlled by the mouth. The first experiment corresponds to a specific application in charge of controlling a game called pitfall. The second one is a generic experiment that evaluates the precision and robustness of the interface. These preliminaries results show that potentiality and applicability of our study to disable people.
1
Introduction
The body expressions are natural ways used by humans and animals to communicate, express feelings and internal intentions in the society. During the last years, they have been used to build interfaces more intuitive than the traditional ones based on keyboard or mouse. These interfaces, commonly called perceptual user interface(PUI) gave rise to a new concept of interaction between man and machine. The PUIs allow the user to have a bidirectional interaction with the computer in a simplified way. They are good candidates in learning, monitoring and accessibility tasks, such as teaching of deaf sign language, studying of athlete performance, helping disable people to use the computer, commercial computer games, immersive 3D world, etc. Such new generation of interfaces will improve substantially the execution of tasks through the parallelization of user actions [1]. For example, the use of vision as a second stream of input, in addition to mouse, allows the interface to perceive the user, classify his movements and activities by reacting accordingly [2]. In short, they are good handfree alternative and/or extension to conventional pointing devices. Furthermore, they are cheaper as compared to early systems that required expensive dedicated hardware like headgear or data glove. Several interfaces and techniques have been developed during the last years, for instance, Toyama [3] proposed the use of head motion to position the cursor in a GUI through the Incremental Focus of Attention; Li [4] developed an interface that is able to lip-reading using eigensequences; Bérard[1] proposed a technique that uses head motion to navigate in a document; Davis [5] developed a PUI that uses PupilCam together with anthropometric head and face measures to recognize user acknowledgments from C. Lemaˆıtre, C.A. Reyes, and J.A. Gonzalez (Eds.): IBERAMIA 2004, LNAI 3315, pp. 590–599, 2004. c Springer-Verlag Berlin Heidelberg 2004 �
A Perceptual User Interface Using Mean Shift
591
head gestures. Nishikawa [6] developed an interface based on vision for controlling the position of a laparoscope and so on. In this paper, we propose a perceptual interface based on vision that uses as core the Mean Shift algorithm [7, 8]. This algorithm is fast and efficient being an excellent candidate to real time task. It has been used successfully in task of tracking of objects during the last years. In our interface, it is used to track and to interpret gestures. This paper is organized as follows. The Section 2 presents the Mean Shift algorithm. The Section 3 shows the Perceptual Interface. The Section 4 shows the experiments and, finally, the Section 5 presents the future works and conclusions.
2
Mean Shift
The Mean Shift Algorithm was proposed by Comaniciu [8, 9] to track non-rigid objects with different colors and texture patterns in real-time. The basic idea is to persue a desired target in the current frame with a fixed-shape window. The algorithm receives as input model a target color distribution and monitors a candidate region whose color content matches the input model. It estimates the position of the target in the next image frame where supposedly the difference among the color distribution of the candidate region and the input model is smaller than a predefined threshold[8]. This difference is calculated from the Bhattacharyya coefficient [10] that provides a trusty similarity measure. This method has proved to be robust to partial occlusions of the target, large variation in the target scale and appearance, rotation in depth and changes in camera position [8]. Furthermore, Comaniciu [9] showed that spatially masking the target with an isotropic kernel permits the use of a gradient optimization method to perform an efficient target localization compared to exhaustive search methods. The algorithm works as follows. Initially, it receives as input the color model of the target represented as a probability density function (pdf) in the feature space; secondly, it estimates the new target position through a mean vector calculated from Mean Shift Algorithm. Next, the candidate region move to the direction pointed by the mean vector, and the process proceed. 2.1
The Target Model
The aim of the method is to follow a given object or feature that moves in a scene. The first step, therefore, is to characterize such image. A model of the object is chosen in the following way: A circular region, of radius h, centered in the object’s center xc and encompassing it totally is selected. For each point (or pixel) x = (x1 , x2 ) in the region a feature vector is extracted and categorized according to a discrete number of prototypical features, and the point receives the index of that feature, u = b(x). The feature distribution q = {qu }u=1...m , that accounts for the fractional occurrence of a given feature u in the object’s region, is calculated by
qu =
n �
i=1
κ(|xi − xc |/h) δ(b(xi ), u) n �
i=1
κ(|xi − xc |/h)
.
(1)
592
E. Prestes et al.
where, xc is the center of region and δ is the Kronecker delta function1 . Observe that �the m the distribution satisfy u=1 qu = 1. The function κ(x) is an isotropic kernel with a convex and monotonic decreasing profile. Its goal is to reduce the importance of the peripheral features when calculating the target’s q distribution. In our experiments, we choose the Epanechnikov Kernel � 1 −1 C (d + 2)(1 − x2 ) if x ≤ 1 κ(x) = 2 d (2) 0 otherwise. where Cd is the volume of the unit d-dimensional sphere [11], in our case d = 2, and Cd = 4/3 π. Specifically, the important features are color. The q distribution represents a color histogram q = {qu }u=1...m that incorporates color and spatial information of the image pixels. 2.2
The Candidate Region
A candidate region is a region whose feature distribution is highly similar to the target color model. In a given image frame we define the feature distribution for a given point y in the image,and scale he , as
pu (y, he ) =
n �
i=1
κ(|xi − y|/he ) δ(b(xi ), u) n �
i=1
.
(3)
κ(|xi − y|/he )
The scale he defines a tentative size for the object’s circular region. The similarity of the two distributions can be calculated by the Bhattacharyya coefficient m � � √ ρ(y) = ρ[p(y), q] = pu (y) qu (4) u=1
This coefficient can be viewed geometrically as the cosine of the angle between the √ √ √ √ m-dimensional unit vector p = ( p1 , . . . , pm ) and q = ( q1 , . . . , qm ).
2.3
Target Localization
The target is localized at the point y∗ , and scale h∗ , such that ρ(y∗ , h∗ ) = maxy,h ρ(y, h), i.e., the candidate region with the highest similarity. For real time applications an exhaustive search in (y, h) space is hopeless, therefore we have to adopt an incremental procedure where the candidate region suffers small corrections at each image frame. It is a reasonable approximation when the object’s motion is small during the time between frames. The adequate method is to adopt the gradient ascent on the similarity function, or yn+1 = yn + η∇ρ(yn ) 1
The Kronecker delta function returns 1 if its arguments are equal and 0, otherwise.
(5)
A Perceptual User Interface Using Mean Shift
593
Here we focus to the case where the scale he = h is fixed at the correct one, and the only the position y is adjusted. Considering that y0 is the current estimate of the object’s position, the similarity function can be expanded around this value for small corrections using that pu (y, h) = pu (y0 , h) + (y − y0 ) · ∇pu |y=y0 , as
� m m 1 �� qu 1� ρ(y) ≈ pu (y0 )qu + pu (y) pu (y0 ) 2 u=1 2 u=1
(6)
Introducing (3) in (6), we obtain
ρ(y) ≈
n �
w(xi ) κ (|y − xi |/h) 1 1 ρ(y0 ) + i=1 � n 2 2 κ (|y − xi |/h)
(7)
i=1
where the weight w(xi ) is given by w(xi ) =
m �
u=1
� δ(b(xi ), u)
qu = pu (y0 )
�
qb(xi ) pb(xi ) (y0 )
(8)
The ratio ru = qu /pu (y0 ) indicates if the color u, for the current estimation of the object’s position (y0 ), is above (ru < 1) or below (ru > 1) the model’s prediction. Therefore the weight w(xi ) indicates the importance the pixel xi has in correcting the object’s color distribution. After some manipulation, the gradient of the eq. (7) can be written as n � (xi − y0 ) w(xi ) (9) ∆y = i=1 � n w(xi ) i=1
where it was used that derivative of the Epanechnikov kernel is linear in position. Equation (9) is also called the Mean Shift vector. It points to the direction the center of the kernel has to move in order to maximize the similarity between the colors distributions p(y) and q. The new estimate for the object’s position is simply
y1 =
n �
xi w(xi )
i=1 n �
(10) w(xi )
i=1
It can viewed as the mean position calculated from each pixel position xi weighted by the ratio ru of its color. In the application algorithm if y1 overshoots, i.e., if ρ[p(y1 ), q] < ρ[p(y0 ), q], we do y1 → 12 (y0 + y1 ) until some improvement is attained.
594
3
E. Prestes et al.
Perceptual Interface
Our interface uses the meanshift algorithm to track and to interpret gestures using a generic usb camera. Initially, the user selects the target to be tracked, for instance the nose, mouth, hand, etc. Next, he determines actions and associates them to different target configurations. We adopted two different controlling strategies. The first is generic: the user controls the computer using a virtual mouse, i.e. , the mouse movement and click events are set by gestures. The mouse movement is done interpreting the target position and the click event is determined by the target configuration. The second strategy is position specific, it depends on the absolute position of the target at the image frame captured by the webcam. Both will be discussed below. 3.1
Target Selection
The selection is done by delimiting a region that contains the target in the image coming from the video stream using a box. The Figure 1 shows the selection of a target region to be tracked. In this case, the target corresponds to the mouth of the researcher. Using the same idea, the user can associated different target configurations to mouse actions. For instance, the Figure 1 shows two target configurations. The mouth opened is associated to the left mouse click whereas the mouth closed is associated to the track algorithm to move the pointer mouse in the environment. 3.2
Neutral Zone
Neutral zone corresponds to a specific radial area in the current image frame where no mouse movement or click event is performed. It is defined in the beginning of the control process; its center cz = (cz1 , cz2 ) corresponds to the center of the target and the its radius rz is set by the user. The neutral zone controls the sensitivity of the system. When the center of the target is outside of the neutral zone, the control takes place. The region 5 in Figure 2 corresponds to the neutral zone. 3.3
Specific Control Management
In the specific control, the user maps regions outside of neutral zone into actions. The Figure 2 illustrates eight regions commolly used. In our experiments with Microsoft
Fig. 1. Target selection. The red box delimits the region to be tracked
A Perceptual User Interface Using Mean Shift
1
2
3
4
5
6
7
8
9
595
Fig. 2. Image regions used to define different actions
Powerpoint, we used the regions 4 and 6 to go forward and go back in powerpoint presentation, respectively. On the other hand, in our experiments with Windows Media Player, we used the regions 4 and 6 to go forward and back, respectively, in the playlist; and the regions 2 and 8 to increase and decrease volume, respectively. In this case, it was necessary four different regions to control the application. An action an associated to a region n is executed only when a transition from the neutral zone to the region n occurs. No action is executed when a transition between region outside of neutral zone happens. After the execution of an action, the user must return to the neutral zone to activate other action. We intended to implement a mechanism to shoot a sequence of actions instead of a single action each time. In place of performing m transitions from the neutral zone to the region n to execute m times the action an , the user is going to need to keep the target a period of time in the region n. In this case, each action is performed at each τ seconds. 3.4
Generic Control Management
In the generic control, the user can move the mouse pointer and shoot the left mouse click event anywhere. The mouse pointer motion is produced from the displacement of the target in the source image. When the center target ct = (ct1 , ct2 ) is outside of the neutral zone, � (ct1 − cz1 )2 + (ct2 − cz2 )2 > rz ,
the target displacement vector d = (d1 , d2 ) is computed, where d1 = ct1 − cz1 and d2 = ct2 − cz2 . The mouse position is updated as follows. Initially, we calculate the target displacement ∆d beyond the neutral zone. This displacement has an upper bound u to constrain the pointer speed, ∆d = min{|d| − rz , u}. The upper bound value u is defined by the user in run-time. The speed v is (∆d/u)∗vmax , where vmax defines the maximum speed of the pointer mouse at each step. The mouse pointer position p = (p1 , p2 ) is updated by � d1 d2 v (11) , pt+1 = pt + |d| |d|
596
E. Prestes et al.
This update is performed at each algorithm step in a similar way to a joystick. The Equation 11 controls the mouse speed according to v, i. e., the greater the value v the faster the pointer mouse will move. It allows a smooth, rapid and precise motion in relation to a linear update, where the displacement of the pointer mouse is constant. To simulate the left mouse event, we need to determine when the target configuration associated to tracking has changed to the target configuration related to the click event. To detect such change, initially, we need to extract the color models of both configurations using the eq.(1). Consider qt and qc the color models of the target configurations associated to track and click events, respectively. To determine what action to take, we need to compute the similarity between the candidate region, discussed in Section 2.2, and these color models. This computation aims to identify what model best matches with candidate region, and it is done only when the target center is inside the Neutral Zone. Misclassification can occur due to luminosity differences. To avoid it, we execute an action only when the target configuration associated is identified more than t times successively, otherwise, the configuration is interpreted as a noise.
4
Experiments
This section presents two experiments using our interface. The first one shows results of the specific control management. In this case, we present some snapshots of the interface controlling a game called pitfall. The second experiment is related to generic control management. It aims to provide a quantitative measure of the interface related to learning and motion precision. All experiments use rgb color space. We observed that rgb outperforms hsi, because rgb automatically incorporates spatial information as deepness generally disregarded by hsi color model. This feature allows the track algorithm to follow specific parts of an object with the same color. 4.1
Specific Control Management Experiment
This experiment illustrates the usefulness of the interface in the control of a commercial game using the mouth. This game consist of guiding a treasure hunter in a jungle. The hunter runs and jumps through a 2D sideview environment, avoiding hazards like crocodile-filled waters, sinkholes, etc. The Figure 3 shows the researcher controlling the hunter. In Figure 3, the blue circle corresponds to the neutral zone and the red box delimits the target. Observe the mouth position, in relation to the neutral zone, determines the action that the hunter should execute. When the mouth is in the regions 4 or 6, the hunter moves to the left or to the right, respectively (see Section 2). When it is in the regions 2 or 8, the hunter jumps or stoops. 4.2
Generic Control Management Experiment
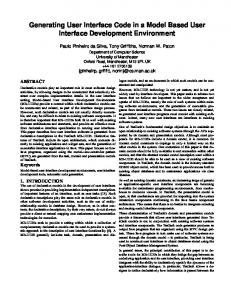
This experiment aims to show the precision and easiness of our interface. We use a maze-like environment, illustrated in Figure 4. The user was in charge of leading the red
A Perceptual User Interface Using Mean Shift (a)
(b)
(c)
(d)
597
Fig. 3. Experiment with the Pitfall game
Fig. 4. Maze-like Environment
block (traveller) from the start position to the final position while avoiding walls. We performed 6 trials for which one of 3 users. After each trial, we measured the time spent and the length of the path followed by the traveller. The walls along the corridor do not block the traveller during its motion. This feature increases the complexity of the task, because it does not constrain the traveller motion. The Figure 5a) shows the evolution of learning for each user during the trials. The axis y corresponds to the path length, in pixels, followed by the traveller and the axis x indicates
598
E. Prestes et al. (a)
(b) Time - User 1 Time - User 2 Time - User 3 Average time
Time (sec)
Path length ( in pixels)
Path - User 1 Path - User 2 Path - User 3 Average path
Trials
Trials
Fig. 5. Experiment results. a) distance as a function of the number of learning trials. b) time spent to perform the task as a function of the number of learning trials
the respective trial. The solid line is the average length of the path produced over trials. The other lines are associated to each user. Observe the path length decreases as the user learns to use the interface. After, only 6 trials, the path length produced by each user is near of the optimal path estimated previously in 1120 pixels. The average length of the path followed by the traveller after the 6 trials is �¯ = 1160.9 with standard deviation equals to σ� = 169.74. Figure 5b) illustrates the time spent to perform the task. The users spent an average of t¯ = 15.23s to achieve the goal with standard deviation of σt = 4.99 s.
5
Conclusion
This paper describes an approach based on the Mean Shift Algorithm to control the computer by gestures using a generic webcam. We validated the usefulness of our approach in two different tasks. The first task is specific and consists of controling a game called pitfall. The user controls the treasure hunter in a jungle using the motion of the mouth. The motion of the hunter is limited to 4 specific actions (jump, stoop, move left, move right). We observed that the users quickly learned to control the treasure hunter. This observation was comproved in the second task. The second task is generic and aims to show the precision and easiness of the interface. In this case, the user was in charge of leading a traveller from a start position to a final position while avoiding walls. The users conducted the traveller to a path close to the optimal path in a short period of time, nearly 15 s. These results are very promising. However, we still have some challenges to overcome. We only use color information to guide the track algorithm. This information is very sensitive to luminosity differences, which can easily generate misclassification. We intend to incorporate texture or spatial information to the color distribution. Furthermore, the track algorithm does not handle faster targets conveniently. It fails if the displacement of the target between two successive frames is bigger than the radius of the search region.
A Perceptual User Interface Using Mean Shift
599
However, it is very important to stress that neither mark nor specific dress was needed in order to make the interface work. This approach is a viable and cheap candidate to help disabled people in daily tasks.
References 1. François Bérard, “The perceptual window: Head motion as a new input stream,” in IFIP Conference on Human-Computer Interaction, 1999, pp. 238–244. 2. Sébastian Grange, Emilio Casanova, Terrence Fong, and Charles Baur, “Vision-based sensor fusion for human-computer interaction,” in Proceedings of the IEEE/RSJ International Conference on Intelligent Robots and Systems, IROS, 2002. 3. Kentaro Toyama, “"look,ma - no hands!" hands-free cursor control with real-time 3d face tracking,” in Workshop on Perceptual User Interfaces, 1998. 4. Nan Li, Shawn Dettmer, and Mubarak Shah, “Lipreading using eigensequences,” in -, , Ed., -, vol. - of -, pp. –. 5. James W. Davis and Serge Vaks, “A perceptual user interface for recognizing head gesture acknowledgements,” -, 2001. 6. Atsushi Nishikawa, Toshinori Hosoi, Kengo Koara, Daiji Negoro, Ayae Hikita, Shuichi Asano, Haruhiko Kakutani, Fumio Miyazaki, , Mitsugu Sekimoto, Masayoshi Yasui, Yasuhiro Miyake, Shuji Takiguchi, and Morito Monden, “Face mouse: A novel human-machine interface for controlling the position of a laparoscope,” IEEE Transactions on Robotics and Automation, vol. 19, no. 5, pp. 825–841, 2003. 7. Dorin Comaniciu and Visvanathan Ramesh, “Mean shift and optimal prediction for efficient object tracking,” 2000. 8. Comaniciu, Visvanathan Ramesh, and Meer, “Real-time tracking of non-rigid objects using mean shift,” in Proc. IEEE Computer Society Conference on Computer Vision and Pattern Recognition, 2000, vol. 2, pp. 142–149. 9. Dorin Comaniciu, Visvanathan Ramesh, and Peter Meer, “Kernel-based object tracking,” IEEE Transactions Pattern Analysis Machine Intelligence, vol. 25, no. 5, pp. 564–575, 2003. 10. J. Lin, “Divergence measures based on the shannon entropy,” IEEE Transactions on Information Theory, vol. 37, pp. 145–151, 1991. 11. Dorin Comaniciu and Peter Meer, “Mean shift analysis and applications,” in ICCV (2), 1999, pp. 1197–1203.