ing SPEC MPI2007 v1.1, the High Performance Computing Challenge (HPCC) .... count. RHEL5 significantly outper- forms WinHPC at 256 and 512 cores. 0. 5. 10 .... Milc-medium. 128. 244. 265. Milc-medium. 256. 82. 88. Milc-medium. 512.
A PERFORMANCE COMPARISON USING HPC BENCHMARKS: WINDOWS HPC SERVER 2008 AND RED HAT ENTERPRISE LINUX 5 S. Teige,1 R. Henschel,1 H. Li,1 J. Doleschal 2 and M. S. Mueller2 1 Indiana University, University Information Technology Services, Research Technologies
2711 E. Tenth Street, Bloomington, IN 47408, 2 Center for Information Services and High Performance Computing (ZIH), Technische Universitaet Dresden, 01062 Dresden, Germany
Abstract
A collection of performance benchmarks have been run on an IBM System X iDataPlex cluster using two different operating systems. Windows HPC Server 2008 (WinHPC) and Red Hat Enterprise Linux v5.4 (RHEL5) are compared using SPEC MPI2007 v1.1, the High Performance Computing Challenge (HPCC) and National Science Foundation (NSF) acceptance test benchmark suites. Overall, we find the performance of WinHPC and RHEL5 to be equivalent but significant performance differences exist when analyzing specific applications. We focus on presenting the results from the application benchmarks and include the results of the HPCC microbenchmark for completeness.
Keywords:
Benchmark, Operating Systems, Performance Measurement
Available from: http://hdl.handle.net/2022/9919
1.
Introduction
Many factors contribute to the performance of an application. The capability of the hardware provides an upper limit, but equally important is the software. This is not limited to the application, but includes the complete software stack including compilers, numerical libraries, the MPI implementation and the operating system. Presented here are the results of a comparison of two operating systems using several well known benchmark suites. All tests were run on a single cluster, an IBM System X iDataPlex dx340 described in detail below. To the extent possible, differences between building and running conditions were minimized allowing direct comparison of the results.
2 The benchmarks used were SPEC MPI2007 version 1.1, the NSF acceptance test suite as found in NSF solicitation NSF 06-501, High Performance Computing System Acquisition: Towards a Petascale Computing Environment for Science and Engineering and HPCC version 1.3.1. The SPEC MPI2007 [1] benchmark consists of 13 codes, all specific instances of real applications. Running the benchmark produces a score derived from the run-times of the 13 component applications. This score is a ratio of execution time on the system under test and a “reference system”. The ratio is constructed such that larger numbers represent better performance. The geometric mean of the component scores is the overall score. A performance analysis of the suite has been previously published.[2] The original NSF acceptance test suite consisted of instances of six real applications from domain sciences approximating a workload typical of a research computing center[3]. In addition SPIOBENCH and HPCC were part of the suite. After its initial publication in 2006, two of the applications and SPIOBENCH were dropped, reducing the number to just four applications. NSF specifies and provides the exact version of the codes to be run and provides the data sets. HPCC [4] consists of seven components designed to measure specific aspects of system performance including floating point operations rate, memory and interprocess communication performance. The benchmark contains specific kernels that model tasks that are important for the performance of real applications. All benchmarks were run using two different operating systems: RedHat Enterprise Linux v5.4 (x86 64) and Windows HPC Server 2008 service pack 2.
2.
The Benchmarks
SPEC MPI2007 The SPEC MPI2007 benchmark was developed by the Standard Performance Evaluation Corporation (SPEC) High Performance Group (HPG). In contrast to HPCC and the NSF acceptance test suite, this benchmark has run rules and one can publish the results on the SPEC website. The results are reviewed by the SPEC HPG to guarantee compliance with the run rules and fair use of the benchmark. SPEC MPI2007 includes 13 technical computing applications from the fields of computational fluid dynamics, molecular dynamics, electromagnetism, geophysics, ray tracing, and hydrodynamics.
NSF Acceptance Test Suite The NSF requires in its TRACK program that certain codes can be run on machines purchased with NSF funding. The four applications are PARATEC,
Performance Comparison WinHPC and RHEL5
3
MILC, HOMME and WRF. The performance properties of this suite have been previously described.[5]
MILC. MILC is developed by the MIMD Lattice Computation (MILC) collaboration. It is used in the MILC research program to run large scale numerical simulations of quantum chromodynamics (QCD), the theory of the strong interactions of subatomic physics. The code is used for millions of node hours at DOE and NSF supercomputer centers. MPI functions MPI Isend, MPI Irecv, along with a variety of variations of MPI Bcast and MPI Allreduce are used. HOMME. (High Order Methods Modeling Environment[6]) is a framework developed at NCAR that provides the tools necessary to create a highperformance scalable global atmospheric model. It uses either Space-filling curves or METIS for partitioning the computational grid and has demonstrated scaling to 32K processors. PARATEC. [7] is a package designed primarily for a massively parallel computing platform and can run on serial machines. The code performs abinitio quantum-mechanical total energy calculations using pseudopotentials and a plane wave basis set. WRF. (Weather Research and Forecasting[8]) is a next-generation mesocale numerical weather prediction system designed to serve both operational forecasting and atmospheric research needs. The principal types of explicit communication include halo exchanges, periodic boundary updates, and parallel transposes. Most data is transferred using MPI Send/MPI Irecv calls, along with a number of broadcasts.
HPCC The High Performance Computing Challenge is a well known collection of benchmarks designed to measure specific aspects of system performance. It is maintained by the Innovative Computing Laboratory at the University of Tennessee. The HPCC components HPL, DGEMM and FFT measure floating point operation rate with various common mathematical operations. STREAM and RandomAccess measure memory performance. Finally, communication latency, bandwidth and overall performance of the interconnect network are measured by the remaining components of this suite, PTRANS, RandomRingLatency and RandomRing-Bandwidth.
4
Other Software All code was compiled using Intel v11.1-038 compilers and the Intel Math Kernel Libraries distributed with this release of the compiler. Identical optimization settings were used and the code was built in 64 bit on both platforms. For RHEL5 OpenMPI v1.3.1 was used, for WinHPC an MPI implementation is provided as part of the operating system. The infiniband fabric managers were OFED v1.4.1 (RHEL5) and WinOF v2.0.0 (WinHPC).
Hardware All tests were run on an IBM System x iDataPlex dx340 with 84 nodes. Each node had two Intel Xeon L5420 (2.5 GHz) quad core processors and 32 GB of memory (FBDIMM 8x4-GB, 667 MHz). The interconnect was DDR InfiniBand (IB). Each node had a Mellanox Technologies MT26418 IB card and was connected to a Cisco SFS 7024D switch. No more than 64 nodes were used for the tests presented here.
3.
SPEC MPI2007 results
Getting the SPEC MPI2007 benchmark suite to run under WinHPC presented a few challenges. The suite comes with a framework that enforces the run rules. The scripts and the tools of that framework run best when installed in a directory and path that does not contain special characters like spaces. Windows typically uses drive letters for addressing directories. On compute nodes it is common to address global directories via Uniform Naming Convention (UNC). However, SPEC MPI 2007 for Windows is not able to handle UNC directory paths, so global directories have to be mapped using the "net" or "mklink" command. Since the Intel compiler uses different notations for passing compile time arguments under Windows and LINUX it was required to patch the makefile to adjust for those differences. The stack size should be set to unlimited on all compute nodes of the cluster to avoid running out of memory during the benchmark. In a WinHPC environment, only the first compute node in a job, where the runspec script is executed, knows the correct working directory of the current SPEC benchmark. All other nodes only know the working directory of runspec. Since WinHPC provides no flag in the HPC job manager that enables an automatic transfer of environment settings it is necessary to build a MPI wrapper script, which parses the current benchmark information provided by runspec and broadcasts the environment settings via the msmpiexec command automatically. When using a network shared NTFS directory as the working directory for the SPEC MPI2007 benchmark, the FDS4 component will fail due to meta data
5
Performance Comparison WinHPC and RHEL5
SPECMPI2007 score
SPECMPI2007 score
30 25 WinHPC 20 RHEL5 15 10 5 0 32
64
128 256 Cores
512
Figure 1. SPEC MPI2007 score as a function of core count. The overall performance was equivalent for these operating systems.
50 45 WinHPC 40 RHEL5 35 30 25 20 15 10 5 0 32 64
128 256 Cores
512
Figure 2. SPEC MPI2007 score for tachyon as function of core count. The performance was equivalent for these operating systems.
SPECMPI2007 score
SPECMPI2007 score
60 10 WinHPC RHEL5 8 6 4 2 0
50 WinHPC 40 RHEL5 30 20 10 0
32
64
128 256 Cores
512
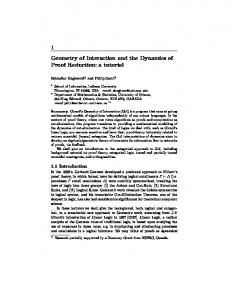
Figure 3. SPEC MPI2007 score for POP2 as function of core count. RHEL5 significantly outperforms WinHPC at 512 cores.
32
64
128 256 Cores
512
Figure 4. SPEC MPI2007 score for fds4 as a function of core count. RHEL5 significantly outperforms WinHPC at 512 cores.
handling of the filesystem. In FDS4, process 0 creates an input file and all other MPI processes have to check for the existence of this file before they begin the computation phase. The filesystem will not broadcast this file creation information fast enough, causing the other MPI ranks to abort. We have worked around this problem by creating an empty file before calling msmpiexec. Overall, for the SPEC MPI2007 benchmark suite WinHPC and RHEL5 scores were consistent to within 2% (See fig. 1 and tables 1 - 3 ). This is due to using the geometric mean to aggregate the scores of the individual applications. When evaluating the performance of the components, some applications showed significant differences between the two operating systems, others performed identically. Tachyon, for example showed no significant change in performance between the two operating systems (See fig. 2). MILC, LAMMPS and TERA TF also show no difference between WinHPC and RHEL5.
45 40 WinHPC 35 RHEL5 30 25 20 15 10 5 0 32 64
SPECMPI2007 score
SPECMPI2007 score
6
128 256 Cores
512
SPECMPI2007 score
SPECMPI2007 score
30 25 WinHPC 20 RHEL5 15 10 5 0 64
128 256 Cores
Figure 7. SPEC MPI2007 score for leslie3d as a function of core count. WinHPC significantly outperforms RHEL5 above 64 cores.
128 256 Cores
512
Figure 6. SPEC MPI2007 score for Socorro as a function of core count. RHEL5 significantly outperforms WinHPC at 256 and 512 cores.
Figure 5. SPEC MPI2007 score for GAPgeofm as a function of core count. RHEL5 significantly outperforms WinHPC at 512 cores.
32
22 20 WinHPC 18 RHEL5 16 14 12 10 8 6 4 2 0 32 64
512
55 50 WinHPC 45 RHEL5 40 35 30 25 20 15 10 5 0 32 64
128 256 Cores
512
Figure 8. SPEC MPI2007 score for WRF as a function of core count. WinHPC significantly outperforms RHEL5 above 64 cores.
RHEL5 significantly outperformed WinHPC at all core counts in the POP2 benchmark (fig. 3). In three other applications, RHEL5 significantly outperforms WinHPC in larger core counts, FDS4 (fig. 4), GAPGEOFM (fig. 5) and SOCORRO (fig. 6). FDS4 and GAPGEOFM gave WinHPC performance results similar to RHEL5 up to 256 cores with a sudden decrease in performance at 512 cores. SOCORRO failed to scale as well as RHEL5 under WinHPC above 128 cores but was comparable at 128 cores and below. At all core counts, WinHPC significantly outperformed RHEL5 in the LESLIE3D (fig. 7) and WRF (fig. 8) benchmarks.
7
Performance Comparison WinHPC and RHEL5
Tables 1 - 3 show the detailed performance data from running SPEC MPI2007 on 32, 64, 128, 256 and 512 cores. The SPEC framework will execute each component three times and calculate the median time of the three runs. This time is used to calculate the score. The tables show the median runtime and the score for each core count separately for WinHPC and RHEL5. Table 1.
SPEC MPI2007 results at 32 and 64 cores 32 cores WinHPC
Component
RHEL5
64 cores WinHPC RHEL5
Median Score Median Score Median Score Median Score Time Time Time Time 104.milc 1165.3 1.34 1166.0 1.34 559.3 2.8 559.3 2.80 107.leslie3d 2346.3 2.22 2468.5 2.11 1228.3 4.25 1342.4 3.89 113.GemsFDTD 1871.2 3.37 1890.0 3.34 1001.7 6.30 1052.8 5.99 115.fds4 1024.5 1.90 1033.3 1.89 503.3 3.88 502.8 3.88 121.pop2 1065.0 3.88 1032.1 4.00 766.3 5.39 658.4 6.27 122.tachyon 831.8 3.36 818.1 3.42 414.1 6.75 411.8 6.79 126.lammps 1075.9 2.71 1077.6 2.70 540.0 5.40 531.0 5.49 127.wrf2 1899.3 4.10 2041.1 3.82 970.3 8.03 1055.3 7.39 128.GAPgeofem 892.9 2.31 867.1 2.38 452.3 4.57 426.9 4.84 129.tera tf 733.2 3.77 718.4 3.85 401.1 6.90 384.2 7.20 130.socorro 2258.8 1.69 2228.1 1.71 929.2 4.11 911.2 4.19 132.zeusmp2 1040.9 2.98 1052.8 2.95 519.0 5.98 525.2 5.91 137.lu 2070.3 1.78 2105.8 1.75 443.0 8.30 502.4 7.32 Total 2.57 2.56 5.35 5.32
8 Table 2.
SPEC MPI2007 results at 128 and 256 cores 128 cores WinHPC RHEL5
Component
Median Time 104.milc 278.1 107.leslie3d 645.9 113.GemsFDTD 545.2 115.fds4 221.0 121.pop2 697.3 122.tachyon 209.8 126.lammps 283.5 127.wrf2 451.6 128.GAPgeofem 235.3 129.tera tf 226.7 130.socorro 280.2 132.zeusmp2 279.1 137.lu 238.9 Total
Table 3.
Score Median Time 5.63 281.9 8.08 741.0 11.57 581.8 8.83 218.8 5.92 616.5 13.33 209.3 10.28 264.4 17.26 536.0 8.77 211.8 12.21 225.2 13.62 274.6 11.11 282.7 15.38 235.7 10.38
256 cores WinHPC RHEL5
Score Median Time 5.55 140.7 7.04 344.0 10.84 511.1 8.91 71.2 6.70 546.7 13.36 109.1 11.02 235.1 14.54 244.9 9.75 88.0 12.29 123.7 13.90 255.3 10.97 142.1 15.59 129.0 10.34
Score Median Time 11.12 143.1 15.17 425.8 12.34 535.2 27.38 65.7 7.55 418.8 25.62 108.4 12.40 236.0 31.83 347.8 23.46 80.5 22.36 126.4 14.95 194.1 21.83 143.7 28.48 126.1 18.03
SPEC MPI2007 results at 512 cores WinHPC Component 104.milc 107.leslie3d 113.GemsFDTD 115.fds4 121.pop2 122.tachyon 126.lammps 127.wrf2 128.GAPgeofem 129.tera tf 130.socorro 132.zeusmp2 137.lu Total
Median Time 62.6 193.5 610.0 52.6 466.9 58.3 235.3 145.8 61.5 84.9 304.6 70.2 74.5
Score 24.96 26.98 10.34 37.08 8.84 47.98 12.38 53.47 33.55 32.59 12.53 44.18 49.33 25.73
RHEL5 Median Time 67.8 273.0 639.9 34.1 381.9 59.6 238.3 245.6 46.5 86.1 178.0 74.1 75.4
Score 23.08 19.12 9.86 57.17 10.81 46.90 12.23 31.74 44.4 32.15 21.44 41.83 48.70 26.42
Score 10.93 12.26 11.79 29.66 9.86 25.80 12.35 22.41 25.64 21.89 19.66 21.58 29.15 18.13
9
Performance Comparison WinHPC and RHEL5
All results used here were reviewed by the SPEC High Performance Group and published using the SPEC website[9]. The website allows for comparing those results with results from other institutions and vendors.
4.
NSF suite results
The NSF acceptance test suite consists of 4 application, PARATEC, MILC, HOMME and WRF. We were unable to build the NSF provided version of WRF on WinHPC. While there are patches available to build a current version of WRF on WinHPC, those patches do not work with the NSF provided code base. Since WRF is also part of the SPEC MPI2007 benchmark, those numbers can be used to access the performance of WRF. However, since the version and data set of WRF in SPEC MPI2007 is different, the results are not shown here but can be found in the tables 1 - 3. The results of the NSF test suite were consistent between the two operating systems tested. No trend favoring one over the other was observed. For the medium data set for MILC, at the largest core counts, there may be evidence that startup-time is smaller for WinHPC but this has not been investigated in detail. PARATEC performs better on RHEL5 than WinHPC but we were unable to demonstrate stable behavior on either operating system above 128 cores using the NSF provided code base and test data. This behavior leads us to question the reproducibility of the PARATEC result and only results for 32 and 64 cores are shown here.
Table 4.
NSF Benchmark suite results Component Milc-medium Milc-medium Milc-medium Milc-medium Milc-large Milc-large Milc-large Paratec Paratec Homme Homme Homme
Cores
WinHPC Time (sec)
RHEL5 Time (sec)
64 128 256 512 128 256 512 32 64 128 256 512
586 244 82 30 8150 4178 2119 955 698 59843 30828 15700
584 265 88 27 8340 4159 2139 901 564 61083 31189 15671
10
5.
HPCC results
The HPCC components can be grouped into three parts. Components that stress the floating point performance of the system are shown in table 5. The performance of the memory subsystem is measured by STREAM and by RandomAccess. The results are shown in table 6. Table 7 shows the results for global PTRANS and the RandomRing Bandwidth and Latency tests. The floating point performance of the system is almost the same under both operating systems. The first part of table 5 shows the performance of HPL, the percentage of peak performance is given in parenthesis. The average performance is a bit higher using WinHPC, the variance is smaller using RHEL5. WinHPC has a problem running HPL on 256 cores. Measurements were repeated multiple times, but always yielded a number close to what is shown in the table. The embarrassingly parallel run of DGEMM shows basically no difference between WinHPC and RHEL5. The third part of table 5 shows the results for the global FFTE. Again, the results are very similar, but the 256 core result for WinHPC sticks out. It is unclear what is causing this behavior. Table 6 shows results for global RandomAccess and global and embarrassingly parallel STREAM. The results of STREAM are almost identical on both operating systems, with a very small advantage for RHEL5. The RandomAccess benchmark shows an interesting behavior. The results for WinHPC start out slower than the results for RHEL5 but climb to 0.135 Gup/s. In contrast, RHEL5 starts out faster than WinHPC but only reaches 0.055 Gup/s. HPCC components that stress the interconnect are shown in table 7. The results for global PTRANS are very similar between WinHPC and RHEL5, with a small advantage for RHEL5 especially in the larger core counts. RandomRing Latency and Bandwidth show a very interesting behavior. For the bandwidth part, WinHPC has an advantage when running within a single node, 8 cores. When scaling to more nodes, RHEL5 shows better performance. The latency test shows the opposite. For small core counts, the latency is smaller on RHEL 5, but when scaling to 256 and 512 cores, the latency on WinHPC is smaller.
6.
Related Work
There has been a lot of efforts in the past to study the performance of high performance computing systems. Detailed studies are often limited to a specific component, like I/O[10], MPI[11], compilers[12, 13], or memory bandwidth[14]. Often the performance of a single system is studied using different applications or benchmarks[15]. Other work includes the comparison of different architectures, often using Microbenchmarks[16, 17]. There also has been comparison between the Linux and Windows operating systems, e.g. to study web server performance on the two systems. The approach taken here is to
11
Performance Comparison WinHPC and RHEL5
Table 5. Cores
HPCC components measuring floating point performance G-HPL (TFLOPS) EP-DGEMM (GFLOPS) G-FFTE (GFLOPS) WinHPC RHEL5 WinHPC RHEL5 WinHPC RHEL5 0.070 (87.6%) 0.069 (86.0%) 9.385 9.378 1.478 1.348 0.139 (86.8%) 0.135 (84.3%) 9.388 9.322 2.495 2.876 0.283 (88.3%) 0.267 (86.2%) 9.419 9.348 4.376 5.068 0.560 (87.4%) 0.551 (86.0%) 9.421 9.288 8.164 9.757 1.126 (88.0%) 1.110 (86.7%) 9.424 9.297 16.002 19.787 2.054 (80.2%) 2.195 (85.7%) 9.425 9.315 16.101 32.218 4.486 (87.6%) 4.430 (86.5%) 9.427 9.293 54.000 52.186
8 16 32 64 128 256 512
Table 6.
HPCC components measuring memory performance
Cores G-Ran. Access (Gup/s) WinHPC RHEL5 8 0.013 0.022 0.022 0.033 16 32 0.042 0.056 64 0.078 0.056 128 0.133 0.053 0.132 0.052 256 512 0.138 0.050
Table 7.
G-STREAM (GB/s) EP-STREAM (GB/s) WinHPC RHEL5 WinHPC RHEL5 5.494 5.499 0.687 0.687 10.957 11.047 0.685 0.690 21.917 22.147 0.685 0.692 43.790 44.056 0.684 0.688 87.869 88.352 0.686 0.690 175.603 176.502 0.686 0.689 351.618 353.743 0.687 0.691
HPCC components measuring interconnect performance Cores 8 16 32 64 128 256 512
G-PTRANS (GB/s) RR-Bandwidth (GB/s) WinHPC RHEL5 WinHPC RHEL5 0.825 0.682 0.331 0.192 1.481 1.534 0.198 0.266 1.952 2.713 0.104 0.185 3.428 4.248 0.090 0.145 6.618 8.075 0.078 0.123 12.338 13.858 0.073 0.093 23.558 24.965 0.066 0.078
RR-Latency (µs) WinHPC RHEL5 1.680 1.127 3.920 1.711 7.397 3.183 9.627 6.133 11.104 8.127 12.236 13.681 13.154 16.540
12 compare the two software environments provided by Windows HPC Server 2008 and RedHat Enterprise Linux on an identical hardware platform. By choosing the NSF and SPEC benchmarks we cover a wide range of applications relevant for HPC. With this paper we are the first to publish SPEC MPI2007 results on Windows and comparing them to the results under Linux on identical hardware[9].
7.
Conclusion
The SPEC MPI2007, NSF acceptance test and the HPCC benchmarks were run on the identical hardware using Windows HPC Server 2008 and RedHat Enterprise Linux 5. Using the applications benchmarks SPEC MPI2007 and the NSF acceptance test suite we found the overall performance of both systems to be almost identical. However, when analyzing the details, significant performance differences became visible. In the SPEC suite, we observed that some applications stop scaling when run on WinHPC using 256 or 512 cores. In contrast, the performance on lower core counts is identical between WinHPC and RHEL5. In addition, we found that building and running the benchmark suites on WinHPC was more challenging than on RHEL5.
8.
Acknowledgment
This document was developed with support from the National Science Foundation (NSF) under Grant No. 0910812 to Indiana University for ”FutureGrid: An Experimental, High-Performance Grid Test-bed.” Any opinions, findings, and conclusions or recommendations expressed in this material are those of the author(s) and do not necessarily reflect the views of the NSF.
References [1] Matthias S. Mueller, Matthijs van Waveren, Ron Lieberman, Brian Whitney, Hideki Saito, Kalyan Kumaran, John Baron, William C. Brantley, Chris Parrott, Tom Elken, Huiyu Feng, Carl Ponder: SPEC MPI2007 - an application benchmark suite for parallel systems using MPI Concurrency and Computation: Practice and Experience, Volume 22, Issue 2, Date: February 2010, Pages: 191-205 [2] Szebenyi, Zolt«an ,Wylie, Bryan J. N. and Wolf, Felix. SCALASCA Parallel Performance Analyses of SPEC MPI2007 Applications, Lecture Notes in Computer Science, Performance Evaluation: Metrics, Models and Benchmarks. Springer Berlin / Heidelberg, 2008, pp 99 - 123 [3] Benchmarking Information Referenced in the NSF 05-625 High Performance Computing System Acquisition: Towards a Petascale Computing Environment for Science and Engineering . National Science Foundation (NSF), http://www.nsf.gov/pubs/2006/nsf0605/nsf0605.jsp [4] Dongarra, J.,Luszczek, P.: Introduction to the HPCChallenge Benchmark Suite. ICL Technical Report ICL-UT-05-01, 2005. http://icl.cs.utk.edu/hpcc
Performance Comparison WinHPC and RHEL5
13
[5] Atoohi, R.: Performance evaluation of NSF application benchmarks on parallel systems. Proceedings of IEEE International Symposium on Parallel and Distributed Processing, 2008. pp 1 - 8 [6] HOMME: High-Order Methods Modeling Environment. National Center for Atmospheric Research (NCAR), http://www.homme.ucar.edu/ [10 March 2009]. [7] PARATEC: PARAllel Total Energy Code. National Energy Research Scientific Computing Center (NERSC), http://www.nersc.gov/projects/paratec [8] Michalakes, J., J. Dudhia, D. Gill, T. Henderson, J. Klemp, W. Skamarock, and W. Wang: The Weather Research and Forecast Model: Software Architecture and Performance. Proceedings of the Eleventh ECMWF Workshop on the Use of High Performance Computing in Meteorology. Eds. Walter Zwieflhofer and George Mozdzynski. World Scientific, 2005, pp 156 - 168 [9] SPEC MPI2007 results for quarter I 2010. Standard Performance Evaluation Corporation (SPEC), http://www.spec.org/mpi2007/results/res2010q1/ [10] Peter M. Chen and David A. Patterson. A new approach to i/o performance evaluation self-scaling i/o benchmarks, predicted i/o performance. In Proceedings of the 1993 ACM SIGMETRICS Conference on Measurement and Modeling of Computer Systems. ACM, May 1993. best paper award. [11] Michael M. Resch, Holger Berger, and Thomas Boenisch. A comparison of MPI performance on different MPPs. In Marian Bubak, Jack J. Dongarra, and Jerzy Wasniewski, editors, Recent Advances in Parallel Virtual Machine and Message Passing Interface, Lecture Notes in Computer Science, pages 75–83, Heidelberg, 1997. Springer. [12] Kazuhiro Kusano, Shigehisa Satoh, and Mitsuhisa Sato. Performance evaluation of the omni OpenMP compiler. In WOMPEI 2000, Tokyo, Japan, 2000. [13] Matthias S. Mueller. An OpenMP compiler benchmark. Scientific Programming, 11(2):125–132, 2003. [14] John D. McCalpin. Memory bandwidth and machine balance in current high performance computers. IEEE TCCA, 1995. http://www.cs.virginia.edu/stream. [15] Daisuke Takahashi, Mitsuhisa Sato, and Taisuke Boku. Performance evaluation of the hitachi sr8000 using OpenMP benchmarks. In Hans P. Zima, Kazuki Joe, Mutsuhisa Sata, Yoshiki Seo, and Masaaki Shimasaki, editors, High Performance Computing, 4th International Symposium, ISHPC 2002, volume 2327 of Lecture Notes in Computer Science, pages 390–400. Springer, 2002. [16] S. Saini, Robert Ciotti, Brian T. N. Gunney, Thomas E. Spelce, Alice Koniges, Don Dossa, Panagiotis Adamidis, Rolf Rabenseifner, Sunil R. Tiyyagura, Matthias S. Mueller, and R. Fatoohi. Performance evaluation of supercomputers using hpcc and imb benchmarks. In Proceedings of the IPDPS 2006 Conference, the 20th IEEE International Parallel & Distributed Processing Symposium, Workshop on Performance Modeling, Evaluation, and Optimization of Parallel and Distributed Systems, 2006. [17] Hideki Saito, Greg Gaertner, Wesley B. Jones, Rudolf Eigenmann, Hidetoshi Iwashita, Ron Liebermann, Matthijs van Waveren, and Brian Whitney. Large system performance of SPEC OMP2001 benchmarks. In Hans P. Zima, Kazuki Joe, Mutsuhisa Sata, Yoshiki Seo, and Masaaki Shimasaki, editors, High Performance Computing, 4th International Symposium, ISHPC 2002, volume 2327 of Lecture Notes in Computer Science, pages 370–379. Springer, 2002.