entropy Article
A Permutation Disalignment Index-Based Complex Network Approach to Evaluate Longitudinal Changes in Brain-Electrical Connectivity Nadia Mammone 1, * ID , Simona De Salvo 1 , Cosimo Ieracitano 2 , Silvia Marino 1 , Angela Marra 1 , Francesco Corallo 1 and Francesco C. Morabito 2 1 2
*
IRCCS Centro Neurolesi Bonino-Pulejo, 98124 Messina, Italy;
[email protected] (S.D.S.);
[email protected] (S.M.);
[email protected] (A.M.);
[email protected] (F.C.) DICEAM Department, Mediterranea University of Reggio Calabria, 89124 Reggio Calabria, Italy;
[email protected] (C.I.);
[email protected] (F.C.M.) Correspondence:
[email protected] or
[email protected]; Tel.: +39-090-60128112
Received: 26 September 2017; Accepted: 13 October 2017; Published: 17 October 2017
Abstract: In the study of neurological disorders, Electroencephalographic (EEG) signal processing can provide valuable information because abnormalities in the interaction between neuron circuits may reflect on macroscopic abnormalities in the electrical potentials that can be detected on the scalp. A Mild Cognitive Impairment (MCI) condition, when caused by a disorder degenerating into dementia, affects the brain connectivity. Motivated by the promising results achieved through the recently developed descriptor of coupling strength between EEG signals, the Permutation Disalignment Index (PDI), the present paper introduces a novel PDI-based complex network model to evaluate the longitudinal variations in brain-electrical connectivity. A group of 33 amnestic MCI subjects was enrolled and followed-up with over four months. The results were compared to MoCA (Montreal Cognitive Assessment) tests, which scores the cognitive abilities of the patient. A significant negative correlation could be observed between MoCA variation and the characteristic path length (λ) variation (r = −0.56, p = 0.0006), whereas a significant positive correlation could be observed between MoCA variation and the variation of clustering coefficient (CC, r = 0.58, p = 0.0004), global efficiency (GE, r = 0.57, p = 0.0005) and small worldness (SW, r = 0.57, p = 0.0005). Cognitive decline thus seems to reflect an underlying cortical “disconnection” phenomenon: worsened subjects indeed showed an increased λ and decreased CC, GE and SW. The PDI-based connectivity model, proposed in the present work, could be a novel tool for the objective quantification of longitudinal brain-electrical connectivity changes in MCI subjects. Keywords: EEG; Mild Cognitive Impairment; Permutation Entropy; Permutation Disalignment Index; brain electrical connectivity; complex network; graph analysis
1. Introduction Electroencephalography (EEG) is the main tool for monitoring brain electrical activity [1]. In the study of neurological pathologies, EEG analysis can provide valuable information as abnormalities in interaction between neurons may reflect on macroscopic abnormalities in electrical potentials that can be detected on the scalp [2]. The EEG can exhibit different types of abnormalities, depending on the neurophysiological deficits caused by the disease. Mild Cognitive Impairment (MCI) is a condition that may be transient, stable or progressive (if it is the prodromal symptom of a degenerative pathology that leads to dementia [3,4]). MCI can be amnestic (aMCI) and non-amnestic [5], aMCI subjects are more likely to develop dementia due to Alzheimer’s Disease (AD) [6]. MCI subjects should be monitored periodically, through specific follow-up programs, so that any necessary therapy can be undertaken Entropy 2017, 19, 548; doi:10.3390/e19100548
www.mdpi.com/journal/entropy
Entropy 2017, 19, 548
2 of 15
as soon as the patient shows clear signs of progression towards dementia [7]; to this purpose, home patient care could help dramatically [8]. It is still very difficult to make a diagnosis of MCI that degenerates into dementia, both because it is very difficult to keep MCI subjects actively involved in the follow-up program and because the currently available diagnostic tools are subjective and based on the medical history of the patient and on the administration of cognitive tests such as Montreal Cognitive Assessment (MoCA) [9]. Another diagnostic tool is Magnetic Resonance Imaging (MRI) [7]; however, many patients badly tolerate it and refuse to undergo it [10], except the first scanning that is mainly performed to rule out the presence of lesions or other causes of MCI. An EEG-based diagnostic tool would be particularly suitable for this purpose since it is well tolerated, low-cost and widespread. The EEG provided promising results in MCI EEG analysis [7,11,12]. MCI condition prodromal to dementia is usually characterized by increased power at low frequencies, decreased power at high frequencies (slowing), complexity reduction and decreased synchronization between the different areas of the brain [2,7,13,14]. Moretti et al. found a link between MCI prodromal to AD and a deficit of the temporoparietal cortex as well as a link between shrinkage of the temporoparietal zone and increased alpha3/alpha2 EEG power ratio [15]. Babiloni et al., by applying LORETA to resting eyes-closed EEG recorded from MCI and AD patients, found that the progressive atrophy of hippocampus looks correlated with decreased cortical alpha power [16]. Stam et al. [17] observed that synchronization likelihood (SL) significantly decreased in the 14–18 and 18–22 Hz bands in AD patients compared with both MCI patients and subjects with subjective memory complaints (SC). Ahmadou and Adeli [18] introduced an enhanced probabilistic neural network classifier to discriminate between MCI and healthy subjects (98.4% accuracy). MCI condition, whenever it is the early symptom of a pathology that degenerates into dementia, appears associated with a progressive reduction in functional connectivity due to neuronal death [2,7,13,19,20]. An EEG-based model that quantifies brain electrical connectivity should be able to indirectly measure such changes. Vecchio et al. [21] found a high statistical correlation between Small Worldness and memory performance by investigating how resting-state networks correlate with memory in AD and MCI patients. Ahmadlou et al. [20] investigated the complexity of functional connectivity networks in MCI patients during a working memory task using magnetoencephalography (MEG) signals. However, MEG is an expensive and therefore not common technique. Unfortunately, the aforementioned studies are all cross-sectional and did not investigate the longitudinal evolution of the disease. As regards longitudinal studies on MCI or AD, Morabito et al. evaluated the longitudinal progression of AD with a complex network approach. AD patients worsening looked associated with increased characteristic path length and reduced efficiency [22]. Buscema et al. [23] introduced a methodology, IFAST (implicit function as squashing time), based on special types of artificial neural networks (ANNs). The IFAST method could predict the conversion from amnestic MCI to AD with a 85.98% accuracy in a one-year follow-up study. This methodology was later improved [24] but only tested in a cross-sectional study. Motivated by the encouraging results provided by the Permutation Disalignment Index (PDI), a novel descriptor, recently proposed by the authors for the longitudinal evaluation of changes in the coupling strength between the EEG signals, was successfully applied to MCI and AD patients [25], and the present paper illustrates the construction of a complex network model, based on the PDI estimated between pairs of EEG signals, for quantifying longitudinal brain-electrical connectivity variations associated with cognitive decline. The aim is to test the hypothesis that longitudinal cognitive decline in MCI is associated with reduced efficiency of brain-electrical network organization. In particular, the method consists of: recording the EEG, estimating the PDI between every pair of EEG signals, constructing a dissimilarity matrix based on PDI between EEG electrodes, estimating the characteristic path length, the average clustering coefficient, the global efficiency and the eccentricity of every node of the network. Such network parameters indeed quantify the efficiency of network organization [26,27]. To test the proposed complex network model, 33 amnestic MCI patients were recruited and longitudinally evaluated at a baseline time (T0) and four months later (T1).
Entropy 2017, 19, 548
3 of 15
The method was applied at either EEG (T0) and EEG (T1), and then the complex network model was applied to estimate the longitudinal changes in brain-electrical connectivity from T0 to T1. The correlation between such changes and MoCA scores was investigated. The paper is organized as follows: Section 2 describes how the patients were enrolled and evaluated. Section 3 illustrates how the EEGs were recorded and preprocessed through the proposed model. Section 4 discusses the achieved results and Section 5 addresses the conclusions. 2. Materials: Study Population A cohort of 33 amnestic MCI subjects was enrolled at the IRCCS Centro Neurolesi Bonino-Pulejo of Messina (Italy). A team of neurologists, EEG experts and neuropsychologists, recruited the subjects and carried out all the examinations. Every subject was evaluated at time T0 (baseline) and then at time T1 four months later. The study was conducted in accordance with the Declaration of Helsinki, following a clinical protocol specifically approved by the local Ethics Committee of the IRCCS Centro Neurolesi Bonino-Pulejo (Prot. E29/16). The inclusion criteria was diagnosis of MCI, according to the guidelines of the Diagnostic and Statistical Manual of Mental Disorders (fifth edition, DSM-5) [28]. The Exclusion criteria were: evidence of other neurological or psychiatric diseases leading to cognitive impairment; uncontrolled or complex systemic diseases; traumatic brain injuries; EEG epileptiform activity; and use of any psychoactive medication. The purpose, the procedure, the risks and the benefits of the present research were illustrated in detail to the patients and their caregivers, who signed an informed consent form. At time T0, every patient underwent a neuroradiological examination, in order to rule out any other possible pathological conditions (stroke, traumatic brain injury, hydrocephalus, or other neurological conditions). Besides a complete clinical evaluation, the patients were administered the MoCA test. MoCA is a routine cognitive screening test, rated on a 30-point scale, which takes approximately 10 to 12 min. MoCA examines orientation, word recall, attention, calculation, language and visuospatial abilities. It includes tasks such as a clock-drawing test and a trail test. MoCA also assesses executive function, higher-level language, and complex visuospatial processing and allows for detecting MCI with less ceiling effect than MMSE [9]. The demographic characteristics of the examined subjects are summarized in Table 1, together with their MoCA variation from time T0 to time T1. Table 1. Demographics. Pt ID
GENDER
AGE
MoCA Variation
Pt 3 Pt 23 Pt 30 Pt 32 Pt 41 Pt 51 Pt 71 Pt 72 Pt 127 Pt 128 Pt 129 Pt 131 Pt 132 Pt 137 Pt 143 Pt 144 Pt 146 Pt 147 Pt 150 Pt 153 Pt 155 Pt 156 Pt 157 Pt 162 Pt 164 Pt 167 Pt 173 Pt 178 Pt 180 Pt 184 Pt 185 Pt 186 Pt 193
M F M M M F F F M F M F F F F M F M F M F F M M M M F M F F F M F
68.00 84.00 78.00 78.00 78.00 72.00 79.00 65.00 74.00 80.00 78.00 78.00 73.00 69.00 78.00 71.00 56.00 78.00 58.00 75.00 75.00 70.00 79.00 71.00 76.00 75.00 70.00 71.00 78.00 69.00 79.00 72.00 67.00
−2.00 0.00 0.00 −7.00 −6.00 −4.00 −3.00 0.00 0.00 0.00 0.00 −2.00 0.00 0.00 5.00 0.00 −1.00 0.00 0.00 0.00 0.00 −1.00 0.00 0.00 −2.00 0.00 0.00 −2.00 −3.00 −2.00 −3.00 0.00 0.00
Entropy 2017, 19, 548
4 of 15
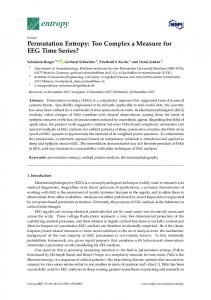
3. Methodology: PDI-Based EEG Complex Network Analysis The flowchart of the proposed methodology is concisely illustrated in Figure 1. The first step consists of recording the EEG and storing it on a computer. The EEG is then analysed offline. It is partitioned into M non-overlapping epochs (the width of each epoch is 5 s) and then analysed epoch by epoch [25]. For every epoch e, the corresponding EEG segment EEG e (with e = 1, . . . , M) is split into delta, theta, alpha and beta rhythms. For every frequency range under analysis (0.5–32 Hz total range, delta, theta, alpha and beta rhythms), the PDIxi ,x j (e) between every pair of EEG signals xi and x j is estimated. In the proposed complex network model, each node of the network is associated with an EEG electrode. The weight between nodes xi and x j is the PDIxi ,x j (e) between the EEG signals recorded at electrodes xi and x j . Each block depicted in Figure 1 will be described in detail in the corresponding subsection, following the same numbering. All the algorithms were implemented in MATLAB R2016a (The MathWorks, Inc., Natick, MA, USA) exploiting some functions included in the Brain Connectivity Toolbox [27]. (1) EEG recording at time Ti (T0 or T1)
(3) Projecting the EEG signals into symbols (in every sub-band)
(2) EEG sub-bands extraction
Possible Motifs with m=3
MOTIF π4
δ
MOTIF
π1
MOTIF
π2
MOTIF
π3
MOTIF
π4
MOTIF
π5
MOTIF
π6
θ 𝜶 𝜷 MOTIF π1 δ θ 𝜶
t
𝜷
t+L t+2L Move to the next time point “t” and reiterate the procedure
(7) Brain-electrical connectivity mapping
Time T0
(6) Complex network analysis
(4) Motifs' occurrence rate estimation
(5) PDI-based connection model
Time T1
Xi
PDI(Xi,Xj)
MOTIF
MOTIF
MOTIF
MOTIF
MOTIF
MOTIF
π1
π2
π3
π4
π5
π6
MOTIF
MOTIF
MOTIF
MOTIF
MOTIF
MOTIF
π1
π2
π3
π4
π5
π6
Xj π1,π π1,π π1,π π1,π π1,π π1,π 1
2
3
4
5
6
…...............................
π5,π π6,π 6
6
Figure 1. The first step consists of recording the EEG (both at time T0 and T1) and storing it on a computer. The EEG is segmented into M non-overlapping epochs and then it is analysed epoch by epoch. For every epoch e, given the corresponding EEG segment EEG e (with e = 1, . . . , M), delta, theta, alpha and beta EEG rhythms (sub-bands) are extracted. Every rhythm is processed independently. For every epoch e and every rhythm, every pair of channels xi and x j is processed and the corresponding PDIxi ,x j (e) is estimated. A dissimilarity matrix is then constructed where the dissimilarity between xi and x j is PDIxi ,x j (e), which is inversely proportional to the coupling strength between xi and x j . The dissimilarity matrices are then averaged over the epochs and the complex network parameters are extracted from the average dissimilarity matrix. In this way, the connectivity of the EEG (either at T0 and T1) is described by the network parameters. By comparing the network parameters at T0 and at T1, changes in the network organization can be estimated.
3.1. EEG Recording The EEG acquisition took place in the morning. Before the session started, the subjects and their caregivers provided all the necessary information about the sleep quality in the past night as well as a description of the last meal. During the EEG recording, the subjects sat comfortably on a chair, kept their eyes closed but did not sleep, as confirmed by the EEG experts who checked the EEG traces in real time during the acquisition, in order to detect possible patterns of drowsiness. They also marked in
Entropy 2017, 19, 548
5 of 15
real time all the artifactual epochs that were excluded by the analysis. Nineteen standard EEG channels were used, according to the following montage: Fp1, Fp2, F3, F4, C3, C4, P3, P4, O1, O2, F7, F8, T3, T4, T5, T6, Fz, Cz and Pz, with linked earlobe (A1–A2) reference. The sampling rate was set at 256 Hz and a notch filter at 50 Hz was applied. The average length of the EEG recordings, after artifactual segments cancellation, was 6.1 min. The length of every epoch was 5 s. 3.2. EEG Sub-Band Extraction Every epoch EEG e was band-pass filtered at 0.5–32 Hz. Every EEG signal within epoch e was further band-pass filtered to extract the delta (0.5–4 Hz), theta (4–8 Hz), alpha (8–13 Hz), and beta (13–32 Hz) rhythms, which are of particular interest when analysing the EEG of MCI subjects [29]. The filters were implemented through the function eegfiltfft of the open source toolbox EEGLab (version 13-4-4b, Swartz Center for Computational Neuroscience, San Diego, CA, USA) [30,31]. Subplot (2) in Figure 1 shows an example of how the delta, theta, alpha and beta rhythms look. 3.3. Projecting the EEG Signals into Symbols This paper introduces a complex network approach based on PDI, a symbolic descriptor of the coupling strength between time series, recently proposed by the authors [25] to track changes in the coupling strength between EEG signals due to cognitive decline in MCI subjects. PDI is a novel measure that comes from the definition of Permutation Entropy (PE) [32]. PE is a univariate descriptor that can only describe the randomness of a single time series (i.e., an EEG signal) and cannot quantify the coupling strength between two or more time series (i.e., between two or more EEG signals). PDI is a multivariate descriptor, inversely proportional to the coupling strength between time series. With application to EEG signals, PDI can be interpreted as an indirect measure of the coupling strength between two or more cortical areas, estimated through the quantification of the disalignment randomness between the projections of the corresponding EEG times series into the “motifs” space. PDI is indeed based on the projection of EEG time series into a predetermined set of symbols called motifs. Given two time series xi and x j (the signals recorded at two EEG channels), and given the embedding dimension m and the lag L, starting from a time point t, time series xi can be projected into the vector Xi (t) (Equation (1)): Xi (t) = [ xi (t), xi (t + L), ..., xi (t + (m − 1) L)] T .
(1)
For example, if m = 3, Xi (t) is a vector with three elements, xi (t), xi (t + L), xi (t + 2L). When m = 3, six different ordinal patterns (motifs) are possible and, at each iteration, three samples of the time series are selected and compared to each other in order to assess which of them is relatively low, which is medium and which is high, regardless of the specific amplitude, and therefore which one of the six possible motifs occurred. At every iteration t, the algorithm projects the two time series xi and x j into the two corresponding motifs and checks if the same motif occurred in both of them. In the present paper, the adopted parameter setting is m = 3 and L = 1, as discussed in [25]. 3.4. Motif Occurrence Rate Estimation The procedure is reiterated for every time point t and, in this way, a final simultaneous occurrence rate p Xi ,X j (πk ) of every motif πk in xi and x j can be calculated. Once the occurrence rate p Xi ,X j (πk ) of every motif k has been computed, the PDI between xi and x j can be estimated as: " # m! 1 PDI ( Xi , X j ) = log ∑ p Xi ,X j (πk )α . (2) 1−α k =1 The PDI between xi and x j was shown to decrease as the coupling strength between xi and x j increases because xi and x j are expected to exhibit the same motifs with increased probability [25]. PDI was defined in [25] according to Renyi’s theory [33] and the parameter α tunes the sensitivity to the
Entropy 2017, 19, 548
6 of 15
Gaussianity of the pdf distribution of the time series. Average al pha values (α = 2) are either sensitive to sub-Gaussian and super-Gaussian distributions [34] and were adopted in the present work. 3.5. PDI-Based Connection Model Summarizing, given a step Tk in the follow-up program (T0 or T1) and the corresponding EEG recording EEG ( Tk ), for every analyzed epoch EEG e ( Tk ) and for every pair of electrodes ( xi , x j ), a PDIxe i ,x j ( Tk ) value is estimated and it becomes the (i, j) element of the dissimilarity matrix PDIe ( Tk ) of the complex network model at epoch e. This is done for every frequency range under consideration (0.5–32Hz full range, delta, theta, alpha and beta rhythms). In the end of the analysis, a sequence of dissimilarity matrices will be estimated: PDI1 ( Tk ), PDI2 ( Tk ), ..., PDIe ( Tk ), ..., PDI M ( Tk ), each one associated with an epoch. They will be all normalized by the maximum dissimilarity value of the entire sequence, so that the PDI values fall in the range 0–1. The analysis of the entire sequence of dissimilarity matrices PDIe ( Tk ) provides a view of the evolution of the complex network parameters over the time, following the dynamics of the EEG recording. By averaging the values PDIxe i ,x j ( Tk ) over the epochs, an average dissimilarity matrix PDI( Tk ) is achieved that describes the inter-electrode dissimilarity over the whole EEG, recorded at time Tk of the follow-up program. 3.6. Complex Network Analysis Based on PDI A complex network can be modelled by a graph representation. A graph is a diagram that consists of nodes connected to each other through links, called edges. Two nodes connected by an edge are considered adjacent or neighbours and the number of neighbours represents the degree of a node [35]. Each edge can be characterized by a weight, which quantifies the strength of the relationship between the two involved nodes. The information of a weighted graph is contained in the n × n dissimilarity matrix, where n is the number of vertices and the element i, j represents the weight of the edge connecting the nodes i and j. In this study, undirected weighted graphs were considered as PDI is a symmetrical parameter. In this study, the element i, j of the dissimilarity matrix is PDIxi ,x j . In order to evaluate the efficiency of the model and of the network organization, standard complex network parameters were calculated: Characteristic Path Length (λ), average Clustering Coefficient (CC), Global Efficiency (GE) and Small-World property (SW) [27]. The Characteristic Path Length (λ) is a measure of integration of the network [36] and can be calculated as the mean of the shortest path length (di,j ) computed over all the pairs of n nodes. It is defined as follows: λ=
1 n ( n −1)
∑
i6= j i,j∈V
di,j .
The Global Efficiency (GE) is related to λ [37]: it is the average inverse shortest path length (di,j ) and it is defined as: GE =
1 n
∑ i ∈V
∑ j∈V,j6=i (di,j )−1 . n −1
The average Clustering Coefficient (CC) is a measure of segregation and quantifies the ability of nodes to group together with the nearest neighbours. It is defined as: CC =
1 n
∑in=1 CCi =
1 n
∑ i ∈V
2ti , k i ( k i −1)
where CCi represents the clustering coefficient of node i. It depends on the number of triangles (ti ) around node i and the maximum possible number of triangles of that node, which can be calculated as k i × (k i − 1)/2, where k i is the degree of node i [27]. The Eccentricity measures the maximum shortest path length (d) between a node i and any other node x in the graph G [26]. In other words, it measures the distance between a node and the node that is farthest from it in the graph:
Entropy 2017, 19, 548
7 of 15
E = max (di,x ). In order to avoid inferring misleading conclusions about the proposed weighted network analysis, a surrogate assisted analysis approach was adopted [38]. The network size did not change over time because no thresholding was applied and weighted fully connected networks with 19 nodes were always considered. For every patient, for every step of the follow-up program (T0 or T1), for every frequency range under consideration (0.5–32 Hz, delta, theta, alpha and beta) a dissimilarity matrix is defined. For every dissimilarity matrix, 4096 surrogates with randomly reshuffled weights’ positions are generated [38]. The parameters of the surrogate networks λs , CCs , GEs , SWs and Es are estimated and then averaged over the 4096 surrogates. The parameters of the original network are normalized by the average surrogate parameters: λn = λ/λs , CCn = CC/CCs , GEn = GE/GEs and En = E/Es . CC and λ are the main features of the small-world phenomenon [39]. The small-worldness is quantified by the small-world coefficient (SW) that depends on λ, CC [21]. It is defined as: SWn =
CCn λn .
Given the dissimilarity matrices PDI( Tk ), the network parameters λn , CCn , GEn , and SWn . The eccentricity En of every node was also calculated and it was mapped on the scalp in order to achieve a topographical representation of the eccentricity of every electrode, which gives a prompt view of the relative centrality/peripherality of the EEG channels. Eccentricity topography over the scalp gives an estimation of the most disconnected areas because areas (electrodes) with relatively high eccentricity are relatively “farther” from any other electrode of the graph, in terms of coupling strength between the corresponding EEG signals. For every patient, both EEG(T0) and EEG(T1) were analyzed in the aforementioned way. A PDI-based complex network model was constructed and the network parameters were estimated. By comparing the normalized network parameters at T0 and at T1, changes in the brain-electrical connectivity can be estimated as the model reflects the cortical network functioning in terms of electrical coupling strength between the cortical areas. In particular, the percent change of λn , CCn , GEn and SWn were calculated and the scalp topographies of the eccentricity En were visually compared. The scalp topographies also show the active connections when PDI was thresholded at 0.5. 4. Results As discussed in [25], PDI can measure changes in the coupling strength between EEG signals in the follow-up study of MCI subjects. This is the reason why it was exploited in this work as a basic metric to develop a complex network model that provides a global view of the electrical connectivity of the cerebral cortex during the follow-up. First of all, the statistical significance of the variations of PDI levels (one PDI value for every couple of EEG channels), in each sub-band (delta, theta, alpha, beta) and in the total frequency range under analysis (0.5–32 Hz), was analyzed. Table 2 shows, for every patient, the p-values calculated by the Wilcoxon test [40], under the null hypothesis that, given a patient, the medians of the PDI values at time T0 do not differ from those at time T1. The p-values associated with an increased coupling strength (reduced PDI) are highlighted in grey in Table 2 as they are indicative of improved connectivity, thus not indicative of connectivity degeneration. The values associated with a reduced coupling strength (increased PDI) are emphasized in bold when statistically significant (p < 0.05). Table 2 shows that 10 out of 13 subjects whose MoCA decreased (Pt 3, 32, 51, 71, 131, 164, 178, 180, 184, 185) exhibited a significant increase in global PDI in at least two sub-bands. Pt 146 and 156 experienced slight MoCA reduction (one point) and did not show a significant reduction in PDI. Subjects whose MoCA has improved did not show significantly increase PDI in any sub-band. Once the sensitivity of PDI to EEG coupling strength variations due to cognitive decline was assessed, the next step was to use PDI to build a dissimilarity matrix and the subsequent complex network model, as discussed in Section 3.5. The model was constructed, for every patient, both at time T0 and T1. The parameters λn , CCn , GEn and SWn were estimated for every patient, both at time T0 and T1. The eccentricity of each electrode
Entropy 2017, 19, 548
8 of 15
was also calculated. By comparing the variations of the network parameters between T0 and T1, the variations of cortical electrical connectivity could be indirectly estimated. Table 2. Significance of PDI variation, from time T0 to time T1. Patient Pt 03 Pt 23 Pt 30 Pt 32 Pt 41 Pt 51 Pt 71 Pt 72 Pt 127 Pt 128 Pt 129 Pt 131 Pt 132 Pt 137 Pt 143 Pt 144 Pt 146 Pt 147 Pt 150 Pt 153 Pt 155 Pt 156 Pt 157 Pt 162 Pt 164 Pt 167 Pt 173 Pt 178 Pt 180 Pt 184 Pt 185 Pt 186 Pt 193
0.5–32 Hz 10−2
1.01 × 2.57 × 10−1 9.01 × 10⁻¹ 1.58 × 10⁻¹⁷ 5.34 × 10⁻¹ 1.01 × 10⁻²² 1.50 × 10⁻³² 2.06 × 10⁻¹⁹ 3.38 × 10⁻¹ 9.42 × 10⁻¹ 1.38 × 10⁻⁴ 4.58 × 10⁻² 3.02 × 10⁻² 4.04 × 10⁻¹ 9.31 × 10⁻¹ 6.91 × 10⁻¹ 1.49 × 10⁻¹ 1.57 × 10⁻¹ 3.57 × 10⁻² 6.36 × 10⁻¹⁰ 2.12 × 10⁻⁵ 3.72 × 10⁻² 2.69 × 10⁻¹ 7.74 × 10⁻¹ 1.24 × 10⁻¹ 6.93 × 10⁻¹ 1.75 × 10⁻² 1.34 × 10⁻⁵ 7.47 × 10⁻¹⁷ 2.20 × 10⁻³³ 3.12 × 10⁻¹⁶ 2.80 × 10⁻⁷ 6.45 × 10⁻⁶
Delta 10−14
3.88 × 5.80 × 10−1 4.38 × 10⁻¹ 9.91 × 10⁻¹³ 3.33 × 10⁻¹⁵ 7.81 × 10⁻¹⁶ 3.46 × 10−50 1.93 × 10−48 2.93 × 10⁻² 4.03 × 10⁻¹ 4.61 × 10⁻²⁷ 3.85 × 10⁻⁷ 7.94 × 10⁻²¹ 6.08 × 10⁻² 5.87 × 10⁻¹ 1.70 × 10⁻¹ 4.46 × 10⁻¹⁰ 9.49 × 10⁻² 3.90 × 10⁻²² 5.56 × 10−48 7.39 × 10⁻¹ 5.76 × 10⁻¹ 1.64 × 10⁻¹ 4.91 × 10⁻¹ 1.54 × 10⁻²⁷ 1.61 × 10⁻²⁷ 5.98 × 10⁻³ 3.66 × 10⁻⁵ 1.36 × 10−36 5.46 × 10⁻²⁸ 1.72 × 10⁻¹⁴ 1.41 × 10⁻⁴ 3.51 × 10⁻¹⁸
Theta 10−5
5.18 × −8.90 × 10⁻¹ 3.38 × 10⁻¹ 2.82 × 10⁻⁸ 7.36 × 10⁻¹ 6.50 × 10⁻²³ 2.52 × 10⁻³⁴ 7.33 × 10−50 9.69 × 10⁻¹ 6.49 × 10⁻¹ 1.36 × 10⁻¹⁶ 1.26 × 10⁻³ 3.21 × 10⁻¹ 2.08 × 10⁻¹ 3.58 × 10⁻¹ 8.17 × 10⁻¹ 1.21 × 10⁻⁸ 7.73 × 10⁻² 3.04 × 10⁻²⁰ 3.41 × 10⁻⁵ 4.20 × 10⁻² 1.72 × 10⁻¹ 4.03 × 10⁻³ 4.33 × 10⁻⁴ 2.39 × 10⁻² 2.03 × 10⁻⁴ 1.15 × 10⁻⁷ 1.10 × 10⁻⁶ 1.25 × 10⁻³⁰ 1.27 × 10⁻²⁸ 6.75 × 10⁻¹⁴ 7.03 × 10⁻¹³ 2.55 × 10⁻¹⁴
Alpha 10−1
7.21 × 1.05 × 10−1 4.91 × 10⁻³ 1.36 × 10⁻⁹ 9.70 × 10⁻² 8.20 × 10⁻²⁰ 1.82 × 10⁻²³ 8.37 × 10⁻¹² 4.60 × 10⁻¹ 4.72 × 10⁻¹ 2.78 × 10⁻¹ 5.29 × 10⁻² 4.02 × 10⁻³ 7.93 × 10⁻¹ 1.61 × 10⁻¹ 5.27 × 10⁻² 5.46 × 10⁻² 1.57 × 10⁻² 1.20 × 10⁻⁴ 1.54 × 10⁻⁸ 5.64 × 10⁻⁶ 1.08 × 10⁻⁴ 4.61 × 10⁻⁵ 7.97 × 10⁻¹ 1.42 × 10⁻¹ 6.05 × 10⁻² 3.29 × 10⁻⁹ 3.05 × 10⁻² 1.24 × 10⁻¹⁷ 6.22 × 10−37 1.23 × 10⁻¹² 2.27 × 10⁻¹⁵ 7.70 × 10⁻¹²
Beta 9.23 × 10⁻¹ 1.04 × 10⁻¹ 4.40 × 10⁻¹ 3.59 × 10⁻²¹ 8.52 × 10⁻¹ 1.16 × 10⁻²¹ 5.26 × 10⁻³⁵ 3.14 × 10⁻⁵ 7.41 × 10⁻¹ 5.45 × 10⁻¹ 1.77 × 10⁻¹¹ 3.45 × 10⁻⁴ 7.74 × 10⁻¹ 2.99 × 10⁻¹ 1.85 × 10⁻¹ 1.75 × 10⁻¹ 7.81 × 10⁻³ 7.40 × 10⁻¹ 5.52 × 10⁻¹ 9.68 × 10⁻¹² 2.24 × 10⁻⁵ 8.28 × 10⁻³ 6.17 × 10⁻¹ 1.06 × 10⁻³ 5.47 × 10⁻⁴ 2.75 × 10⁻¹ 8.70 × 10⁻¹ 2.30 × 10⁻¹⁰ 8.17 × 10⁻¹⁶ 1.57 × 10⁻³⁰ 1.21 × 10⁻¹⁷ 3.62 × 10⁻⁵ 2.59 × 10⁻⁵
Figure 2 shows the percent variation of λn , CCn , GEn and SWn in the transition from T0 to T1. It is worth noting that 11 of the 13 subjects whose MoCA worsened (pt 3, 32, 41, 51, 71, 131, 164, 178, 180, 184, 185) showed an increase in λn and a decrease in CCn , GEn and SWn in every sub-band, as well as in the total range. Subjects pt 146 and pt 156 experienced MoCA worsening, even though just a one point decrease, but their network parameters did not show such a behaviour. The network parameters of pt 186 showed an increase in λn and reduction of CCn , GEn and SWn , even though MoCA was stable. MoCA reduction appears linked with an increase in λn and a decrease in CCn , GEn and SWn in all sub-bands, thus endorsing the hypothesis that cognitive decline in MCI subjects reflects a reduction in cortical electrical connectivity.
Entropy 2017, 19, 548
9 of 15
Figure 2. Variation (from time T0 to T1) of the complex network parameters λn , CCn , GEn and SWn , for every patient, in every sub-band (delta, theta, alpha and beta) as well as in the overall range (0.5–32 Hz).
In order to validate statistically this observation, the correlation between MoCA variation and the variation of each network parameter was estimated by Pearson’s linear correlation test. Figure 3 shows the scatter plot of λn , CCn , GEn and SWn percent variations vs MoCA variation in the total 0.5–32 Hz range (a) as well as in the sub-bands delta (b), theta (c), alpha (d) and beta (e). The scatter points of subjects with worsened MoCA are marked with a red circle, whereas stable subjects (zero or positive MoCA variation) are marked with a blue circle. Each subplot reports the correlation and the related p-value. As regards the total range (Figure 3a), a significant negative correlation between MoCA variation and λn variation (r = −0.56, p = 0.0006) can be observed, whereas a significant positive correlation could be observed between MoCA variation and CCn variation (r = 0.58, p = 0.0004), GEn (r = 0.57, p = 0.0005) and SWn (r = 0.57, p = 0.0005). The same trend could be observed in every sub-band, specifically: • • • •
Delta range (λn , r = −0.46 and p = 0.007; CCn , r = 0.45 and p = 0.009; GEn , r = 0.45 p = 0.009; SWn , r = 0.43 and p = 0.01); Theta range (λn , r = −0.56 and p = 0.0006; CCn , r = 0.6 and p = 0.0002; GEn , r = 0.6 p = 0.0002; SWn , r = 0.59 and p = 0.0003); Alpha range (λn , r = −0.5 and p = 0.003; CCn , r = 0.53 and p = 0.001; GEn , r = 0.53 p = 0.0016; SWn , r = 0.52 and p = 0.002); Beta range (λn , r = −0.59 and p = 0.0003; CCn , r = 0.59 and p = 0.0003; GEn , r = 0.59 p = 0.0003; SWn , r = 0.59 and p = 0.0003).
and and and and
Entropy 2017, 19, 548
10 of 15
r=-0.56556 p=0.00060383
0
-50
10 0 -10 -20
-5 0 5 MoCA Variation from T0 to T1
-5 0 5 MoCA Variation from T0 to T1
r=0.57556 p=0.00045767
10 0 -10
r=0.57468 p=0.00046907
50 SW (%) (in 0.5-32Hz)
GE (%) (in 0.5-32Hz)
20
r=0.58026 p=0.0004005
20 avg CC (%) (in 0.5-32Hz)
Lambda (%) (in 0.5-32Hz)
50
-20
0
-50 -5 0 5 MoCA Variation from T0 to T1
-5 0 5 MoCA Variation from T0 to T1
(a)
-20 -5 0 5 MoCA Variation from T0 to T1 r=0.44901 p=0.0087641
50 SW (%) (in Delta)
GE (%) (in Delta)
20
0 -10
10 0 -10 -20
0
0
20
-50 -5 0 5 MoCA Variation from T0 to T1
r=-0.56479 p=0.00061668
10 0 -10
-50
10 0 -10
50
0 -10 -20
0
0
20
r=0.59031 p=0.00029901
10 0 -10 -20
-5 0 5 MoCA Variation from T0 to T1 r=0.58746 p=0.00032519
10
50
0 -10 -20
-5 0 5 MoCA Variation from T0 to T1
(d)
20
-50 -5 0 5 MoCA Variation from T0 to T1 r=0.51743 p=0.0020443
-50 -5 0 5 MoCA Variation from T0 to T1
r=-0.59371 p=0.00027034
SW (%) (in Beta)
10
-5 0 5 MoCA Variation from T0 to T1
avg CC (%) (in Beta)
50
-20 -5 0 5 MoCA Variation from T0 to T1 r=0.52748 p=0.0016081 SW (%) (in Alpha)
GE (%) (in Alpha)
20
r=0.53367 p=0.0013822
GE (%) (in Beta)
-50
-5 0 5 MoCA Variation from T0 to T1 r=0.58756 p=0.00032423
0
-5 0 5 MoCA Variation from T0 to T1
Lambda (%) (in Beta)
0
0 -10
(c)
20 avg CC (%) (in Alpha)
Lambda (%) (in Alpha)
r=-0.50416 p=0.0027755
10
50
-20 -5 0 5 MoCA Variation from T0 to T1
r=0.60087 p=0.00021771
-20 -5 0 5 MoCA Variation from T0 to T1 r=0.59673 p=0.00024692
(b)
50
20
-50 -5 0 5 MoCA Variation from T0 to T1 r=0.43201 p=0.012053 GE (%) (in Theta)
-50
10
50
avg CC (%) (in Theta)
0
r=0.45013 p=0.0085762
SW (%) (in Theta)
20
Lambda (%) (in Theta)
r=-0.45706 p=0.0074944 avg CC (%) (in Delta)
Lambda (%) (in Delta)
50
-5 0 5 MoCA Variation from T0 to T1 r=0.58837 p=0.00031664
0
-50 -5 0 5 MoCA Variation from T0 to T1
-5 0 5 MoCA Variation from T0 to T1
(e)
Figure 3. Correlation between MoCA variation and the variation of every complex network parameter λn , CCn , GEn and SWn . The scatter points of subjects with worsened MoCA are marked with a red circle whereas stable subjects (zero or positive MoCA variation) are marked with a blue circle. Each subplot reports the corresponding r and p value, estimated by the Pearson’s linear correlation test. (a) total range (0.5–32 Hz); (b) delta range (0.5–4 Hz); (c) theta range (4–8 Hz); (d) alpha range (8–13 Hz); and (e) beta range (13–32 Hz);
Entropy 2017, 19, 548
11 of 15
These results endorse the hypothesis that a loss of efficiency in the organization of the PDI-based complex network is associated with cognitive decline. Figure 4 shows some explanatory scalp topographies of the eccentricity values estimated at time T0 and T1. Figure 4 shows the results achieved on two worsened subjects (pt 51 and 71) and on two stable subjects (pt 127 and 128). Given the minimum and maximum values of eccentricity at times T0 and T1, Emax (T0), Emin (T0), Emax (T1) and Emin (T1), the maps were both normalized with respect to Emin, the minimum between Emin (T0) and Emin (T1), and Emax, the maximum between Emax (T0) and Emax (T1). The colour gradation ranges from blue (Emin) to red (Emax). The colouration of the areas in between two electrodes was interpolated [30]. The stronger connections (PDI < 0.5) are also shown. Subjects pt 51 and 71 (who showed cognitive and clinical worsening) exhibited a reduced connection density (decreased number of active connections between the electrodes) and an increased overall eccentricity, which reflects an overall reduced coupling strength between the electrodes. Subject pt 127 and 128, who instead had stable MoCA and clinical conditions, exhibited stable connection density and eccentricity topography.
Figure 4. Explanatory eccentricity scalp mapping of two worsened subjects (pt 51 and 71) and two stable subjects (pt 127 and 128). Given the minimum and maximum values of eccentricity at times T0 and T1, Emax (T0), Emin (T0), Emax (T1) and Emin (T1), the maps were both normalized with respect to Emin, the minimum between Emin (T0) and Emin (T1), and Emax, the maximum between Emax (T0) and Emax (T1). The colour gradation ranges from blue (Emin) to red (Emax). The colouration of the areas in between two electrodes was interpolated [30]. The active connections, when applying a 0.5 thresholding (PDI < 0.5), are also shown.
5. Discussion In this paper, a novel Permutation Disalignment Index (PDI)-based complex network model was proposed to quantify the longitudinal changes in brain-electrical network organization. Many neurological disorders indeed affect the functional cortical organization and cause a loss of functional connectivity over the time. The brain, during either active task execution or resting state, generates bio-electromagnetics field due to the synaptic action associated with the interaction between neurons. Such bio-electromagnetic activity can be detected through proper neurophysiological measurements, like Electroencephalography (EEG) [1]. The detection and subsequent processing of the neurophysiological signals can provide valuable information about the conditions of complex system that generated them: the brain. Mild Cognitive Impairment (MCI) is a condition that causes noticeable cognitive changes, which, however, are not severe enough to interfere with the subject’s autonomy. An MCI subject is at an increased risk of developing Alzheimer’s or another dementia [6]. It is still not possible to predict whether the MCI condition is going to degenerate into dementia or
Entropy 2017, 19, 548
12 of 15
not, so there is still no chance of early intervention. Cross-sectional studies in the literature report that subjects with dementia exhibited a reduced efficiency of the electrical connectivity compared to MCI subjects, who, in turn, exhibited a weaker connectivity, compared to healthy subjects [2,7,13,19]. This paper addressed the importance of follow-up studies on MCI subjects with the aim of detecting any early sign of cortical electrical connectivity deterioration. The MCI patient evaluation is based on anamnesis and on a set of examinations that score the patient’s cognitive abilities and autonomy. EEG is commonly recorded to assess whether the MCI subject’s electrical activity exhibits any slowing (i.e., the power of low frequencies increases while the power of the high frequencies decreases) [2,7,13], but, in clinical practice, the EEG is not objectively quantified to compare the results with those obtained in the previous steps of follow-up program. The present study aimed at investigating the hypothesis that longitudinal cognitive decline in MCI subjects is associated with a reduced efficiency of cortical electrical connectivity in order to propose a quantitative marker of connectivity deterioration. To this purpose, a group of 33 MCI subjects was enrolled and evaluated longitudinally at time T0 and T1, four months later. Patients were evaluated through a full cognitive and neurological assessment and underwent EEG recording and MoCA test. The EEG was analyzed through a novel complex network model based on the Permutation Disalignment Index (PDI), a multivariate parameter recently introduced by the authors, which is inversely proportional to the coupling strength between time series. PDI estimates the disalignment randomness between two or more time series, by projecting them into a predetermined set of symbols. PDI was shown to be sensitive to the variations of coupling strength between EEG signals observed in a follow-up study carried out on AD patients and MCI subjects. In the present work, PDI was exploited as a basic metric for the development of a complex network model whose quantification might track the brain electrical connectivity changes associated with cognitive decline. The EEG signals were recorded and then processed through the proposed complex network model both at time T0 and T1. The EEG recording was windowed and then processed window by window. Within every window (epoch), the EEG was filtered into the four major brain waves: delta, theta, alpha and beta. The complex network model was applied to either the full-range EEG (0.5–32 Hz) and the sub-band EEGs (delta, theta, alpha and beta). For every frequency range under consideration (0.5–32 Hz, delta, theta, alpha and beta), the PDI between every pair of EEG signals was estimated and the corresponding complex network model was constructed and quantified. In particular, the characteristic path length, the average clustering coefficient, the global efficiency, the small worldness and the eccentricity were estimated. In order to quantify to what extent the cortical electrical connectivity changed from T0 to T1, the variation of the aforementioned parameters was estimated. The quantification of the proposed model exhibited a statistically significant correlation with MoCA score in every sub-band as well as in the total 0.5–32 Hz range (Figure 3). In particular, as regards the total range, a significant negative correlation could be observed between MoCA variation and λ variation (r = −0.56, p = 0.0006), whereas a significant positive correlation could be observed between MoCA variation and CC (r = 0.58, p = 0.0004), GE (r = 0.57, p = 0.0005) and SW (r = 0.57, p = 0.0005) variation. Furthermore, subjects with worsened MoCA score exhibited a reduced connection density and an increased overall eccentricity, which reflects an overall reduced coupling strength between the electrodes (increased PDI). On the contrary, stable subjects exhibited stable connection density and eccentricity topography. These findings endorse that cognitive decline seems to reflect the underlying cortical “disconnection” phenomenon caused by neuronal degeneration in MCI, worsened subjects indeed showed increased λ and decreased CC, GE and SW, thus decreased efficiency of the underlying complex network. MCI, when prodromal to dementia, is indeed considered a disconnection disorder because it induces a deterioration of network organization [2,7,13,19]. Frantzidis et al. [19] provided evidence that MCI and Mild Dementia (MD) patients exhibited a loss of optimal brain network organization, in comparison with healthy controls, probably due to the reduction of local information processing caused by neuronal death. The results reported in the present work endorse that cognitive decline comes with a reduction of brain-electrical network organization (increased λ and decreased CC, GE and SW). To the authors’ best
Entropy 2017, 19, 548
13 of 15
knowledge, this is the first time that MCI subjects have been longitudinally evaluated to correlate their cognitive decline with the worsening of brain-electrical connectivity. In the near future, our complex network approach based on PDI will be tested on high-density EEG, which will be able to reflect the underlying network dynamics with better spatial resolution, recorded from a large sample of MCI subjects. PDI is an inverse measure of coupling strength between time series, which can be successfully applied to EEG signals because it is robust to artifacts and offers several advantages over other standard measures such as coherence [25]. Thanks to the projection on a predetermined set of symbols, the motifs, PDI is less susceptible to artifacts and to the effects of proximity to the reference electrode [25]. However, the dependency from volume conduction effects [41] has not been investigated yet. In our future research, our method will be tested on multichannel neural mass models, and the performance of the method will be assessed before and after the reduction of volume conduction effects through Laplacian methods [1]. 6. Conclusions In conclusion, EEG acquisition and the subsequent PDI-based connectivity analysis proposed in the present work might help in the objective quantification of brain-electrical connectivity changes in MCI subjects and could provide the neurologist with additional diagnostic information. However, recruiting subjects in a follow-up study and making them strictly follow the timing of the program is challenging, which caused a lack of longitudinal studies in the literature and made the present dataset of limited size. We hope the present results encourage hospitals and clinical centers to collect and share follow-up EEG recordings because longitudinal studies on large samples of MCI subjects are long overdue and would certainly increase the probability to succeed in developing predictive EEG-based biomarkers of cognitive decline. Author Contributions: N.M. conceived and designed the research, defined the model and the whole procedure, implemented the algorithms, carried out the experiments and wrote the paper. C.I. implemented and ran the algorithms for surrogate network analysis and co-wrote the paper. S.D., S.M., A.M. and F.C. enrolled and evaluated the patients, recorded the EEG, administered the MoCA test, provided a medical feedback about the results and revised the paper from the medical point of view. F.C.M. provided a critical feedback about the research design and the results and co-wrote the text. Every author gave the final manuscript approval. Conflicts of Interest: The authors declare no conflict of interest.
References 1. 2. 3.
4.
5. 6.
7.
Nunez, P.L.; Srinivasan, R. Electric Fields of the Brain, the Neurophysics of EEG; Oxford University Press: New York, NY, USA, 2006. Dauwels, J.; Vialatte, F.; Cichocki, A. Diagnosis of Alzheimer’s disease from EEG signals: Where are we standing? Curr. Alzheimer Res. 2010, 7, 487–505. Gong, N.J.; Wong, C.S.; Chan, C.C.; Leung, L.M.; Chu, Y.C. Correlations between microstructural alterations and severity of cognitive deficiency in Alzheimer’s disease and Mild Cognitive Impairment: A diffusional kurtosis imaging study. Magn. Reson. Imaging 2013, 31, 688–694. O’Dwyer, L.; Lamberton, F.; Bokde, A.L.W.; Ewers, M.; Faluyi, Y.; Tanner, C.; Mazoyer, B.; O’Neill, D.; Bartley, M.; Collins, D.R.; et al. Using support vector machines with multiple indices of diffusion for automated classification of mild cognitive impairment. PLoS ONE 2012, 7, e32441. Varghese, T.; Sheelakumari, R.; James, J.S.; Mathuranath, P. A review of neuroimaging biomarkers of Alzheimer’s disease. Neurol. Asia 2013, 18, 239–248. McEvoy, L.K.; Fennema-Notestine, C.; Roddey, J.C.; Hagler, D.J.; Holland, D.; Karow, D.S.; Pung, C.J.; Brewer, J.B.; Dale, A.M. Alzheimer’s Disease Neuroimaging Initiative. Alzheimer disease: Quantitative structural neuroimaging for detection and prediction of clinical and structural changes in mild cognitive impairment. Radiology 2009, 251, 195–205. Alberdi, A.; Aztiria, A.; Basarab, A. On the early diagnosis of Alzheimer’s Disease from multimodal signals: A survey. Artif. Intell. Med. 2016, 71, 1–29.
Entropy 2017, 19, 548
8.
9.
10.
11. 12.
13. 14.
15.
16.
17. 18. 19.
20. 21.
22.
23.
24.
25.
26.
14 of 15
Bramanti, A.; Bonanno, L.; Celona, A.; Bertuccio, S.; Calisto, A.; Lanzafame, P.; Bramanti, P. GIS and spatial analysis for costs and services optimization in neurological telemedicine. In Proceedings of the 2010 Annual International Conference of the IEEE Engineering in Medicine and Biology Society (EMBC), Buenos Aires, Argentina, 31 August–4 September 2010; pp. 2204–2207. Trzepacz, P.T.; Hochstetler, H.; Wang, S.; Walker, B.; Saykin, A.J. Relationship between the Montreal Cognitive Assessment and Mini-mental State Examination for assessment of mild cognitive impairment in older adults. BMC Geriatr. 2015, 15, 107, doi:10.1186/s12877-015-0103-3. Lo Re, G.; De Luca, R.; Muscarneri, F.; Dorangricchia, P.; Picone, D.; Vernuccio, F.; Salerno, S.; La Tona, G.; Pinto, A.; Midiri, M.E.A. Relationship between anxiety level and radiological investigation. Comparison among different diagnostic imaging exams in a prospective single-center study. Radiol. Med. 2016, 121, 763–768. Adeli, H.; Ghosh-Dastidar, S.; Dadmehr, N. Alzheimer’s Disease and Models of Computation: Imaging, Classification, and Neural Models. J. Alzheimers Dis. 2005, 7, 187–199. Fiscon, G.; Weitschek, E.; Felici, G.; Bertolazzi, P.; De Salvo, S.; Bramanti, P.; De Cola, M.C. Alzheimer’s disease patients classification through EEG signals processing. In Proceedings of the 2014 IEEE Symposium on Computational Intelligence and Data Mining (CIDM), Orlando, FL, USA, 9–12 December 2014; pp. 105–112. Koenig, T.; Prichep, L.; Dierks, T.; Hubl, D.; Wahlund, L.O.; John, E.R.; Jelic, V. Decreased EEG synchronization in Alzheimer’s disease and mild cognitive impairment. Neurobiol. Aging 2005, 26, 165–171. Labate, D.; La Foresta, F.; Palamara, I.; Morabito, G.; Bramanti, A.; Zhang, Z.; Morabito, F.C. EEG complexity modifications and altered compressibility in mild cognitive impairment and Alzheimer’s disease. In Recent Advances of Neural Network Models and Applications; Springer: Berlin, Germany, 2014; pp. 163–173. Moretti, D.V. Conversion of Mild Cognitive Impairment patients in Alzheimer’s disease: Prognostic value of Alpha3/Alpha2 electroencephalographic rhythms power ratio. Alzheimers Res. Ther. 2015, 7, 80, doi:10.1186/s13195-015-0162-x. Babiloni, C.; Frisoni, G.B.; Pievani, M.; Vecchio, F.; Lizio, R.; Buttiglione, M.; Geroldi, C.; Fracassi, C.; Eusebi, F.; Ferri, R.; et al. Hippocampal volume and cortical sources of EEG alpha rhythms in mild cognitive impairment and Alzheimer disease. Neuroimage 2008, 44, 123–135. Stam, C.J.; van der Made, Y.; Pijnenburg, Y.A.; Scheltens, P. EEG synchronization in Mild Cognitive Impairment and Alzheimer’s disease. Acta Neurol. Scand. 2003, 108, 90–96. Ahmadlou, M.; Adeli, H. Wavelet-synchronization methodology: A new approach for EEG-based diagnosis of ADHD. Clin. EEG Neurosci. 2010, 41, 1–10. Frantzidis, C.A.; Vivas, A.B.; Tsolaki, A.; Klados, M.A.; Tsolaki, M.; Bamidis, P.D. Functional disorganization of small-world brain networks in mild Alzheimer’s Disease and amnestic Mild Cognitive Impairment: An EEG study using Relative Wavelet Entropy (RWE). Front. Aging Neurosci. 2014, 26, doi:10.3389/fnagi.2014.00224. Ahmadlou, M.; Adeli, A.; Bajo, R.; Adeli, H. Complexity of functional connectivity networks in Mild C ognitive I mpairment subjects during a working memory task. Clin. Neurophysiol. 2014, 125, 694–702. Vecchio, F.; Miraglia, F.; Quaranta, D.; Granata, G.; Romanello, R.; Marra, C.; Bramanti, P.; Rossini, P.M. Cortical connectivity and memory performance in cognitive decline: A study via graph theory from EEG data. Neuroscience 2016, 316, 143–150. Morabito, F.C.; Campolo, M.; Labate, D.; Morabito, G.; Bonanno, L.; Bramanti, A.; de Salvo, S.; Marra, A.; Bramanti, P. A longitudinal EEG study of Alzheimer’s disease progression based on a complex network approach. Int. J. Neural Syst. 2015, 25, doi:10.1142/S0129065715500057. Buscema, M.; Grossi, E.; Capriotti, M.; Babiloni, C.; Rossini, P. The IFAST Model allows the prediction of conversion to Alzheimer disease in patients with mild cognitive impairment with high degree of accuracy. Curr. Alzheimer Res. 2010, 7, 173–187. Buscema, M.; Vernieri, F.; Massini, G.; Scrascia, F.; Breda, M.; Rossini, P.; Grossi, E. An improved I-FAST system for the diagnosis of Alzheimer’s disease from unprocessed electroencephalograms by using robust invariant features. Artif. Intell. Med. 2015, 64, 59–74. Mammone, N.; Bonanno, L.; De Salvo, S.; Marino, S.; Bramanti, P.; Bramanti, A.; Morabito, M.F. Permutation Disalignment Index as an Indirect, EEG-Based, Measure of Brain Connectivity In MCI And AD Patients. Int. J. Neural Syst. 2017, 27, doi:10.1142/S0129065717500204. Seidkhani, H.; Nikolaev, A.R.; Meghanathan, R.N.; Pezeshk, H.; Masoudi-Nejad, A.; van Leeuwen, C. Task modulates functional connectivity networks in free viewing behavior. NeuroImage 2017, 159, 289–301.
Entropy 2017, 19, 548
27. 28. 29. 30. 31. 32. 33. 34. 35.
36. 37. 38. 39. 40. 41.
15 of 15
Rubinov, M.; Sporns, O. Complex network measures of brain connectivity: Uses and interpretations. Neuroimage 2010, 52, 1059–1069. American Psychiatric Association. (Ed.) Diagnostic and Statistical Manual of Mental Disorders, 5th ed.; American Psychiatric Association: Lake St. Louis, MO, USA, 2013. Vecchio, F.; Babiloni, C. Direction of information flow in Alzheimer’s disease and MCI patients. Int. J. Alzheimers Dis. 2011, 2011, doi:10.4061/2011/214580. Delorme, A.; Makeig, S. EEGLAB: An open source toolbox for analysis of single-trial EEG dynamics including Independent Component Analysis. J. Neurosci. Methods 2004, 134, 9–21. What is EEGLAB? Available online: https://sccn.ucsd.edu/eeglab/index.php (accessed on 14 October 2017). Bandt, C.; Pompe, B. Permutation Entropy: A Natural Complexity Measure for Time Series. Phys. Rev. Lett. 2002, 88, doi:10.1103/PhysRevLett.88.174102. Renyi, A. On measures of information and entropy. In Proceedings of the Fourth Berkeley Symposium on Mathematical Statistics and Probability, Berkeley, CA, USA, 20–30 July 1960; pp. 547–561. Hild, K.E., II; Erdogmus, D.; Principe, J. Blind source separation using Renyi’s mutual information. IEEE Signal Proc. Lett. 2001, 8, 174–176. Chapela, V.; Criado, R.; Moral, S.; Romance, M. Mathematical Foundations: Complex Networks and Graphs (A Review). In Intentional Risk Management through Complex Networks Analysis; Springer: Berlin, Germany, 2015; pp. 9–36. Fornito, A.; Zalesky, A.; Bullmore, E. Fundamentals of Brain Network Analysis; Academic Press: Cambridge, MA, USA, 2016. Latora, V.; Marchiori, M. Efficient behavior of small-world networks. Phys. Rev. Lett. 2001, 87, 198701. Ansmann, G.; Lehnertz, K. Surrogate-assisted analysis of weighted functional brain networks. J. Neurosci. Methods 2012, 208, 165–172. Watts, D.J.; Strogatz, S.H. Collective dynamics of small-world networks. Nature 1998, 393, 440–442. Mann, H.B.; Whitney, D.R. On a Test of Whether one of Two Random Variables is Stochastically Larger than the Other. Ann. Math. Stat. 1947, 18, 50–60. Bastos, A.M.; Schoffelen, J.M. A tutorial review of functional connectivity analysis methods and their interpretational pitfalls. Front. Syst. Neurosci. 2016, 9, 175. c 2017 by the authors. Licensee MDPI, Basel, Switzerland. This article is an open access
article distributed under the terms and conditions of the Creative Commons Attribution (CC BY) license (http://creativecommons.org/licenses/by/4.0/).