A Platform for Secure Static Binary Instrumentation ∗ Mingwei Zhang
Rui Qiao
Niranjan Hasabnis
R. Sekar
Stony Brook University
Abstract Program instrumentation techniques form the basis of many recent software security defenses, including defenses against common exploits and security policy enforcement. As compared to source-code instrumentation, binary instrumentation is easier to use and more broadly applicable due to the ready availability of binary code. Two key features needed for security instrumentations are (a) it should be applied to all application code, including code contained in various system and application libraries, and (b) it should be nonbypassable. So far, dynamic binary instrumentation (DBI) techniques have provided these features, whereas static binary instrumentation (SBI) techniques have lacked them. These features, combined with ease of use, have made DBI the de facto choice for security instrumentations. However, DBI techniques can incur high overheads in several common usage scenarios, such as application startups, system-calls, and many real-world applications. We therefore develop a new platform for secure static binary instrumentation (PSI) that overcomes these drawbacks of DBI techniques, while retaining the security, robustness and ease-of-use features. We illustrate the versatility of PSI by developing several instrumentation applications: basic block counting, shadow stack defense against control-flow hijack and return-oriented programming attacks, and system call and library policy enforcement. While being competitive with the best DBI tools on CPU-intensive SPEC 2006 benchmark, PSI provides an order of magnitude reduction in overheads on a collection of real-world applications.
1.
Introduction
Program instrumentation has played a central role in exploit detection/prevention, security policy enforcement, application monitoring and debugging. Such instrumentation may be performed either on source or binary code. Source code ∗ This
work was supported in part by AFOSR grant FA9550-09-1-0539, NSF grant CNS-0831298, and ONR grant N000140710928.
Permission to make digital or hard copies of all or part of this work for personal or classroom use is granted without fee provided that copies are not made or distributed for profit or commercial advantage and that copies bear this notice and the full citation on the first page. Copyrights for components of this work owned by others than ACM must be honored. Abstracting with credit is permitted. To copy otherwise, or republish, to post on servers or to redistribute to lists, requires prior specific permission and/or a fee. Request permissions from
[email protected]. VEE ’2014, March 1–2, 2014, Salt Lake City, Utah, USA.. c 2014 ACM 978-1-4503-2764-0/14/03. . . $15.00. Copyright http://dx.doi.org/10.1145/2576195.2576208
instrumentations can be more easily and extensively optimized by exploiting higher level information such as types. However, binary instrumentations are more widely applicable since users have ready access to binaries. Moreover, security instrumentations should be applied to all code, including all libraries, inline assembly code, and any code inserted by the compiler/linker. Here again, binary based techniques are advantageous. Binary instrumentation can either be static or dynamic. Static binary instrumentation (SBI) is performed offline on binary files, whereas dynamic binary instrumentation (DBI) operates on code already loaded into main memory. DBI techniques disassemble and instrument each basic block just before its first execution. DBI has been the technique of choice for security instrumentation of COTS binaries. Previous works have used DBI for sandboxing [15, 17], tainttracking [23, 28], defense from return-oriented programming (ROP) attacks [11, 12], and other techniques for hardening benign code [16, 26]. This is because DBI platforms provide several features that simplify instrumentation development, while ensuring their security: • Non-bypassable instrumentation. DBI tools check every control-transfer to ensure that the target is instrumented, and hence can block attempts to escape security checks enforced by the instrumentation, e.g., by returning/jumping to (i) data (code injection attacks), (ii) middle of an instruction (typical ROP attacks), or (iii) into the middle of added instrumentation or past its end. • Completeness. DBI techniques instrument all executed code, regardless of whether they reside in executables or libraries. The alternative of omitting library instrumentation is unsatisfactory because the vast majority of code executed by today’s applications resides in libraries, and all of this code will remain unprotected. • Ease of use. Instrumenting an application is as simple as prefixing its invocation with the name of a wrapper program. There is no need to explicitly instrument the application prior to its run, nor is there a need to know (and instrument) the libraries used by it. Moreover, DBI platforms such as Pin [19], DynamoRIO [8] and Valgrind [22] provide a convenient API that greatly simplifies the development of new instrumentations (also called tools). Previous SBI techniques have lacked these features, and moreover, were targeted at specific problems such as controlflow integrity (CFI) [2] or software fault isolation (SFI) [32]. Consequently, they don’t address the issues in developing a general-purpose platform for binary instrumentation.
Main Results and Contributions We present a general-purpose binary instrumentation platform PSI that addresses the shortcomings of previous SBI techniques. It combines the benefits of DBI with the advantages that are unique to SBI, including: • the ability to trade off increased (offline) analysis/instrumentation time for faster runtime performance, and • avoiding reliance on a potentially large and complex vir-
tual environment at runtime Moreover, PSI provides low overheads across a wide range of benchmarks, while avoiding some pitfalls of DBI platforms such as high application startup times and high overheads for systems applications. Our key contributions are summarized below. Secure static instrumentation. Two key features needed for security instrumentations are completeness (instrumentation should be applied to all code that can get executed) and non-bypassability (instrumented code should not be able to bypass or subvert the added instrumentation). Many previous SBI techniques, including Native Client [35], PittSFIeld [20], PEBIL [18] and many others [2, 6, 14, 24, 36, 37], are not complete for COTS binaries since they require additional information (such as symbol or relocation information) for correctly instrumenting binaries. Among techniques applicable to stripped binaries, Reins [33] and SecondWrite [4, 13] don’t instrument all libraries. Moreover, several of these techniques, including Dyninst [10], SecondWrite and Binary stirring [34], do not prevent execution from escaping instrumentation since they do not check the validity of targets such as return addresses. Although our BinCFI [38] system performs such checks, it implements a single hard-coded instrumentation, and hence there is no general discussion or treatment of instrumentation non-bypassability. A versatile, easy-to-use static instrumentation platform. Our platform provides an easy-to-use API with convenient abstractions for low-level instrumentation, including data structures to capture instructions, basic blocks, and controlflow graphs. We illustrate the API and demonstrate its versatility by developing several instrumentation tools: • Counting basic blocks: This conceptually simple example has been used frequently to illustrate DBI platforms. • System call policy enforcement: These policies are com-
monly used in security hardening and related applications. • Shadow stack: This technique has been used by several
previous works to defend against stack-smashing [27] and ROP [12]. While our instrumentation is similar to that of ROPdefender [12], it provides much better performance. On-demand instrumentation of libraries. SBI techniques require all library dependences to be identified statically, and these libraries need to be instrumented ahead of time; otherwise, an instrumented application can fail at runtime. Tools
for determining library dependencies (e.g., ldd on Linux) cannot identify libraries that are loaded after an application begins execution. For a collection of popular real-world applications, more that 40% of library loads occurred after the commencement of application execution. To support seamless instrumentation of such libraries, we have developed an on-demand static instrumentation technique. Good performance across a wide range of applications We present a comparative performance evaluation of PSI against the two leading DBI tools, namely DynamoRIO and Pin. We summarize our results below: • BB counting on SPEC 2006. PSI incurs an average overhead of 69% on SPEC 2006 for basic-block counting, compared with 53% for DynamoRIO and 97% for Pin. • Shadow stack. PSI’s overhead is less than a quarter of that reported by ROPdefender (18% vs 74%). • lmbench Microbenchmark. The average overhead of PSI is about 10 times smaller than DynamoRIO, and 200 times smaller than Pin. • A collection of real-world applications. PSI’s overheads are about 7 to 13 times lower than DynamoRIO, and 60 times lower than Pin on several real-world applications, including compilation, software updates, etc. Our PSI platform will be available for download from http://seclab.cs.stonybrook.edu/download. Scope and Limitations. PSI is a general platform for the instrumentation of COTS applications. It is targeted at benign COTS binaries that do not employ obfuscation. If a binary employs obfuscation (as is common with malware), our disassembly technique can fail to detect all of its code, or perform incorrect disassembly. However, since control flows are checked at runtime, PSI will block all attempts to execute code that wasn’t disassembled and instrumented. Thus, binaries employing obfuscation may fail at runtime due to control-flow transfers being blocked, but they won’t be able to bypass PSI. Similar to most SBI techniques, PSI does not support selfmodifying code. In particular, any attempt to modify existing code (or to transfer control to runtime-generated code) will be denied, causing such applications to fail. Our implementation targets x86/Linux, but our techniques are generally applicable to other architectures as well.
2.
Background
Disassembly. Two of the basic algorithms used for disassembly are linear sweep and recursive disassembly. Linear sweep begins at the binary entry point, and sequentially disassembles instructions until the end. Data or padding embedded within code will also get disassembled. With variablelength instruction sets, this error can cascade past the data region. Recursive disassembly avoids this problem by following the control-flow, and limiting disassembly to those code fragments that are known to be reachable. However, it
often fails to discover all code, since some code is reachable only via code pointers whose values aren’t known statically. As a result, accurate disassembly of stripped binaries has been a challenging problem for variable-length instruction sets such as x86. Indeed, this is another reason for the popularity of DBI platforms, since they can side-step these difficulties by limiting disassembly to one basic block at a time, just before the block is executed for the first time. Our BinCFI [38] work and binary stirring [34] have shown that robust instrumentation can be achieved despite the above challenges. Like many previous efforts in static disassembly, these works combine elements of linear sweep and recursive disassembly. Specific advances made in these works were: (a) expanding the coverage of recursive disassembly using static analysis techniques for code pointer discovery, and (b) the development of instrumentation techniques that tolerate disassembly of data. Our efforts were also helped by the fact that compilers have become more strict in avoiding data within code segments. As a result, we have achieved 100% disassembly accuracy on many complex binaries [38]. In PSI, we reused this disassembler. Resolving Indirect Control Transfers. Insertion of instrumentation will cause the locations of subsequent code to change. This means that statically computed function pointers will have incorrect values in an instrumented program, pointing to code locations in the original rather than the instrumented code. DBI techniques solve this problem by performing address translation of indirect control flow targets at runtime. Our BinCFI work [38] uses the same approach, and we reused it in PSI. When an address is not found in the translation table, that indicates an attempt to transfer control to an invalid destination, which will be blocked by PSI. We point out BinCFI’s address translation approach is modular, and is performed in two steps. In the first step, a global translation table (GTT), maintained by our modified loader, is used to translate the upper 20-bits of an address to the entry point of a module-specific translation table (MTT) routine. This MTT, which is generated at the time the module is transformed by PSI, uses the remaining bits to look up the corresponding address in the transformed module.
3.
System Overview
PSI instruments executables as well as all of the shared libraries used by them. On each invocation, PSI takes a binary file (executable or library) as input, and outputs an instrumented version of this binary. This invocation may occur before execution, or on-the-fly during program execution. Figure 1 shows the architecture of PSI. It consists of three main components: a binary analyzer, an instrumentor and a binary generator. The binary analyzer takes a binary as input, disassembles it, and then constructs a control-flow graph. This control-flow graph becomes the input for static analysis and instrumentation components.
Instrumentation Tools System Call Policy
Shadow Stack (return Stack)
profiling Basic Block Counting
debugging
library loading policy
optimization more …...
Binary Instrumentation API
Binary Rewriter
disassembly checker
Static analyzer
Binary analyzer
generic instrumentation
ELF binary layout Controller
address translation
Binary generator
Instrumentor
Target Binary
ELF Metad ata
Original Code
Original Data
New Code & Data
Figure 1. Architecture Overview of PSI The heart of PSI is the instrumentor, which provides an expressive API for static binary instrumentation. Two levels of API are supported. The low-level API operates at the instruction level, and supports operations for inserting assembly language snippets at desired points. The high-level API allows insertion of calls to instrumentation functions that may be written in a language such as C. This code is compiled into a shared library, and our platform ensures that these functions can be called in a secure manner from (and only from) the calls inserted using the high-level instrumentation API. This API is further described in Section 3.2. PSI uses the address translator from BinCFI [38], but its behavior can be modified using the instrumentation API. The actual task of instrumentation is performed by instrumentation tools, which are programs that use the API provided by the platform to instrument applications and the libraries used by them. Our API not only allows tools to control the instrumentation phase, but also other phases such as static analysis, address translation, etc. This allows instrumentation tools to enhance these phases. 3.1
Non-bypassable Instrumentation
PSI ensures that the added instrumentation is non-bypassable by enforcing the following properties. • All direct and indirect control-flow transfers made from the original code must target instructions in the original code that were validly disassembled by the disassembler. • If a snippet was specified for insertion before an instruction I, then all (direct or indirect) control-flow transfers targeting I will instead be made to target the first instruction of the added snippet.
• Only the added instrumentation code can transfer control
• using race conditions. Untrusted code may use data races
to libraries containing instrumentation support functions. (Recall that the high-level instrumentation API relies on inserting calls to this library.) All indirect branches, including jumps, calls and returns, are checked at runtime to ensure the above properties. Direct branches are checked at the time of generating the instrumented binary. In addition to the above, our loader denies requests for loading uninstrumented libraries. If on-demand instrumentation option is turned on, the request isn’t denied; instead, an instrumented version of the library is generated and loaded. The above properties overlap with coarse-granularity CFI that limits control transfers to instruction boundaries. Specifically, we have enhanced such a CFI property with additional restrictions intended to protect the integrity of added instrumentation, as well as to deal with problems such as runtime loading of libraries, disassembly problems, etc. Our platform is geared for instrumenting benign applications — applications that may contain vulnerabilities, but are not malicious themselves. For such applications, these checks ensure that control-flow cannot “escape” instrumentation. A non-exhaustive list of attacks prevented by PSI is as follows. • Branching to data segments. As described above, the list of valid targets can only include addresses within validly instrumented code. Thus, data segments cannot appear in this table of valid targets.
to carry out time-of-check-to-time-of-use attacks on policies enforced by PSI, such as system call policies. • subverting the loader. By subverting the loader, untrusted code may be able to load and execute uninstrumented libraries. All of these threats can be addressed by isolating the memory used by the instrumented applications, using a technique such as software fault isolation (SFI) [32]. However, memory isolation incurs significant additional costs, and hence is typically not enabled on most instrumentation platforms, including most DBI platforms.
• Branching to code sections that were not recognized and
instrumented. If the disassembler fails to recognize some code fragments, they won’t be instrumented. However, since branch targets are restricted to be valid instruction boundaries in disassembled code, any attempt to execute undiscovered code will be blocked. • Branching to middle of instructions. ROP attacks are a
prime example here. Since the targets are checked to be valid instruction boundaries, these attacks are stopped. • Bypassing the instrumentation code. As noted above, if an
instrumentation snippet was specified for insertion before an instruction, that instruction is no longer permitted to be a branch target. • Corrupting the integrity of instrumentation logic by jump-
ing into its middle, or by accessing functions intended to be used exclusively by instrumentation. As noted above, branches will be checked to preclude these targets. Threats posed by untrusted code. Instrumentation of untrusted (and potentially malicious) applications can be supported, but it requires more extensive (and expensive) checks on instrumented code. Specifically, untrusted code can attempt to subvert PSI using one of the following means: • corrupting PSI data. Untrusted code could intentionally corrupt data used by PSI instrumentations.
3.2
Instrumentation API
Our platform provides a simple API for custom instrumentation of binaries. This API is designed to operate at roughly the same level of abstraction as Pin and DynamoRIO. However, being a static rewriting tool, all instrumentation operations occur in one shot on our platform: the entire CFG for a binary is presented to the code instrumentor, which traverses the CFG and adds all the desired instrumentation. This contrasts with DBI tools where instructions and basic blocks are discovered one by one, just before their first execution, and the code instrumentor invoked separately on the newly discovered basic block. After disassembly, PSI constructs a control-flow graph (CFG) of the program. The nodes in the CFG are basic blocks, each of which consists of a sequence of instructions. All incoming control transfers into a basic block go to its first instruction, while all control transfers out of the block occur on its last statement. Note that every indirect control flow target computed by our static analysis is considered in defining these basic blocks. Since this analysis estimates a superset of possible indirect targets, the basic blocks computed by our technique can be smaller than those computed by a compiler. The entire CFG can be accessed using the API function getCFG, while the list of all basic blocks and instructions can be obtained using the functions getBBs and getInsns. The API also provides operations to iterate through instructions and basic blocks in a CFG, and instructions in a basic block. Also supported are operations to examine instructions. These operations are based on the Intel’s xed2 instruction encoder/decoder library. Some of the most commonly used operations are isCall, isRet, isTest, isSysCall, isMemRead, isMemWrite, getTarget, and getSrc. Insertion of Assembly Code Snippets. Instrumentation can be performed at a low or high level. At the low level, an instrumentation snippet is inserted as follows: ins snippet(target, location, snippet) Here, target is a reference to an instruction or a basic block, and is specified using a reference to the corresponding object, or by using a label. The parameter location is one
of BEFORE or AFTER, and snippet is a string consisting of assembly code that is to be inserted. For call instructions, one extra location AFTER CALL is defined. To ensure transparency of return addresses on the stack, a call is translated into a push instruction that pushes the original return address, followed by a jump that transfers control to the target function. AFTER CALL corresponds to the point between push and jump. Instead of inserting additional instrumentation, some applications may require replacement of existing instructions. This is done using the following API function: replace ins(target, new snippet) Instruction emulation is a purpose for which this API function comes handy: we replace the original instruction with a snippet that emulates it. PSI provides a private thread local storage (TLS) area that can be used by assembly snippets to store their data. This private TLS, which is independent of the one used by glibc, is organized into two arrays TS and GS that are both initialized with all zeros. The size of these arrays is configurable, but they default to one memory page. Snippet code can use the identifiers TS n and GS n to access the nth word of the arrays TS and GS respectively. Example uses of these arrays can be found in Figures 2 and 3. Insertion of Calls to Instrumentation Functions. The benefit of the snippet API is that it can be more efficient since the instrumentation writer can minimize the number of instructions executed. Its downside is that instrumentation has to be performed in assembly, and that it is more complex. In contrast, the higher level API simplifies instrumentation but is generally less efficient. It enables the insertion of calls to handler functions in a shared library defined by the instrumentor. Several low level details are handled automatically by the high-level API. These include saving/restoring of registers and flags, switching to a different stack, resolving the symbolic name of the user-defined handler function, making the program state available through a high-level data structure called Context, and so on. These factors simplify the instrumentation task, and allows the handler code to be written in higher level languages (currently, C/C++). This API is accessed using the following function: ins call(target, location, name, args) Here, target and location have the same meaning as the snippet API. The name of the function to be invoked is specified using the string parameter name. This function should have the following prototype: void handler(struct Context ∗c, . . .) It takes a first parameter that represents the runtime context of the instrumented program, including all of the CPU registers, stack, etc. The subsequent parameters are exactly those that were included in the args parameter to ins call.
Controlling Address Translation. As described earlier, address translation instrumentation, which regulates ICF transfers, is automatically added by our platform. We provide some API functions so that an instrumentation developer can exercise finer control over ICF transfers. These functions can be used by an instrumentation tool that implements a more sophisticated ICF target analysis to further restrict indirect branches. Even without performing more static analysis, an instrumentation tool may enforce a more restrictive policy, e.g., • all returns should go to instructions following calls • (some or all) indirect jumps should not target addresses outside the current module These restrictions can be specified using the API function: rm indirect target(src addrs, target addrs) The argument src addrs is a list of the labels of the ICF transfer instructions whose targets should be restricted. If it is empty, then the operation is applied to all ICF transfer instructions in the module. The second argument is also a list of labels, but may include a special label N ON LOCAL that causes non-local addresses to be deleted from the list of valid targets. Custom address translation instrumentation can also be used to relax a previously specified policy. This is done using the following API function: add indirect target(src addrs, target addrs) Any number of rm indirect target and add indirect target calls may be made. The platform will keep track of possible targets for each source address, and will generate a unique address translation trampoline for each set of source addresses that share the same set of possible targets. Runtime event handling. Finally, the API supports registration of instrumentation functions that will be called when certain events occur at runtime, such as program/thread startup or exit, loading of libraries, and system calls: • register pre syscall handler() • register post syscall handler() • register library load handler() • register thread start handler() • register thread terminate handler() • register program start handler() • register program terminate handler() These API calls take a function name as their argument. Development of Instrumentation tools. To develop an instrumentation tool, user provides the tool code, and optionally, a client library. The tool code uses the API provided by our platform to realize an instrumentation tool. Tools that use the high-level API need a mechanism to provide the definitions of function calls inserted using that API. This is the role of the client library. Note that the tool code is used at
the time of instrumenting a binary, whereas the client library functions are used during the execution of the instrumented applications. This is why tool code is separated from the client library. The instrumentation tool code should be stored in a source file, say, bbcount.c. To instrument a binary file xyz, the tool developer will first compile this into a shared library, and then apply it to the binary. Specifically, the following sequence of commands is used for developing a instrumentation tool using the low-level API: psic −o bbcount.so bbcount.c psi_loader -t bbcount.so -- xyz If a high-level API is used, the client library needs to be compiled first. At runtime, calls made by instrumentation to client library functions need to be resolved. In principle, resolving a client function name is straight-forward: use the standard C-compiler to produce a shared library from the client library source, and include this library in the dependency list for the instrumented binary. However, such an approach will violate our security requirement because client library functions would be callable by original code. Instead, we want these functions to be callable only from the added instrumentation. To satisfy this requirement, we have developed a dedicated symbol resolution technique for resolving function names in the client library. To resolve client functions, the basic idea is to create a global address table (GAT) that contains the memory locations where the client functions have been loaded. To simplify the look-up process, we translate function names in the client library to integer indices. This enables GAT to be a simple array indexed by these integer indices. A mapping file specifying a name-to-index mapping is generated during the compilation of the client library: psic −m bbclient.map −o bbclient.so bbclient.c Now, this mapping file will be used by the instrumentor to translate calls to client library functions made in the instrumentation code. The mapping file is also used by our modified loader, which uses this mapping to populate the GAT. Specifically, for each function f defined in the client library, the loader finds its index if from the mapping file, and stores the location where f is loaded in GAT[if ]. After populating GAT, it is made read-only. In addition, none of the locations in the client library are ever added to the translation tables. These two steps ensure that code in the client libraries can never be invoked by the original code. Resolution of the variable names could be accomplished in a similar way with the help of another GAT and a corresponding name-to-index mapping. 3.3
is run, and create instrumented version of these libraries. This is a difficult task, since many libraries are loaded long after program execution begins. Some of these libraries may reside at user-specified locations known only at runtime. In order to support seamless instrumentation of such libraries, our platform provides an option to generate instrumented libraries on-the-fly. In particular, we modified the loader to support an option to specify a configuration file that is consulted when an instrumented application requests to load an uninstrumented library. (If this option is not specified, then any request to load an uninstrumented library will be denied.) This configuration file must specify the name of the libraries containing the tool code, client library code, and the mapping file. The loader will then invoke PSI to create an instrumented version of the uninstrumented library, and then load this version. Instrumented libraries are stored in a disk cache for subsequent uses. This cache can store multiple versions of the same library, each corresponding to a different tool. In principle, PSI could be deployed on a system-wide basis, and use a shared cache across all users. However, currently we rely on a simpler scheme that uses a per-user cache. The cache is simply a directory owned by the user, say, /var/psi/bob/. When the loader is asked to load a library, say, /usr/lib/ abc.so by a process instrumented with a tool bbcount and owned by bob, the loader concatenates the library name to the cache location, i.e., looks for the file /var/psi/bob/bbcount/usr/lib/abc.so. If found, this file is loaded. If not, the loader invokes psi to instrument /usr/lib/abc.so with the tool bbcount and stores this result in the cache, and loads the instrumented version from the cache. Note that libraries with the same instrumentation but with different compilation options or client libraries may cause compatibility problems. To avoid these, the loader checks the library version, compilation options, as well as the client library version. It also checks the timestamps on the tool code and client library code, and if they are newer than the cached version, then a new, instrumented version is generated and the copy in the cache is updated. On-demand instrumentation can be applied to executables as well, and serve to support seamless instrumentation of applications that involve running multiple executables.
4.
Instrumentation Applications
We illustrate the API described in the preceding section using several examples. These examples illustrate the flexibility, versatility and the ease-of-use benefits of PSI.
On-demand Instrumentation
One of the drawbacks of a purely static instrumentation approach is that the user has to compute the list of all shared libraries that may be used when an instrumented program
4.1
Basic Block Counting
Basic block counting has been used to illustrate previous DBI tools such as Pin and DynamoRIO. Moreover, an op-
unopt = “mov%eax, TS 0; lahf; incl TS 1; sahf; mov TS 0, %eax” opt = “incl TS 1” foreach bb in getBBs() { f ound = false foreach insn in bb { if isTest(insn) or isCmp(insn) { f ound = true ins snippet(insn, BEFORE, opt) break } } if !f ound ins snippet(bb, BEGIN, unopt) }
Figure 2. An instrumentation tool for Basic Block Counting timized version of this tool is available for these platforms, thus providing a good basis for performance comparison. For this reason, we illustrate our platform and API using this example. (See Figure 2.) The core of the instrumentation is to increment a memory location. However, since this operation affects CPU flags, it is necessary to save and restore them. This is performed in the snippet unopt. It would be safe to avoid flag save/restore, and use the optimized snippet opt, if the flags aren’t live at the snippet insertion point. To simplify the example, we avoid a general liveness analysis. Instead, we find two common instances of instructions that set the flags, namely, test and cmp, and insert the increment instruction just before them. For brevity, we have omitted the code for printing results. This can be done by registering a thread termination handler that will accumulate the count from thread-local TS 1 into a global location, say, GS 1. Finally, a program termination handler needs to be registered that prints the value of GS 1. 4.2
System Call Policy Enforcement
System call policy enforcement is a well-known protection technique for sandboxing. Our platform provides a simple API to enforce system call policies. Performance overheads are minimal, comparable to library interposition. At the same time, it provides security comparable to ptrace, a much heavier-weight mechanism used in tools such as strace. System call policy enforcement is implemented by registering system call event handlers register pre syscall handler() and register post syscall handler(). Our platform is able to identify system calls that use int 0x80 mechanism as well as the faster method that uses the sysenter instruction. The handler function can use its Context argument to determine system call arguments, which are stored in registers. The handler can examine and/or modify these arguments.
4.3
Library Load Policy Enforcement
Unsafe library loading is a well known strategy employed by security exploits to circumvent injected code defenses such as those that prevent execution of data. A library loading policy is implemented using a tool that registers a handler for the event register library load handler(). The handler can then examine the name of the library being loaded, and disallow it if need be. In our tool, rather than enforcing a policy, we simply logged a message that can be processed subsequently to identify how many libraries are loaded by an application, and what fraction of them are loaded after the application begins execution. We used this tool to on a collection of commonly used command-line and GUI applications and found that a significant fraction of libraries (specifically, over 40% in this experiment) were loaded after the commencement of application execution. 4.4
Shadow stack
Shadow stack [27] is a well-known technique for defending against return address corruption. The idea is to maintain a second copy of return addresses on a “shadow” stack, and check the two copies for consistency before each return. Successful exploits now require both copies of the return address to be compromised, which is harder than circumventing protection mechanisms such as stack canaries. Binary based return address defender [27] was the first to use binary instrumentation to implement shadow stacks. It inserts additional code at function prologue and epilogue to respectively push and check return addresses on shadow stack. While their approach is useful against buffer overflow attacks on return addresses, they are not effective against ROP attacks that mainly use unintended return instructions, as there will be no shadow stack checks preceding such “instructions.” Note that the initial exploit can be triggered without compromising a return address, e.g., by corrupting a function pointer. ROPdefender [12] addresses this weakness using DBI. As DBI techniques ensure instrumentation of all code before execution, their approach will instrument unintended returns as well, and hence prevent ROP attacks. We compare the performance of their implementation, which is based on Pin, with our platform. For this purpose, we developed the shadow stack instrumentation tool shown in Figure 3. Our implementation emphasizes ease of development and compatibility with legacy software, and we did not make any significant effort at optimizing it. Thus, our performance results reflect the performance strengths of our platform, rather than the efficiency of our instrumentation tool. Note that being a static instrumentation technique, our technique will not instrument unintended return instructions. However, our runtime checks on indirect targets will stop any attempts to jump to such instructions. Moreover, attacks aimed at evading shadow stack checks, such as those based
push shadowstk = “ mov %eax, TS 0; mov %ebx, TS 1; subl $4, TS 2; mov TS 2, %eax; mov (%esp), %ebx; mov %ebx, (%eax) mov TS 0, %eax; mov TS 1, %ebx;”
foreach insn in getInsns() if isCall(insn) { ins snippet(insn, BEFORE, chk init shadowstk) ins snippet(insn, BEFORE, push shadowstk) } else if isRet(insn) ins call(insn, AFTER CALL, check return)
Figure 3. Shadow Stack Defense on jumping into the middle of (or past the end of) checking code will be defeated as well. In Figure 3, the shadow stack could be initialized at the time a new thread is spawned. However, we opted for a simpler (but less efficient) approach where the validity of shadow stack is checked on each call instruction, using chk init shadowstk. This snippet uses another support function to allocate a shadow stack if it is not already set up. Once the shadow stack is in place, push shadowstk is used to push a copy of the return address to the shadow stack. Checking the integrity of returns is more complex, so we use a high-level function to perform this action. Note that uses of longjmp can cause a mismatch between shadow and main stack. This occurs because stack frames have been popped off the main stack. The solution to this problem, used in previous works [12, 27], is to successively pop off entries from the shadow stack until the two match. However, if the bottom of shadow stack is reached, that implies an attack, and the program is aborted. As noted by the authors of ROPdefender, real-world programs introduce a few benign violations of shadow stack checks, and these need to be handled. We already described how violations due to longjmp are handled. Other violations occur due to lazy binding used by the dynamic loader, the occurrence of C++ exceptions, UNIX signals, and System V thread context switches due to functions such as setcontext and getcontext. The core idea used in
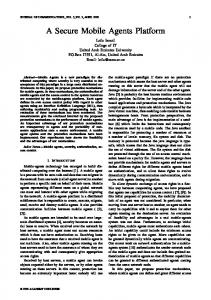
300 275 250 225 200 175 150 125 100 75 50 25 0 -25
PSI DynamoRIO + -inline + eflags analysis Pin + fast_analysis
e 3 ag nx er hi av .sp 2 m 48 .lb ray 0 v 47 .po lex 3 p 45 .so d 0 m 45 .na 4 ilc 44 m r 3. ta p 43 .as netp 3 f 47 .om 4re um 1 6 t 47 .h2 uan 4 q 46 .lib g 2 n 46 .sje mer 8 45 .hm mk 6 b 45 .go 5 cf 44 .m 9 c 42 .gc 2 h 3 ip c 40 .bz lben 1 r 40 .pe 0 40
check return(Context∗ctxt) { shadow sp = ctxt−>T S[2] ret = getmem(ctxt−>ESP ) while !empty(shadow sp) if (pop(shadow sp) == ret) { ctxt−>T S[2] = shadow sp return } abort() }
% Overhead
/* shadow stack pointer is stored in TS 2 */ chk init shadowstk= “ cmp $0x0, TS 2; jnz L001; call $alloc stack; L001: ”;
Figure 4. Overhead of basic block counting application of PSI, DynamoRIO, and Pin on SPEC 2006.
ROPdefender is that of recognizing which return instructions in the binary cause these exceptions (each of them occur within a specific routine in the loader or libc), and modifying the instrumentation of those instructions. We used the same idea in our implementation, but have omitted the details to conserve space.
5.
Experimental Evaluation
5.1
Basic block counting on SPEC2006
Our instrumentation tool incorporates a simple optimization to skip flag saving in some common cases, but lacks a systematic liveness analysis. In spite of lacking this optimization, performance of PSI (average overhead of 69%) is only a slightly worse than DynamoRIO (53%), and better than Pin (97%). The result is shown in Figure 4. For this experiment, we used the most optimized version of basic-block counting applications distributed with Pin and DynamoRIO platforms. Although PSI is designed for offline instrumentation, we turned on the on-demand instrumentation feature, emptied the library cache and reran the benchmark. In addition, we added back the time for instrumenting the executables to the totals. In this way, we can measure the total runtime that includes instrumentation time. This change causes the overhead to increase by another 3%. 5.2
Performance of shadow stack application
Figure 5 depicts the overhead of the shadow stack implementation using our platform in comparison to that of ROPdefender, which is based on Pin. While ROPdefender reports an overhead of 74%, PSI incurs just one-fourth of this overhead (18%).
% Overhead
% Overhead
Shadow Stack (PSI) ROPdefender (Pin)
255 240 225 210 195 180 165 150 135 120 105 90 75 60 45 30 15 0 -15
Figure 5. Overhead of shadow stack implementation using PSI and that of ROPdefender on SPEC 2006
Prasad et al [27] report lower overheads, as low as a few percent. But as mentioned earlier, their technique does not defend against ROP attacks. 5.3
Evaluation of system call policy
On SPEC 2006 benchmark, our baseline system call policy enforcement introduced an average of 1.6% overhead. This is with a policy function registered for each system call, but the function body being empty. 5.4
Microbenchmark Evaluation
Although DynamoRIO performs well on CPU-intensive SPEC2006, real world programs can often exhibit different characteristics. To compare PSI with DynamoRIO and Pin for workloads that are system-call intensive, we used the lmbench [1] benchmark. Since lmbench (as well as the real-world evaluation in the next section) cause some DBI platforms to slow to the point where experiments take far too long to complete, we used the null instrumentation in these experiments to minimize their runtime. Figure 6 shows the lmbench performance numbers. Note that the histogram is drawn to logarithmic scale on Y axis. The average system call overhead for PSI is 16.9%, whereas for DynamoRIO it is 312%, and for Pin it is 3300%. On system calls related to communication, PSI achieves almost native performance, whereas DynamoRIO has 36.1% overhead, and Pin has 378%. System calls related to signal handling and process spawning slow down PSI by 43.3% and 79.7% respectively, which increase to 222% and 948% for DynamoRIO, and 104x and 198x for Pin. To summarize, the average overhead across the tests shown in Figure 6, while counting only one of the select operations (for 10 fds), is 33% for PSI (geometric mean:
PSI DynamoRIO
Pin
sh n/ bi ve +/ c rk xe fo k+e it ad r x fo +e rhe rk e fo -ov tall g s Si in fd g- p Si tc fd 0 p 50 tc fd 0 p 25 tc fd 0 10 tcp 10 fd 0 50 fd 0 25 fd 0 10 fd 10 n e op t ta fs t a st te ri w d a ll re ca s sy
e ag x3 er in av sph 2. 48 lbm 0. d 47 nam 4. c 44 mil 3. ar 43 ast ref 3. 4 m 47 h26 ntu 4. ua 46 libq 2. ng 46 sje er 8. m 45 hm k 6. m 45 gob 5. f 44 mc 9. 42 gcc 3. p2 h 40 bzi enc 1. lb 40 per 0.
40
32768 16384 8192 4096 2048 1024 512 256 128 64 32 16 8 4 2 1
Figure 6. lmbench microbenchmark result 30%), while for DynamoRIO it is 413% (geometric mean: 309%) and for Pin it is 7873% ( geometric mean: 4083%). DBI platforms are complex, and hence the reasons for their high overheads on lmbench (and the real-world applications discussed in the next section) aren’t all obvious. But we can identify several factors that contribute to the high overhead. First, and most obvious, is that runtime disassembly and instrumentation incurs nontrivial overheads, unless this cost is amortized across many executions of instrumented code. Such amortization occurs on CPU-intensive benchmarks, but the real-world applications discussed in the next section tend to load much more code, and execute it far fewer times, thus causing the overheads of runtime instrumentation to rise significantly. This is one of the main reasons for the high overhead of applications that make frequent calls to execve. A second factor that contributes to the overhead is the increased memory footprint of dynamically instrumented programs. We have observed that DynamoRIO can frequently use a code cache that is over a 100MB in size. We have also observed that such increased use of data memory can significantly slow down fork due to factors such as the increased time for copying page tables. A third factor relates to threads and locking that is needed to ensure that accesses to data used by the DBI platform (including the code cache) are free of concurrency errors. 5.5
Performance on Real-world Applications
In this section, we compare the performance of PSI with that of Pin and DynamoRIO on a collection of commonly used applications. Once again we used the null instrumentation to minimize the runtime for the experiments. We first measured the performance for two tasks that are commonly undertaken by typical Unix users: compilation of software, and running scripts that invoke other programs.
DynamoRIO (%) 1922% 1376% 326%
Pin (%) 3509% 10250% 411%
211%
5292%
15153%
postmark gpg
2% 24%
22% 382%
64% 5994%
tar find scp
19% 21% -1%
79% 34% 18%
1107% 38% 31%
mplayer vim
32% 56%
67% 92%
211% 615%
latex
51%
185%
1806%
readelf
62%
71%
197%
python
33%
85%
96%
Average
53%
887%
3421%
Description Coreutils testsuite Compile openssh. Run command 5 times. Convert text and source code files to ps and pdf. a Run benchmark. Operate on pdfs with an avg size of 500KB. Tar /usr/include. Find a file in /. Copy 10 mp3s, with an avg size of 5MB. Play 10 mp3s. Search and replace strings in 18MB text file. Compile tex files with an avg size of 17KB to dvi. Parse the DWARF sections of glibc. Run pystone 1.1 benchmark.
a We
used a bunch of text files such that the their file sizes average to 8K. We used 2 types of source files for our purpose: C programs and Python programs. We averaged C file sizes from Openssl source package and used the same average of 18K for our test purpose. For Python, we averaged sizes of Python scripts found on a typical Ubuntu machine and used the same average of 8K for our test purpose.
Figure 7. Real World Program Performance Specifically, we compiled OpenSSH with GNU make and gcc tool chain, and used the built-in testsuite of coreutils. When testing gcc compilation with PSI, we instrumented all the executables in the gcc toolchain, including gcc, g++, cc1, cc1plus, f951, lto, ar, ranlib, as, ld.bfd, and collect2. We also instrumented make and all external tools used in makefile such as echo, sed, cat, perl, and gawk. Note that all libraries used by these programs were transformed too. The overhead incurred by PSI was 63%, while DynamoRIO and Pin incurred overheads of 1376% and 10250% respectively. In the case of coreutils, for PSI, we transformed all coreutils binaries as well as other programs used in the coreutils test suite. But due to difficulties in invoking DynamoRIO on each coreutils program inside the test script, we used DynamoRIO to run make so that it will subsequently instrument all programs invoked from there. DynamoRIO incurred a 19.2x slowdown, as compared to 97% for PSI.
70 65 60 55 50 45 40 35 30 25 20 15 10 5 0
Physical memory overhead Address space overhead
e 3 ag nx er hi av .sp 2 m 48 .lb ray 0 v 47 .po lex 3 p 45 .so d 0 m 45 .na 4 ilc 44 m r 3. ta p 43 .as netp 3 f 47 .om 4re um 1 6 t 47 .h2 uan 4 q 46 .lib g 2 n 46 .sje mer 8 45 .hm mk 6 b 45 .go 5 cf 44 .m 9 c 42 .gc 2 h 3 ip c 40 .bz lben 1 r 40 .pe 0 40
coreutils gcc apt − get update enscript
PSI (%) 97% 63% 2%
% Overhead
Program
Figure 8. Space overhead of PSI on SPEC 2006 When we tested Pin, unfortunately, the testsuite did not stop after running for over an hour. We stopped the experiment at this point, and used that figure as the runtime of Pin, which worked out to be 3509%. In addition to the above tests, we measured the overhead for several commonly used programs. The results are shown in Figure 7. It is worth mentioning that apt-get update invoked several executables including http, gpgv, dpkg and touch. All of the executables as well as libraries used were transformed in the tests. Note that for about half the applications, there is more than 10x difference between PSI and DynamoRIO. The difference drops down to 3x to 5x for about a quarter of the applications, and for the remaining, the overhead difference is within a factor of two. When averaged across all of the applications, PSI’s overhead was 53% (45% geometric mean), DynamoRIO’s overhead was 887% (322% geometric mean), and Pin’s overhead was 3421% (924% geometric mean). 5.6
Space Overhead
In addition to the runtime overhead on SPEC 2006 benchmark, we also measured the space overhead of our platform. Figure 8 describes the space overhead of our platform for SPEC 2006 benchmark. From the figure, the virtual memory overhead of our platform is 19.79%, while the physical memory overhead is merely 1.68%. In addition to the space overhead for physical and virtual memory, we also measured that our platform increased the on-disk size of the executables and shared libraries by around 139%. This is because PSI instruments a copy of original code, leaving the original code in place. However, this original copy is seldom accessed, which explains why the resident memory overhead is very small, at around 2%. In comparison, we also measured the space overhead of DynamoRIO and PIN. We discover that their address space
overhead is 272% and 72%. This is mainly because the DBI tools need to reserve address space for code cache allocation. The physical memory overhead is 7.5% and 34%, higher than our platform.
tation, namely, control-flow integrity. This instrumentation is hardcoded into the BinCFI platform, whereas this paper decouples the instrumentation platform for instrumentation tools. Another important contribution of this paper is a detailed performance comparison with DBI platforms.
6.
Binary Analysis Binary Analysis Platform [9] is a platform that targets COTS binaries, but its main focus is sophisticated analysis rather than efficient instrumentation. For example, they have developed interesting applications such as automatic exploit generation [5]. BitBlaze [31] is also targeting powerful static and dynamic analysis of binary code, including malware. These and other binary analysis works are complementary to ours: whereas their focus is on accurate and powerful analysis techniques, ours is on robust and efficient instrumentation.
Related Work
This section is aimed at discussing related works that have not already been adequately described earlier in this paper. Static Binary Rewriting A number of efforts in exploit protection and hardening of binaries have been based on static binary rewriting. However, supporting large and complex COTS binaries has proved elusive due to the twin challenges of accurate disassembly, and safe rewriting in the presence of embedded code pointers within binaries. To overcome the disassembly problem, most previous works have relied on a cooperative compiler [35], or worked on assembly code [6, 20, 24], or binary code containing symbol [18, 29], debugging [2, 14], or relocation information [36, 37]. SecondWrite [3] uses static binary rewriting to harden binaries, but applicability to large and complex binaries was not established. Recently, they showed that their platform can handle real world applications [4]. They develop powerful analysis and optimization techniques that provide excellent performance. However, this improved platform does not target security instrumentations that need to worry about low-level attacks such as return address corruption, or other attacks that may invalidate static analysis results. Several earlier works such as BIRD [21] and Dyninst [10] used a combination of analysis, compiler idioms and heuristics to disassemble binaries. BIRD further improves results by incorporating a runtime disassembly component. However, use of heuristics means that there could be disassembly errors, and these can lead to instrumentation subversion, e.g., by jumping to the middle of an instruction. In-place randomization [25] also has this same drawback, but mitigates it through randomization of the binary, which significantly reduces the likelihood of finding exploit code within the binary. However, in-place transformations are insufficient for instrumentation. Reins [33] targets sandboxing of untrusted COTS executables on Windows. Like us, they can also ensure that sandboxed code can never escape instrumentation (except to invoke certain trusted functions), but unlike our technique, their approach does not target instrumentation of all libraries used by the application. Moreover, their evaluation does not consider as many or as large applications as ours. PSI builds on our earlier BinCFI work [38]. In particular, we reused the disassembler and ELF-related tools developed in that work. The main focus of this paper is the development of a general-purpose platform for static binary instrumentation. We demonstrated the power and flexibility of this platform by developing a variety of security instrumentations. In contrast, BinCFI targets just a single instrumen-
Dynamic Binary Instrumentation As mentioned earlier, several DBI platforms [7, 8, 19, 22, 30] are currently available. Many of these, including DynamoRIO [8], Pin [19], Strata [30] and StarDBT [7] are geared for efficient support of light-weight instrumentation, while Valgrind [22] targets heavy-weight instrumentations, e.g., memory debugging. DBI techniques have formed the basis of many research proposals for hardening and securing COTS binaries. Program shepherding [17] enforces several low-level policies using DynamoRIO. Libdetox [26] improves on this work by supporting a more refined control-flow policy, including a shadow stack. They also provide an API for specifying customized system call policies. We also provide an easy-touse API for specifying system call policies, but in addition, provide a low-level instrumentation API as well, so as to ease the development of customized inline security checks. Whereas Libdetox targets vulnerable but benign code, Vx32 [15] uses DBI techniques to sandbox untrusted code. While PSI seeks to achieve many of the same goals of DBI platforms, in terms of the underlying techniques, PSI is mostly complementary to those of DBI: we emphasize static disassembly, static analysis and static transformation, whereas DBI tools excel in runtime disassembly, dynamic analyses and optimizations.
7.
Summary and Conclusions
DBI platforms have been popular for instrumentation of COTS binaries because of their ability to handle large and complex binaries, instrument all code, ensure that applications cannot escape instrumentation, and easy-to-use APIs. SBI techniques have complementary strengths, such as the ability to perform offline instrumentation and the ability to support more powerful static analysis techniques. Unfortunately, previous SBI platforms have lacked some of main features needed to support robust security-related instrumentations on large and complex binaries. The work presented in this paper demonstrates that indeed it is possible to realize the best of both worlds: PSI
retains most of the advantages of DBI platforms, while also providing the central benefits of static instrumentation. The resulting platform can thus retain most of the strengths of DBI and SBI, while mitigating their drawbacks. We illustrated the power of our platform and the simplicity of its programming model by developing several instrumentation tools. Among these is an implementation of efficient shadow stack defense that is resistant to ROP attacks. For many real-world usage scenarios, our platform achieves about an order of magnitude performance improvement over DBI platforms. Based on these results, we conclude that static binary rewriting can provide a powerful alternative to the popular dynamic rewriting platforms.
References [1] Lmbench tool for performance analysis. http://lmbench. sourceforge.net/. [2] M. Abadi, M. Budiu, U. Erlingsson, and J. Ligatti. Controlflow integrity principles, implementations, and applications. ACM TISSEC, 2009. [3] K. Anand, M. Smithson, A. Kotha, K. Elwazeer, and R. Barua. Decompilation to compiler high IR in a binary rewriter. Technical report, University of Maryland, 2010. [4] K. Anand, M. Smithson, K. Elwazeer, A. Kotha, and J. Gruen et al. A compiler-level intermediate representation based binary analysis and rewriting system. In EuroSys, 2013. [5] T. Avgerinos, S. K. Cha, A. Rebert, E. J. Schwartz, and M. Woo et al. AEG: automatic exploit generation. In NDSS, 2011. [6] T. Bletsch, X. Jiang, and V. Freeh. Mitigating code-reuse attacks with control-flow locking. In ACSAC, 2011. [7] E. Borin, C. Wang, Y. Wu, and G. Araujo. Software-based transparent and comprehensive control-flow error detection. In CGO, 2006. [8] D. Bruening. Efficient, transparent, and comprehensive runtime code manipulation. PhD thesis, 2004. [9] D. Brumley, I. Jager, T. Avgerinos, and E. Schwartz. BAP: a binary analysis platform. In CAV, 2011. [10] B. Buck and J. Hollingsworth. An API for runtime code patching. Int. J. High Perform. Comput. Appl., 2000. [11] P. Chen, H. Xiao, X. Shen, X. Yin, and B. Mao et al. DROP: detecting return-oriented programming malicious code. In ICISS, 2009. [12] L. Davi, A.-R. Sadeghi, and M. Winandy. ROPdefender: a detection tool to defend against return-oriented programming attacks. In ASIACCS, 2011. [13] K. ElWazeer, K. Anand, A. Kotha, M. Smithson, and R. Barua. Scalable variable and data type detection in a binary rewriter. In PLDI, 2013. [14] U. Erlingsson, M. Abadi, M. Vrable, M. Budiu, and G. Necula. XFI: software guards for system address spaces. In OSDI, 2006. [15] B. Ford and R. Cox. Vx32: lightweight user-level sandboxing on the x86. In USENIX ATC, 2008. [16] J. Hiser, A. Nguyen-Tuong, M. Co, M. Hall, and J. Davidson. ILR: where’d my gadgets go? In S&P, 2012. [17] V. Kiriansky, D. Bruening, and S. Amarasinghe. Secure execution via program shepherding. In USENIX Security, 2002.
[18] M. Laurenzano, M. Tikir, L. Carrington, and A. Snavely. PEBIL: efficient static binary instrumentation for Linux. In IEEE International Symposium on Performance Analysis of Systems Software (ISPASS), 2010. [19] C.-K. Luk, R. Cohn, R. Muth, H. Patil, and A. Klauser et al. Pin: building customized program analysis tools with dynamic instrumentation. In PLDI, 2005. [20] S. McCamant and G. Morrisett. Evaluating SFI for a CISC architecture. USENIX Security, 2006. [21] S. Nanda, W. Li, L.-C. Lam, and T.-c. Chiueh. BIRD: binary interpretation using runtime disassembly. In CGO, 2006. [22] N. Nethercote and J. Seward. Valgrind: a framework for heavyweight dynamic binary instrumentation. In PLDI, 2007. [23] J. Newsome. Dynamic taint analysis for automatic detection, analysis, and signature generation of exploits on commodity software. In NDSS, 2005. [24] K. Onarlioglu, L. Bilge, A. Lanzi, D. Balzarotti, and E. Kirda. G-Free: defeating return-oriented programming through gadget-less binaries. In ACSAC, 2010. [25] V. Pappas, M. Polychronakis, and A. Keromytis. Smashing the gadgets: Hindering return-oriented programming using inplace code randomization. In S&P, 2012. [26] M. Payer and T. Gross. Fine-grained user-space security through virtualization. In VEE, 2011. [27] M. Prasad and T.-c. Chiueh. A binary rewriting defense against stack based overflow attacks. In USENIX ATC, 2003. [28] F. Qin, C. Wang, Z. Li, H.-s. Kim, and Y. Zhou et al. LIFT: a low-overhead practical information flow tracking system for detecting security attacks. In MICRO, 2006. [29] P. Saxena, R. Sekar, and V. Puranik. Efficient fine-grained binary instrumentation with applications to taint-tracking. In CGO, 2008. [30] K. Scott, N. Kumar, S. Velusamy, B. Childers, and J. Davidson et al. Retargetable and reconfigurable software dynamic translation. In CGO, 2003. [31] D. Song, D. Brumley, H. Yin, J. Caballero, and I. Jager et al. BitBlaze: a new approach to computer security via binary analysis. In ICISS, 2008. [32] R. Wahbe, S. Lucco, T. Anderson, and S. Graham. Efficient software-based fault isolation. In SOSP, 1993. [33] R. Wartell, V. Mohan, K. Hamlen, and Z. Lin. Securing untrusted code via compiler-agnostic binary rewriting. In ACSAC, 2012. [34] R. Wartell, V. Mohan, K. Hamlen, and Z. Lin. Binary stirring: self-randomizing instruction addresses of legacy x86 binary code. In CCS, 2012. [35] B. Yee, D. Sehr, G. Dardyk, J. B. Chen, and R. Muth et al. Native Client: a sandbox for portable, untrusted x86 native code. In S&P, 2009. [36] C. Zhang, T. Wei, Z. Chen, L. Duan, and S. McCamant et al. Protecting function pointers in binary. In ASIACCS, 2013. [37] C. Zhang, T. Wei, Z. Chen, L. Duan, and L. Szekeres et al. Practical control flow integrity & randomization for binary executables. In S&P, 2013. [38] M. Zhang and R. Sekar. Control flow integrity for COTS binaries. In USENIX Security, 2013.