HHS Public Access Author manuscript Author Manuscript
Int J Min Sci Technol. Author manuscript; available in PMC 2018 January 01. Published in final edited form as: Int J Min Sci Technol. 2017 January ; 27(1): 83–90. doi:10.1016/j.ijmst.2016.09.032.
A practical application of photogrammetry to performing rib characterization measurements in an underground coal mine using a DSLR camera
Author Manuscript
Brent A. Slaker* and Khaled M. Mohamed Mining Engineer Ground Control Branch NIOSH, Office of Mine Safety and Health Research, Pittsburgh, PA, USA
Abstract
Author Manuscript Author Manuscript
Understanding coal mine rib behavior is important for inferring pillar loading conditions as well as ensuring the safety of miners who are regularly exposed to ribs. Due to the variability in the geometry of underground openings and ground behavior, point measurements often fail to capture the true movement of mine workings. Photogrammetry is a potentially fast, cheap, and precise supplemental measurement tool in comparison to extensometers, tape measures, or laser range meters, but its application in underground coal has been limited. The practical use of photogrammetry was tested at the Safety Research Coal Mine, National Institute for Occupational Safety and Health (NIOSH). A commercially available, digital single-lens reflex (DSLR) camera was used to perform the photogrammetric surveys for the experiment. Several experiments were performed using different lighting conditions, distances to subject, camera settings, and photograph overlaps, with results summarized as follows: the lighting method was found to be insignificant if the scene was appropriately illuminated. It was found that the distance to the subject has a minimal impact on result accuracy, and that camera settings have a significant impact on the photogrammetric quality of images. An increasing photograph resolution was preferable when measuring plane orientations; otherwise a high point cloud density would likely be excessive. Focal ratio (F-stop) changes affect the depth of field and image quality in situations where multiple angles are necessary to survey cleat orientations. Photograph overlap is very important to proper three-dimensional reconstruction, and at least 60% overlap between photograph pairs is ideal to avoid unnecessary post-processing. The suggestions and guidelines proposed are designed to increase the quality of photogrammetry inputs and outputs as well as minimize processing time, and serve as a starting point for an underground coal photogrammetry study.
Keywords Photogrammetry; Coal mining; Underground; Rib characterization
This is an open access article under the CC BY-NC-ND license (http://creativecommons.org/licenses/by-nc-nd/4.0/). * Corresponding author. Tel.: +1 412 3866546.
[email protected] (B.A. Slaker). Disclaimer The findings and conclusions in this report are those of the authors and do not necessarily represent the views of the National Institute for Occupational Safety and Health.
Slaker and Mohamed
Page 2
Author Manuscript
1. Introduction The stability of underground mine ribs has been a safety concern for underground coal mines for decades. Unfortunately, the average rib fatality rate has been about 1.3 per year between 1996 and 2013 [1]. In an effort to better understand coal rib behavior, photogrammetry is being investigated in this study as a measurement tool for surveying ribs in an underground coal mine environment.
Author Manuscript
Photogrammetry is a method of image measurement used to derive the shape of an object as determined from multiple photographs. Photographs themselves, being two-dimensional representations of three-dimensional space, have an inherent loss of information, but measurements can be inferred by analyzing the shape of an object with the relative camera positions [2]. This paper specifically deals with close-range digital photogrammetry (CRDP), which is typically limited to objects or scenes less than 100 m from the camera [3]. In recent years, the practice of photogrammetry has seen increased applications to research in underground mines, such as work characterizing fracture networks and establishing a pillar rating system, rock mass and support monitoring, and an assessment of pillar spalling in unstable limestone mine workings [4–9]. The use of this technology in underground coal mines has been severely limited, in large part due to the lack of Mine Safety and Health Administration (MSHA) approved options for photography equipment in the potentially explosive atmosphere. Additionally, the visible features in an underground coal mine are markedly different from those of other underground mines. The goal of this study is to determine what photogrammetry methodology, camera settings, and lighting scenario will work in an underground coal mine environment, considering the potential equipment limitations.
Author Manuscript
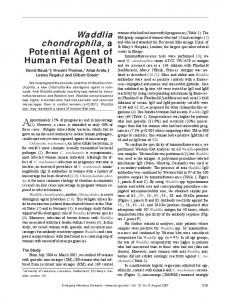
2. Experiment methodology Three sites were selected at the NIOSH Safety Research Coal Mine, shown in Fig. 1, to test the best methods for applying photogrammetry as a measurement tool for rib characterization in underground coal mines. The mine entries are approximately 4.3 m wide and average 2 m in height. Several objectives were identified: determining cleat orientation and spacing, measuring rib displacement, and performing routine length measurements. Ideally the measurements could be performed quickly and easily, so the experiments tested methods of photography that vary in data collection time and complexity.
Author Manuscript
A Nikon D5500 DSLR camera was used with an AF-S NIKKOR 35 mm 1:1.8G lens. This camera is not purposefully configured for photogrammetry. The following camera settings were common to all the experiments: fine image quality, 6000 × 4000 resolution, automatic bracketing, HDR off, automatic active d-lighting, auto white balance, standard picture control, automatic focus, autoarea (AF) mode, point metering, 0 flash compensation, and 0 exposure compensation. The settings that were changed on an experiment-specific basis, to compensate for lighting and depth of field changes, are detailed in their respective sections. Two lighting systems were independently investigated: the camera’s onboard flash and an external LED lighting system. The LED lighting system is currently under development by
Int J Min Sci Technol. Author manuscript; available in PMC 2018 January 01.
Slaker and Mohamed
Page 3
Author Manuscript
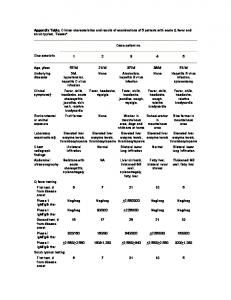
NIOSH for use in underground coal environments and consists of twelve small LEDs mounted to a singular circular frame with an attached handle. The LEDs are angled in a way to evenly distribute light across a coal rib. The even distribution of light allows the lighting system to be moved along with the camera without significantly changing the rib’s appearance. When necessary, cap lamp lighting was also used to allow the camera to automatically focus. 2.1. Site A The purpose of the Site A (Fig. 1) experiments was to obtain enough detail on a rib to measure cleat spacing and orientation. This was attempted using both the onboard flash for the Nikon camera and the external NIOSH LED lighting system. The camera settings used for each experiment at this location are shown in Table 1. All the reference objects used in these experiments are shown in Fig. 2.
Author Manuscript Author Manuscript
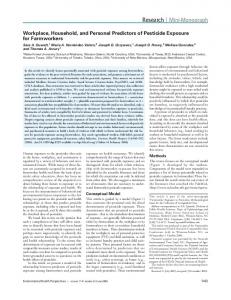
Using the Nikon’s onboard flash or an LED lighting system, hereafter called the LED lighting or simply LED, photographs were taken at varying heights and angles surrounding the corner of a pillar (Fig. 3). The perpendicular photographs were taken approximately 3 m from the rib, while the high-angle photographs were taken about 1.5 m from the rib. An area of rib visible in several of these photographs was selected for a measurement comparison between photogrammetry and traditional methods using six different features, labeled as M1 through M6. Most of these photographs were taken at an orientation perpendicular to the rib surface. However, several were taken at high angles-of-incidence to better capture the depth of the rib. These high angle-of-incidence photographs were taken at different F-stops to compare the changing depth of field focus. The shutter speed and ISO were adjusted to account for this change in light sensitivity. Additionally, a set of photographs was collected using an intentionally more haphazard approach without evenly spaced or angled photographs, with no regard for overlap, and using the camera’s automatic settings. This was done to emulate a casual approach where the camera operator is minimally instructed on an ideal photogrammetry methodology. The regimented sets of photographs required 21 min each to collect while the automatic settings method required only 3 min. 2.2. Site B The purpose of the experiment at Site B (Fig. 1) was to measure the coal rib displacement between photograph sets at varying lighting and distance conditions. For each of the conditions described, a set of photographs was collected prior to and after pieces of coal were removed from the photographed coal face. The camera settings used in this experiment are shown in Table 2.
Author Manuscript
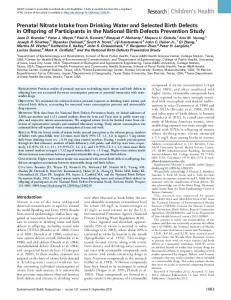
A close set of photographs at approximately 3–4 m from the face and a far set of photographs at approximately 7–8 m from the face were collected using both lighting scenarios. The camera locations as well as the features that were measured are shown in Fig. 4. At both locations the camera height was varied by 0.3 m. The distance from the face for the farther set was chosen as the minimum distance where the entire face is visible in each photograph. With a 35 mm lens that minimum distance was between 7 and 8 m. The close experiment required 4 min while the far experiment required 2 min.
Int J Min Sci Technol. Author manuscript; available in PMC 2018 January 01.
Slaker and Mohamed
Page 4
Author Manuscript
As shown in Fig. 4, the area of the rib that would be displaced is highlighted in red in the “before” photograph. 2.3. Site C
Author Manuscript
The purpose of the experiment at Site C (Fig. 1) was to determine how many photographs are necessary to adequately reconstruct a rib face. Ideally, as few photographs as possible would be taken to reduce data collection and processing time if more photographs being taken would result in insignificant changes to reconstruction accuracy. This experiment follows a methodology that is likely to be most practical when photographing long sections of mine travel ways because it consists of a simple, quick, and consistent procedure. Photographs of a 17.5 m length of rib were taken at approximately 4 m from the rib face, moving parallel to the rib approximately 0.3 m for each camera location, as illustrated in Fig. 5. Seven features are shown that were selected for measurement comparisons. The camera settings used in this experiment are shown in Table 3. Photographs were taken with both lighting conditions (flash and LED) and viewing angles perpendicular to the rib and camera positions following a line parallel to the rib. Capturing the entire roof-to-floor extent was not possible with a 35 mm lens and DX sensor. To correct for this, a line of photographs was taken angled slightly toward the floor and another line of photographs was taken angled slightly toward the roof. The roof photograph line was positioned approximately 0.3 m above the floor photograph line. Approximately 17 min was required to collect each of the flash and LED lighting sets.
3. Results Author Manuscript
Point cloud reconstructions were generated for all three sites using Agisoft Photoscan professional edition [10]. Agisoft Photoscan is a stand-alone software product that performs photogrammetric processing of digital images and generates 3D spatial data. Reference boards (Fig. 2) were used to scale the scenes. The scenes were initially reconstructed on an arbitrary coordinate system, using a corner of the board as the origin. This arbitrary coordinate system is sufficient for measuring lengths, but undesirable when time-lapse monitoring is being performed or geologic feature orientation is important. To address this common need, all the reconstructions were set to the same coordinate system by picking four (three are required, but more points reduce error) common features and assigning the same coordinates to each. The average error in the reference points ranges from 0.5 to 1.5 mm.
Author Manuscript
The measurements were made first in the software and later in the field. This approach allowed for marking measurement points on photographs and reproducing that measured length underground with more precision than would be possible by simply estimating locations or marking the rib. It should be noted that many features, such as a shale layer near the roof, have varying dimensions depending on where they are measured, and small changes in the measurement location may affect results. Efforts were made to pick the same location in all of the photogrammetric reconstructions; however, there is an error with manual picking due to imprecise point selection and the point cloud density, likely in the range of several millimeters for similar applications. Differences between tape or laser range
Int J Min Sci Technol. Author manuscript; available in PMC 2018 January 01.
Slaker and Mohamed
Page 5
Author Manuscript
meter measurements and photogrammetry measurements may be significant due to tape bending or sag, slight inconsistencies in measured location, difficulties in obtaining laser line-of-sight, and precision of the measuring device. These inconsistencies could range from less than one millimeter for shorter measurements to several centimeters for longer measurements. 3.1. Site A
Author Manuscript
Several features were selected for measurement due to their prominence and relevance to coal rib characterization. Most features are shown in Fig. 3, and their lengths are shown in Table 4. Additionally, a face cleat orientation at location M3 was calculated, and was compared to compass measurements. The face cleat orientation at M3 was measured with a Brunton compass and calculated by fitting a plane through three points manually chosen from the point cloud. The calculated dip was 89.24° and the measured dip was 89°. The calculated strike was 127.35° and the measured strike was 130°. The calculated angles are considered to be within the margin of error for the compass angle measurement method. Features M3 and M4 are cleat spacing measurements, and have among the highest margin of error when represented by a percentage of the total length. However, these results and those presented later suggest that the difference in measured and calculated distances is a function of errors that are minimally related to the magnitude of measurement span.
Author Manuscript
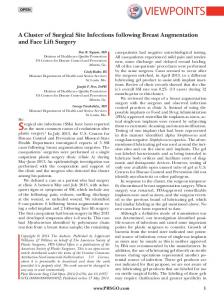
The automatic flash method did work for the reconstruction, but not reliably. The automatic flash method is distinctly different from the manual flash method, reported as “flash experiment” in Table 4, in that it allows the camera to select appropriate settings for controlling exposure. Several photographs were often discarded in the reconstruction process and required manual alignment. The two most probable reasons for this are the cap lamp obscuring sections of the photograph, as shown in Fig. 6, and the intentionally haphazard camera locations resulting in insufficient overlap. A cap lamp directed on the rib surface may be necessary when using an automatic focus, which can cause that part of the photograph to become overexposed. When using manual settings, the exposure can be changed to mitigate the effect of the cap lamp. It may also be beneficial, regardless of method, to reduce the cap lamp intensity when an automatic focus is being used.
Author Manuscript
The F-stop setting becomes more relevant as the depth of field of the scene grows, as low Fstops will cause objects far from the focus to become blurred. This effect is highlighted in Fig. 7 where a segment of the photograph from the foreground is compared across two different F-stops. If the rib is the only subject, and photographs are being captured perpendicular to it, low F-stops may be used. If the roof and floor are also being analyzed, or high angle-of-incidence photographs are being taken, a higher F-stop will be necessary to improve the detail across the scene. This may not be immediately apparent when viewing previews on a camera underground, but will be obvious during post-processing. This effect is difficult to quantify, but comparing the reconstructions using the higher F-stop and lower F-stop, the higher F-stop point cloud shows a higher-quality dense reconstruction with a larger reconstructed area. As shown in Fig. 7, photograph segments are both natively 480 × 560 pixels, from the foreground of a 6000 × 4000 pixel image. Int J Min Sci Technol. Author manuscript; available in PMC 2018 January 01.
Slaker and Mohamed
Page 6
3.2. Site B
Author Manuscript
Five different features were measured and reported at Site B, including: entry width measurements (M1, M2, and M3), a reference plank measurement (M4), and a displacement depth measurement (M5), as shown in Fig. 4. These measurements were made for the far flash (FF), close flash (CF), far LED (FL), and close LED (CL) scenarios before and after coal was removed from the face to simulate spalling. Roof-to-floor measurements were also performed, but these were difficult to reproduce reliably in the photogrammetry due to a dip in the roof which blocked line of sight to the rib/roof intersection beyond. The variability of mine roof, floor, and rib geometries makes any comparison of dimensions only useful for determining changes in that surface.
Author Manuscript
Displacement magnitude is reported as one point, but each reported measurement consists of three points sampled in a horizontal line across the center of the displaced area, which were measured to obtain an average displacement. Additionally, three control points at the same height above the floor approximately 2 m away from the displaced area, where no change should have occurred, were measured in the same way. The irregular area that was created by removing coal from the face was difficult to measure in the field by hand, but an approximate depth measurement of 6 cm into the displaced area was made. This roughly matches the average displacements measured in photogrammetry shown in Tables 5 and 6.
Author Manuscript
The difference between the field and calculated distances for features M1, M2, and M3 are expected because the same point was not used for both measurements. The purpose of this comparison, then, is to determine if entry width measurements can be reasonably determined through photogrammetry. If tape measure or laser measurements are otherwise trusted, the magnitude and range of distances obtained through photogrammetry are reasonably similar, considering the natural variation in coal rib depth. First considering the control points, there is an inherent error to the photogrammetric measurements. This error is likely due to: reconstruction, orientation and scaling, point cloud density, and point selection precision. Reconstruction error will be dependent on the software and quality of input photographs. Most software packages will not allow significant modification of the underlying algorithms, so improving this source of error will require careful setting selection and ensuring that input photographs are acceptable. Orientation and scaling error can be minimized by choosing more reference points. Point cloud density is affected by the software and its settings, number of photographs, resolution of photographs, and distance to the subject. The point cloud density could have been increased in the Agisoft Photoscan software; however, this was not done, so as to maintain consistent reconstruction settings across all experiments.
Author Manuscript
Given the number of tests and closeness of the results, it is difficult to conclude definitively that there is a difference between the close-to-far and flash-to-LED scenarios; however, any difference appears to be small compared to the magnitude of typical convergence or displacements. An average absolute difference of 0.56 cm is observed between the close and far experiments, while an average absolute difference of 0.08 cm is observed between the flash and LED light scenarios. These measurements suggest that the difference between a
Int J Min Sci Technol. Author manuscript; available in PMC 2018 January 01.
Slaker and Mohamed
Page 7
Author Manuscript
consistent LED lighting and the camera flash is very small, with 0.08 cm being within acceptable limits for many underground measurements. One possible explanation for the larger difference of 0.56 cm is the ratio of camera-tocamera distance to the rib-to-camera distance, also known as the base/height ratio. As the height grows significantly larger than the base, the accuracy of resolving the rib depth is reduced [2]. The point cloud density may also be responsible for the difference in measurements because the distance being measured is point-to-point, which is illustrated in Fig. 8. Sparser point clouds are less likely to contain points at the precise location. The point cloud density on the rib is approximately 1,000,000 points/m2 for the close set of photographs and 130,000 points/m2 for the far set of photographs. 3.3. Site C
Author Manuscript
Seven features were evaluated at Site C (Fig. 5; Table 7). The ½ flash and ½ light data represent measurements from a reconstruction that excludes every other photograph from the original set. All of the features were chosen because they are easily identifiable in the photographs. The photographs from the two lighting scenarios, flash and constant LED, were subsampled to determine the minimum number necessary, which was a 50% reduction in this experiment. Anything less resulted in a loss of connectivity between the photographs and an incomplete reconstruction.
Author Manuscript
The resulting distance measurements are comparable to those found at the other sites with the exception of M1. Nothing in the photographs, photogrammetric reconstruction, or points selected indicates that there is an error associated with that calculated distance, and a difference of approximately 6 cm is outside the range of expected error. It is most likely that this feature was incorrectly measured or recorded in the field. Feature M7, the reference board, has a very similar calculated and measured length, which can also be seen in feature M6 in Table 4 and M4 in Table 5. This object has the highest field measurement precision because it can be handled, cannot be easily deformed, and can be repeatedly measured. The consistent overestimation of its length suggests a systematic scaling error of around 0.5%. A redundant number of photographs for the flash and LED lighting scenarios, 84 and 93 respectively, were captured. These were then reduced to determine the minimum amount of overlap required for a reconstruction, and the approximate distance that could be traveled between each photograph. Reducing the number of photographs by 50% appeared to yield the most consistent results. Reconstruction using fewer photographs was possible; however, it required more manual effort on the part of the researcher in post-processing, which is far less time-efficient than taking more photographs.
Author Manuscript
It was hypothesized that decreasing the number of photographs would decrease the precision of the results. After processing the photographs, the number of photographs appeared to negligibly affect the precision of measurements. Table 7 shows the measurements calculated for the full and reduced photograph sets. The differences found between the 50% photograph reduction and the full photograph set are similar to the differences found in the previous experiments, suggesting that the reduction in photographs does not introduce significant additional error. In the reduced photograph set, the percentage overlap between photographs
Int J Min Sci Technol. Author manuscript; available in PMC 2018 January 01.
Slaker and Mohamed
Page 8
Author Manuscript
varies between approximately 55% and 75%. Typically, overlaps of greater than 60% are ideal; however, increasing overlap will be necessary if the edges of the photograph are poorly exposed or out of focus. If photographs are taken using a similar approach to that described for Site C, a simpler method would be to ensure that every third photograph shares points with the two photographs preceding it.
Author Manuscript
Another noteworthy finding was the difficulty of obtaining level photographs. Counter intuitively, a tripod may decrease the consistency of the photographs, creating gaps in the reconstruction. The uneven floor, especially as the tripod nears the far rib, requires constant leveling to ensure orderly photographs. If the lighting condition permits a fast shutter speed, taking photographs by hand may be the optimal method. Level photographs are not essential, and any orientation may be used if it best suits the mine geometry, but it is typically easier to ensure sufficient overlap by orienting the long axis of the photograph with the long axis of the opening. 3.4. Exposure considerations Managing the camera exposure is one of the most important components of the photogrammetry survey. As shown in Figs. 6 and 7, the decision to use automatic camera settings or choosing the wrong settings can have a significant impact on photograph quality. Shutter speed, ISO speed, and aperture (specified by F-stop) are the most important settings for controlling exposure. In the practical experience of the authors, the following guidelines for camera settings should be applied in an underground coal mine environment:
Author Manuscript
1.
Shutter speed: a shutter speed faster than 1/60 s has been ideal for handheld photography with a 35 mm lens, while higher speeds are necessary with longer focal lengths and much lower speeds are acceptable with a tripod. A lower shutter speed will usually not have an effect on exposure when using the camera flash as a light source.
2.
Focal ratio: F-stop values should be set as high as lighting conditions allow. Most tests during this research were performed at an F-stop between 5 and 8 as a compromise between lighting and clearness of the foreground. Different lenses may perform optimally at different F-stops, and should be experimented with to find a focal ratio that provides the most image clarity. Lower F-stops are certainly usable, but care must be taken for photographs where the subject extends toward or away from the camera.
3.
ISO speed: lower ISO speeds are always preferable if lighting allows, with minimal graininess occurring in the 100–400 range.
Author Manuscript
As shown in Tables 1 and 2, a fully automatic camera setting may choose extreme F-stop and ISO values to compensate for the low light environment. If the camera allows, limiting the range of automatic settings will likely be beneficial. The values suggested previously should be loosely applicable to a wide range of cameras, but they will vary slightly depending on camera model and lens focal length.
Int J Min Sci Technol. Author manuscript; available in PMC 2018 January 01.
Slaker and Mohamed
Page 9
Author Manuscript
4. Conclusions A suite of experiments were performed at varying test sites to determine a strategy that best works for performing photogrammetry with a commercially available DSLR camera in an underground coal mine. These experiments were performed at the NIOSH Safety Research Coal Mine using a Nikon D5500 with a 35 mm lens. Three-dimensional reconstruction was performed using Agisoft Photoscan professional edition. Measurements were made from the reconstructed scene and those measurements were compared to measurements made in-mine with a tape measure and laser rangefinder.
Author Manuscript
Different factors were hypothesized to affect the measurement accuracy: lighting scenario, distance to subject, and overlap between photographs. There were seventeen experiment pairs where photographs were taken in the same manner using both LED and flash lighting. Changing the light condition between these two did not appear to cause a meaningful difference in measurement accuracy when using the LED lighting scenario or onboard flash lighting scenario. The average difference between flash and hand measurements was −0.07 cm with a standard deviation of 1.67 cm. The average difference between LED and hand measurements was −0.12 cm with a standard deviation of 1.67 cm. The average difference between flash and LED measurements was 0.05 cm with a standard deviation of 0.21 cm.
Author Manuscript
The distance to subject was tested in four different experiment pairs, all at Site B. Decreasing subject distance was found to increase the point density of the coal surface, due to a higher pixel density per unit area of the subject. The increased point density, however, did not significantly affect measurement precision at this photograph resolution. Given the physical constraints of an underground coal mine, it is likely that any modern DSLR camera will have a sufficient resolution at the maximum allowable perpendicular distance to a rib face for all but the smallest or most precise measurements. The overlap between photographs that is necessary for a three-dimensional surface to be reconstructed was indirectly tested at Site C. The overlap was inconsistent between photographs due to the uneven terrain, so an approximate required overlap was inferred. The linear distance between camera locations was approximately 0.3 m for the full sets, and 0.6 m for the half sets. There does not appear to be a fixed amount of overlap required between the photographs, but with similar entry geometries, 0.6 m between photographs at 5 m away from the rib would be ideal as a “good practice” guideline to allow for greater than 2/3 overlap in successive photographs.
Author Manuscript
Photogrammetry has been effective across a variety of camera settings, distances, and orientations, with the largest limiting factor being the amount of overlap between photographs. Differences between measurements from 3D reconstructions and hand measurements may serve to highlight the inaccuracy of traditional tape measure or laser measurements more than they show the inaccuracy of photogrammetry. Unfortunately, it would be difficult to quantify the error associated with more traditional measurements, as they will vary with the person performing them. As a result, this work is not intended to show the precision of photogrammetry, but rather to show that photogrammetry can be used in an underground coal mine environment and delivers comparable results to measurement
Int J Min Sci Technol. Author manuscript; available in PMC 2018 January 01.
Slaker and Mohamed
Page 10
Author Manuscript
techniques already being performed. Methodology and exposure guidelines presented here should be sufficient to perform a photogrammetry survey in most underground coal mining situations where DSLRs are approved for use.
References
Author Manuscript
1. Jones, T., Mohamed, K., Klemetti, T. Proceedings of the 33rd international conference on ground control in mining. Morgantown, West Virginia: 2014. Investigating the contributing factors to rib fatalities through historical aAnalysis; p. 113-22. 2. Luhmann, T., Robson, S., Kyle, S., Boehm, J. Close-range photogrammetry and 3D imaging. 2nd. Walter de Gruyter; 2014. 3. Atkinson, KB. Close range photogrammetry and machine vision. Dunbeath (Caithness, Scotland): Whittles Publish; 1996. 4. Styles, TD., Zhang, Y., Stead, D., Elmo, D., Robert, D., Yanske, T. Proceedings of 44th US Rock mechanics symposium and 5th US-Canada rock mechanics symposium. Salt Lake City, Utah: 2010. A photogrammetric approach to brittle fracture characterization in mine pillars. 5. Kim J, Kim D, Won K. Measurement of joint orientations of tunnel working face using a new photogrammetric technique. Proceedings of the 40th US symposium on rock mechanics. 2005 6. Petteri Somervuori ML. Modern 3D photogrammetry method for rock mechanics. Geological Mapping 3D Model and Documentation of Open Pit Faces and Tunnels. 2010 7. Benton DJ, Iverson SR, Martin LA, Johnson JC, Raffaldi MJ. Volumetric measurement of rock movement using photogrammetry. Int J Min Sci Technol. 2016; 26(1):123–30. [PubMed: 27110429] 8. Slaker B, Westman E, Ellenberger J, Murphy M. Determination of volumetric changes at an underground stone mine: a photogrammetry case study. Int J Min Sci Technol. 2016; 26(1):149–54. 9. Slaker B, Westman E, Fahrman B, Luxbacher M. Determination of volumetric changes from laser scanning at an underground limestone mine. Min Eng. 2013; 65:11. 10. AgiSoft LLC. Agisoft PhotoScan Professional Edition (Version 1.2.3). 2015. Retrieved from
Author Manuscript Author Manuscript Int J Min Sci Technol. Author manuscript; available in PMC 2018 January 01.
Slaker and Mohamed
Page 11
Author Manuscript Author Manuscript Fig. 1.
Study sites at the safety research coal mine.
Author Manuscript Author Manuscript Int J Min Sci Technol. Author manuscript; available in PMC 2018 January 01.
Slaker and Mohamed
Page 12
Author Manuscript Author Manuscript
Fig. 2.
Reference objects.
Author Manuscript Author Manuscript Int J Min Sci Technol. Author manuscript; available in PMC 2018 January 01.
Slaker and Mohamed
Page 13
Author Manuscript Author Manuscript
Fig. 3.
Camera locations at Site A along with a composite photograph containing the distances selected for measurement comparison.
Author Manuscript Author Manuscript Int J Min Sci Technol. Author manuscript; available in PMC 2018 January 01.
Slaker and Mohamed
Page 14
Author Manuscript Author Manuscript
Fig. 4.
Camera locations and photographs at site B showing the features selected for measurement comparisons.
Author Manuscript Author Manuscript Int J Min Sci Technol. Author manuscript; available in PMC 2018 January 01.
Slaker and Mohamed
Page 15
Author Manuscript Author Manuscript Fig. 5.
Author Manuscript
Camera locations at Site C along with a composite photograph containing the distances selected for measurement comparison.
Author Manuscript Int J Min Sci Technol. Author manuscript; available in PMC 2018 January 01.
Slaker and Mohamed
Page 16
Author Manuscript Fig. 6.
Exposure comparison for automatic and manual modes when using a cap lamp to focus.
Author Manuscript Author Manuscript Author Manuscript Int J Min Sci Technol. Author manuscript; available in PMC 2018 January 01.
Slaker and Mohamed
Page 17
Author Manuscript Fig. 7.
F-stop comparison using flash lighting.
Author Manuscript Author Manuscript Author Manuscript Int J Min Sci Technol. Author manuscript; available in PMC 2018 January 01.
Slaker and Mohamed
Page 18
Author Manuscript Author Manuscript
Fig. 8.
Example of high-density point clouds yielding more precise distance measurements.
Author Manuscript Author Manuscript Int J Min Sci Technol. Author manuscript; available in PMC 2018 January 01.
Slaker and Mohamed
Page 19
Table 1
Author Manuscript
Camera settings for Site A experiments. Experiment
F-stop
Shutter speed (s)
ISO
Number of photograph
Flash
5
1/100
100
62
Flash w/F-stop adjust
5, 8
1/30
100, 200
62
LED
5
1/6
400
62
LED w/F-stop adjust
5, 8
1/6, 1/2
400
62
Automatic
1.8, 2
1/60
800–6400
23
Author Manuscript Author Manuscript Author Manuscript Int J Min Sci Technol. Author manuscript; available in PMC 2018 January 01.
Slaker and Mohamed
Page 20
Table 2
Author Manuscript
Camera settings for Site B experiments. Experiment
F-stop
Shutter speed (s)
ISO
Number of photograph
Far flash (FF)
5
1/100
100
6
Far LED (FL)
5
1/4
400
6
Close flash (CF)
5
1/100
100
14
Close LED (CL)
5
1/4
400
14
Author Manuscript Author Manuscript Author Manuscript Int J Min Sci Technol. Author manuscript; available in PMC 2018 January 01.
Slaker and Mohamed
Page 21
Table 3
Author Manuscript
Camera settings for Site C experiments. Experiment
F-stop
Shutter speed (s)
ISO
Number of photograph
Flash
5
1/100
100
84
LED
5
1/3
400
93
Author Manuscript Author Manuscript Author Manuscript Int J Min Sci Technol. Author manuscript; available in PMC 2018 January 01.
Slaker and Mohamed
Page 22
Table 4
Author Manuscript
Length measurements of different coal rib features at Site A under different lighting conditions. Feature
Flash experiment (cm)
LED experiment (cm)
Field (cm)
M1
195.7 (+1.1%)
195.7 (+1.1%)
193.5*
M2
32.5 (+0.9%)
32.6 (+1.2%)
32.2
M3
5.9 (−11.9%)
6.4 (−4.4%)
6.7
M4
5.8 (−6.4%)
5.3 (−14.5%)
6.2
M5
61.6 (+2.7%)
61.6 (+2.7%)
60.0
M6
55.0 (+0.7%)
55.0 (+0.7%)
54.6
Note:
*
means that field measurement was performed with a laser instead of tape measure.
Author Manuscript Author Manuscript Author Manuscript Int J Min Sci Technol. Author manuscript; available in PMC 2018 January 01.
Author Manuscript
Author Manuscript
Author Manuscript 55.2 +1.1%
+0.5%
NM
+1.0%
54.9
−1.1%
437.l
+2.0%
+0.4%
54.8
+0.2%
443.0
+0.8%
436.5
+3.0%
446.6
FL
+0.9%
55.1
NM
NM
NM
CL
+0.5%
54.9
−1.2%
436.6
+2.8%
445.1
+1.9%
441.5
FF time 2
+1.1%
55.2
NM
+1.1%
437.5
+2.7%
445.2
CF time 2
+0.2%
54.7
−1.2%
436.8
+2.7%
444.4
+1.7%
440.7
FL time 2
+0.9%
55.1
−1.1%
437.3
+2.7%
444.6
+1.9%
441.5
CL time 2
54.6
442.0*
432.8*
433.4*
Field
means the field measurement was performed with a laser instead of tape measure.
*
Note: Time 2 represents the photographs taken after coal was removed from the rib; NM signifies that the measurement was not performed;
M4
M3
437.3
+3.2%
44l.5
+2.7%
M2
447.6
445.2
M1
CF
FF
Feature
Length measurements of different coal rib features at Site B under different lighting conditions (cm).
Author Manuscript
Table 5 Slaker and Mohamed Page 23
Int J Min Sci Technol. Author manuscript; available in PMC 2018 January 01.
Slaker and Mohamed
Page 24
Table 6
Author Manuscript
Depth of the induced displacement occurring at M5 (cm). Feature
FF to FF2
CF to CF2
FL to FL2
CL to CL2
M5
7.15
6.51
7.05
6.57
Control
0.23
0.14
0.21
0.06
Author Manuscript Author Manuscript Author Manuscript Int J Min Sci Technol. Author manuscript; available in PMC 2018 January 01.
Author Manuscript
Author Manuscript
Author Manuscript
M7
M6
M5
M4
M3
54.6 0
+0.4%
−38.5%
54.8
0.8
−38.5%
−15.8%
0.8
1.6
−15.8%
−5.6%
1.6
8.4
−4.5%
+0.6%
8.5
15.8
+2.5%
+0.5%
57.0
16.1
+0.3%
56.9
−15.3%
−15.3%
M2
32.7
32.7
Ml
LED
Flash
Feature
+0.4%
54.8
−15.4%
1.1
−21.0%
1.5
−4.5%
8.5
+2.5%
16.1
+1.1%
57.3
−15.3%
32.7
1/2 flash
+0.9%
55.1
−53.8%
0.6
−21.0%
1.5
−5.6%
8.4
+2.5%
16.1
+0.5%
57.0
−15.5%
32.6
1/2 LED
54.6
1.3
1.9
8.9
15.7
56.7
38.6
Field
Length measurements of different coal rib features at Site C under different lighting conditions and with different numbers of images at each site (cm).
Author Manuscript
Table 7 Slaker and Mohamed Page 25
Int J Min Sci Technol. Author manuscript; available in PMC 2018 January 01.