A practical technique for verification of three-dimensional conformal dose distributions in stereotactic radiosurgery J. L. Robara) and B. G. Clark The University of British Columbia, Department of Physics, BC Cancer Agency, 600 West 10th Avenue, Vancouver, British Columbia V5Z 4E6, Canada
共Received 27 October 1999; accepted for publication 9 February 2000兲 The trend toward conformal techniques in stereotactic radiosurgery necessitates an accurate and practical method for verification of irregular three-dimensional dose distributions. This work presents the design and evaluation of a phantom system facilitating the measurement of conformal dose distributions using one or more arrays of up to 20 radiographic films separated by 3.2 mmthick tissue-equivalent spacers. Using Electron Gamma Shower version 4 共EGS4兲 Monte Carlo simulation, we show that for 6 MV radiosurgical photon beams this arrangement preserves tissueequivalence to within 1%. The phantom provides 0.25 mm in-plane spatial resolution and multiple sets of films may be used to resample the dose volume in orthogonal planes. Dedicated software has been developed to automate the process of ordering and orienting of scanned film images, conversion of scanned pixel value to dose, resampling of one or more sets of film images and subsequent export of images in DICOM format for coregistration of planned and measured dose volumes. Calculated and measured isodose surfaces for a simple, circular-beam treatment agree to within 1.5 mm throughout the dose volume. For conformal radiosurgical applications, the measured and planned dose distributions agree to within the uncertainty of the manufacture of irregularly shaped collimators. The sensitivity of this technique to minor spatial inaccuracies in beam shaping is also demonstrated. © 2000 American Association of Physicists in Medicine. 关S0094-2405共00兲00205-4兴 Key words: stereotactic radiosurgery, dose verification, dosimetry, beam shaping, conformal, film
I. INTRODUCTION Stereotactic radiosurgery uses narrow, convergent photon beams or beam arcs to deliver accurately defined dose distributions to an intracranial lesion. The use of conventional circular beam collimation produces an approximately spherical or ellipsoidal dose distribution in the brain, which is spatially incongruent with irregularly shaped lesions. An improved degree of conformity has been achieved through the use of beam shaping with poured, cerrobend collimators1 and micro-multileaf collimation.2 Both the hardware and dose-calculation3 aspects of these more advanced techniques are relatively new. Uncertainties or inaccuracies arising from the mechanical beam shaping device and/or conformal dosecalculation algorithms would combine with previously existing sources of error inherent in target localization4,5 and treatment delivery,6,7 thus resulting in potential loss of overall accuracy in the radiosurgical treatment. Therefore, in the process of commissioning or quality assurance for such a system, dose verification through physical measurement is imperative. The set of criteria for a suitable dosimeter for measurement of three-dimensional conformal dose distributions is stringent. The dosimeter must offer a spatial resolution sufficient to detect errors in the location or shape of the distribution of the order of ⫾1 mm, the recommended8 spatial tolerance for radiosurgical dose delivery. The dosimeter must also be integrating 共to sum the dose from several beams or arcs兲 and must provide volumetric information since the dose distributions may be highly irregular in three dimen978
Med. Phys. 27 „5…, May 2000
sions. It should be possible to digitize the measured distribution, preferably by a means which is readily accessible, with sufficient signal-to-noise ratio to facilitate subsequent coregistration and comparison of planned and measured distributions. Finally, an ideal dosimeter should provide a record of dose which is consistent, reproducible 共at least within one batch for which calibration is performed兲, insensitive to environmental factors and stable over time. Most conventional dosimeters, including ionization chambers, diodes, diamond detectors and thermoluminescent dosimeters provide only point doses or one-dimensional measurements in a water phantom and therefore are inappropriate for this application. The use of radiochromic film, while offering approximate tissue equivalence and high spatial resolution for two-dimensional dosimetry, has been limited in the past by its high cost and spatial nonuniformities9 of up to 15%. While Fricke10–12 and polyacrylamide13–15 gel dosimeters provide the promising features of inherent tissue equivalence and three-dimensional 共3D兲 dosimetry, the combined cost of the dosimeter and the readout of the measured dose using MRI may preclude their use for the multiple dose measurements required for a rigorous commissioning and quality assurance program. In addition, although gel dosimeters offer very high inherent spatial resolution, the dose voxel size and signal-to-noise ratio are limited to that achievable using MRI.16 Radiographic film provides very high in-plane spatial resolution 共20 line pairs/mm兲, excellent signal-to-noise ratio with a low dose, may be digitized using standard scanning
0094-2405Õ2000Õ27„5…Õ978Õ10Õ$17.00
© 2000 Am. Assoc. Phys. Med.
978
979
J. L. Robar and B. G. Clark: A practical technique for verification
densitometers, is affordable and provides a stable record of optical density which can be converted to absolute dose using a sensitometric curve. While the accuracy of film dosimetry does depend on a number of factors including the careful control of processor chemistry, reproducibility of 1%–2% is possible17–19 and facilitated by microprocessorcontrolled development which limits the fluctuation of chemical temperatures to within ⫾0.3 °C. The use of radiographic film for dosimetry of larger 共e.g., ⬎10⫻10 cm2) radiotherapy photon beams is complicated because the sensitivity of the emulsion depends on the depthdependent photon spectrum at the point of measurement. Correcting for this effect has necessitated the measurement of a family of sensitometric curves20 for calibration, parameterization of emulsion sensitivity with depth18 or the construction of film phantoms which filter the low energy 共i.e., below 400 keV兲 scattered photons to prevent over-response by the emulsion.21 For smaller field sizes, however, depth and field size dependencies of the photon spectrum become less significant. We have demonstrated previously that these corrections are not required for the dosimetry of 6 MV photon beams over the range of field sizes used in radiosurgery.22 This paper describes the development of an anthropomorphic radiosurgical head phantom containing an array of radiographic films separated by tissue-equivalent spacers. Although the relatively small spectral component of lowenergy 共i.e., below 400 keV兲 lateral photon scatter exhibited by small 6 MV beams should serve to minimize the dose perturbation due to the presence of silver halide emulsion in phantom, increasing the total number of films within the irradiated volume will nevertheless eventually compromise the phantom tissue equivalence to some degree. Therefore, in this work we present the results of EGS4 Monte Carlo simulations of the interaction of a 6 MV radiosurgical-sized beam with this multiple-film phantom geometry to quantify the tissue equivalence as a function of the total amount of emulsion in phantom. The results of these simulations have been employed in the design of a head phantom system for the verification of three-dimensional dose distributions in stereotactic radiosurgery. This technique permits high-resolution measurement of dose distributions throughout a volume and resampling of the dose volume in multiple orthogonal planes. Dedicated software facilitates automated processing of films, conversion of recorded optical density to dose and export of a volume of measured isodose surfaces to the treatment planning system for direct comparison of planned and measured dose distributions. This report presents the design and evaluation of this dosimetry system and illustrates clinical applications. II. METHODS AND MATERIALS A. Monte Carlo simulation
1. Simulated phantom geometry and materials The Electron Gamma Shower version 4 共EGS4兲 photon/ electron transport code23 was used to simulate the interaction of a 6 MV radiosurgical beam with a realistic model of a Medical Physics, Vol. 27, No. 5, May 2000
979
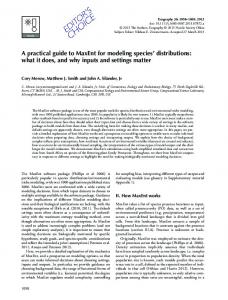
FIG. 1. 共a兲 Multiple-film phantom for radiosurgical dose verification. 共b兲 The DOSXYZ user code was used to define a simplified version of the phantom shown in 共a兲, consisting of a 20⫻20⫻20 cm3 volume of water with a 7 ⫻7⫻12 cm3 multiple-film cassette box at its center. Alternating slabs of film and water spacers are contained within the cassette box. While the outer dimensions of the cassette box are fixed, various thicknesses of interfilm spacers 共0.5, 1.0 and 3.2 mm兲 were used in separate simulations.
multiple-film radiosurgical phantom. The aim of this simulation was to optimize the design of a phantom similar to that shown in Fig. 1共a兲 prior to its construction, and in particular, to determine the magnitude of the dose perturbation as a function of the total amount of emulsion in the phantom. The 24 DOSXYZ user code was used to specify the geometry of a multiple-film phantom which is identical to that to be manu-
980
J. L. Robar and B. G. Clark: A practical technique for verification
factured, with the exception of the shape of the water container surrounding the multiple-film cassette. The simulated phantom, shown in Fig. 1共b兲, consists of a 20⫻20⫻20 cm3 water tank containing a multiple-film cassette box with inner dimensions of 7⫻7⫻12 cm3. The film was modeled to resemble that used regularly for dosimetry 共Kodak X-Omat V兲 and consists of two gelatin/silver bromide layers 共each 0.012-mm thick兲 on either side of a polyester base 共0.180-mm thick兲. Since the aim of this simulation was to determine the perturbation to tissue-equivalent material in the vicinity of the film, the total dose was scored in the volume of each of the interfilm spacers. Thirty million incident photons were tracked per simulation. To compare the results for the multiple-film phantom with the homogeneous case 共i.e., without film兲, the simulation was repeated with an identical geometry, but with water replacing both the gelatin/silver bromide and film base regions. To examine the magnitude of dose perturbation as a function of the quantity of film in phantom, simulations were repeated for interfilm spacer thicknesses of 0.5, 1.0 and 3.2 mm. Within the fixed volume of the cassette box, this results in 20, 58 and 100 films, respectively.
2. Incident photon beam parameters Since a radiosurgical treatment would involve beams incident arbitrarily relative to the orientation of the film planes, it was necessary to examine the two extreme cases in the simulation. For all interfilm spacer thicknesses, simulations were repeated with 共i兲 the beam central axis perpendicular to the film planes and 共ii兲 the beam central axis parallel to the film planes 共henceforth referred to as the ‘‘perpendicular’’ and ‘‘parallel’’ orientations, respectively兲. In all cases, the beam was 2.5⫻2.5 cm2 in cross section, nondivergent and centered upon the multiple-film cassette box. To assess whether the published 6 MV incident photon spectrum25 used to characterize the incident beam was representative of a typical radiosurgical beam, the EGS4 DOSRZ user code23,26 was used to score dose along the central axis of a 25-mm diameter beam at 5 mm-depth increments in a homogeneous, infinitely large water phantom. As shown in Fig. 2, good agreement between the Monte Carlo-calculated percent depth dose 共PDD兲 curve and that measured by a p-type silicon diode in a water phantom was observed.
3. Photon and electron transport parameters To avoid the termination of tracking low-energy electrons which would otherwise cross the boundaries of small regions in the simulated phantom 共i.e., film gelatin/silver bromide or base regions兲, the electron cutoff 共ECUT兲 and photon cut-off 共PCUT兲 energies were set low, to 514 keV 共total energy兲 and 3 keV, respectively. Although this value of ECUT increases simulation time significantly, it ensures that for the maximum possible electron energy 共6 MeV兲, the minimum electron step size in the emulsion layer set by the PRESTA boundary crossing algorithm27 will be a fraction of the emulsion thickness. Medical Physics, Vol. 27, No. 5, May 2000
980
FIG. 2. Comparison of percent depth dose curves for a 2.5-cm diameter 6 MV beam calculated using EGS4 Monte Carlo with a published incident spectrum 共Ref. 25兲 共filled circles兲 and measured using a p-type silicon diode 共solid line兲.
B. Measurement of dose perturbation due to multiple films
In addition to the Monte Carlo simulation, an experimental examination of possible dose perturbation due to the presence of multiple films was conducted for both the perpendicular and parallel beam orientations. For the perpendicular case, eighteen 7 cm⫻12 cm films were contained within a sealed polystyrene multiple-film cassette box, separated by 3.2 mm-thick polystyrene spacers. The final spacer in the box was of a thickness to ensure that no air gaps were present. The cassette box was placed at the center of a 16 cm⫻16 cm⫻22 cm water tank, and the room lasers were used to align the isocenter to the center of the last film in the array 共i.e., that most distant from the source兲, and, using 25 mm-diameter collimation, a dose of 50 cGy was administered to the depth of this film. For comparison, this irradiation was repeated with only one film in the cassette box aligned to the same position as the last film in the multiplefilm case. A similar single/multiple-film comparison was conducted for the parallel beam orientation. In this case, 19 films were loaded in the cassette box 共once again separated by 3.2 mmthick spacers兲 with the central film aligned with the beam axis. A dose of 50 cGy was administered to a depth corresponding to the vertical center of this film. An identical irradiation was subsequently delivered with just one film in the cassette box, at the same location as the central film for the multiple-film case. For both beam orientations, significant differences in the magnitude and/or spatial distribution of the optical density on the exposed films would indicate perturbation due to the increased quantity of emulsion in the multiple-film case. C. Anthropomorphic multiple-film phantom: Design
A radiosurgical head phantom28 was constructed and consists of a water-filled plastic head shell containing a sealed
981
J. L. Robar and B. G. Clark: A practical technique for verification
FIG. 3. Flowchart illustrating the application of the phantom for radiosurgical dose verification.
polystyrene multiple-film cassette box. The head shell may be fixed to the CT scanner and linear accelerator couches using conventional stereotactic head-ring or mask immobilization devices. The cassette box holds up to twenty 7 cm⫻12 cm films separated by 3.175-mm-thick polystyrene layers. The angular position of the cassette box, set at the base-plate of the phantom, may be used to position the film planes reproducibly in coronal planes 共as shown兲, in sagittal planes, or at a 45° angle. This allows resampling of the dose volume with multiple sets of films if required. The spatial dose information acquired from multiple sets of film may be merged using software. The films and polystyrene spacers are loaded under safelight while tilting the box to ensure that film edges make contact with the inner surfaces of both the box bottom and one vertical surface 共i.e., of the posterior wall兲. This defines two spatial ‘‘reference planes’’ which facilitate the localization of each film to a physical location within the phantom. While films are cut using a special jig 共allowing approximately 0.3 mm tolerance in dimensions兲, the localization of these reference planes ensures that the subsequent coregistration 共as discussed below兲 of the measured and planned dose distributions is independent of the cut film size. The cassette box is covered with a black veneer, except for a 1-mm-wide diagonal strip on one face. In the course of administering a treatment to the phantom, the room light is transmitted through the uncovered, translucent polystyrene strip, thus producing a small ‘‘indexing mark’’ on one edge of each film. These serve as a means for subsequent automatic orientation and ordering of films using software. Since a 6 mm wide border around each film is discarded following digitization 共to eliminate possible film edge artifacts兲, the indexing marks do not interfere with the recorded optical density. D. Anthropomorphic multiple-film phantom: Application
1. Imaging and treatment delivery Figure 3 illustrates the use of the phantom system for the verification of radiosurgical dose distributions. The phantom Medical Physics, Vol. 27, No. 5, May 2000
981
is first imaged in the CT scanner with both the head shell and cassette box filled with water. Optionally, a simulated target volume 共e.g., made of paraffin, polystyrene, or Lucite兲 may be positioned inside the film box. The CT scanning parameters are the same as are used during clinical imaging for radiosurgery, typically with 0.62-mm pixel size, 3-mm slice thickness and 2-mm slice separation. This image set is exported to the treatment planning software 共BRAINSCAN, BrainLAB, GmbH兲 for the specification of target volume contours, beam arrangement, shaping and beam weighting. The cassette box is then loaded with films and spacers and the phantom is positioned on the linac couch. The treatment is delivered as is done clinically, except the maximum dose is confined to below 0.60 Gy to prevent saturation of the film. Optionally, the treatment may be repeated with multiple sets of film at preset orientations about the phantom axis.
2. Film processing and digitization Films are developed in a processor 共Kodak 3000 RA兲 in which the developer temperature is microprocessorcontrolled and maintained at 29.2⫾0.3 °C. This temperature has been set lower than the standard processing temperature by approximately 8 °C, which shifts the sensitometric curve toward lower optical density 共OD兲 values. Since the scanner digitization noise generally increases with optical density, the lower temperature results in a higher signal-to-noise ratio 共SNR兲 for a given dose. Films are digitized using a 12-bit grayscale charge coupled device 共CCD兲-based scanner 共Duoscan, Agfa兲 which provides 4096 grayscale levels over an optical density range of 0.14–3.4 OD. Although the 8000-element CCD array provides hardware spatial resolution of up to 2000 dots per inch, a scanning resolution of 0.25 mm/pixel was chosen as sufficient for dose verification purposes and to limit the image size to 512⫻512 for subsequent export in DICOM format. The signal-to-noise ratio 共SNR兲 was examined as a function of optical density by scanning a step-pattern with optical densities ranging from 0.17 to 3.21. For each step 共a region of 12⫻20 pixels2), the SNR was calculated using SNR ⫽( 具 P 典 /⌬ P), where 具 P 典 and ⌬ P are the mean pixel value and the root-mean-square fluctuation about the mean, respectively. The SNR varies between approximately 100 and 400 for the range of optical density examined. This is sufficient for the generation of smooth isodose lines from scanned films without spatial filtering.
3. Film calibration To obtain the optical density-to-dose sensitometric curve, the cassette box is loaded with a single sheet of film at the center and the remainder of the box is filled with polystyrene slabs. The cassette box is positioned in a 16⫻16⫻22 cm water tank at a known depth and aligned using the room lasers so that the beam central axis and film plane are coincident within ⫾0.5 mm. The film is exposed using the median radiosurgical collimator diameter of 25 mm. Typically, three films exposed at different MU settings 共e.g., 30, 60, 90 MU兲 are sufficient to establish the sensitometric curve. For
982
J. L. Robar and B. G. Clark: A practical technique for verification
982
FIG. 4. A curve 共solid line兲 fitted to the measured calibration data 共points兲 according to the form given by Eq. 共2兲. Determination of the parameters of this equation permit conversion from pixel value to dose throughout the nonlinear region.
each film, 480 pixel values are scanned down the central axis at a sampling frequency of 4 pixels/mm. This vector of pixel values is related to absolute dose values using D 共 d,25 mm兲 ⫽
MU PDD共 d,25 mm兲 S t 共 25 mm兲 , 100
共1兲
where PDD(d,25 mm) is the percent depth dose at depth d in water and S t 共25 mm兲 is the total scatter factor29 for the 25 mm beam. Both the percent depth dose and total scatter factor were measured by a water phantom using a p-type sillicon diode30 共Scanditronix, Uppsala, Sweden兲. The calibration procedure thus provides a data set consisting of an array of measured scanned pixel values and a corresponding array of absolute dose values. These data define the sensitometric curve as illustrated in Fig. 4. A curve is fitted to this data according to the form P 共 D 兲 ⫽ P sat共 1⫺10(⫺ ␣ D) 兲 ⫹ P offset ,
共2兲
where P(D) is the scanned pixel value corresponding to the dose D and P sat is the saturation scanned pixel value 共set according to the scanned pixel value corresponding to an optical density of 3.4兲. P offset and ␣ are fitting parameters, representing the background scanned pixel value and the film sensitivity, respectively. The form in Eq. 共2兲 matches the data closely, resulting in R-values 共correlation coefficient兲 greater than 0.99, and may be inverted to solve for a dose corresponding to a given pixel value.
4. Phantom software A software application has been developed in C⫹⫹ for the MS Windows NT platform to expedite the film calibration process as described above and the processing of the multiple phantom film images, thereby minimizing intervention required by the user. Since four phantom films are digitized in a single pass of the scanner, the software first locates the edges of each film using an edge-detection algorithm and extracts individual film images. The indexing marks 共proMedical Physics, Vol. 27, No. 5, May 2000
FIG. 5. Images showing 30%, 50%, 80% and 90% isodose lines in axial and coronal planes for an ellipsoidal dose volume sampled with films in sagittal planes. On the left, no interpolation has been used, resulting in a sliceseparation of 3.2 mm. On the right, bicubic interpolation has been used for the generation of 73 images based on the original 18 measured slices, resulting in a slice separation of 0.8 mm.
duced as described above兲 on each image are then located by software, and the film images are automatically oriented, ordered and displayed for inspection by the user. One or more sets of multiple film images 共where each set corresponds to a different angular orientation of the cassette box兲 are stored in a three-dimensional matrix, and a bicubic interpolation technique31 is used to resample this matrix at a spatial frequency specified by the user. This algorithm ensures that the fitted surface passes directly through and is smooth across measured points. The result is an ordered set of images containing 共i兲 the original, directly measured film images and 共ii兲 a series of interpolated images. While this interpolation approach does not increase the inherent spatial resolution of the phantom system 共i.e., for a single set of films at one angular orientation兲, it serves as a means of merging multiple sets of films corresponding to different angular orientations and to smooth dose distributions in the planes perpendicular to the films 共Fig. 5兲. It was also observed that the bicubic interpolation technique was also superior to linear interpolation since the latter results in faceted dose distributions in planes perpendicular to the films. Pixel values in each image are then converted to absolute dose by inverting Eq. 共2兲. The global maximum dose within this set of images is determined and used to normalize each image into a series of user-specified isodose gray levels. Each isodose image is then converted to 512⫻512 DICOM format and fiducial marks are written into each image at the locations corresponding to the location of the reference planes as described above. The DICOM header information is used to encode the image order, image pixel size, slice thickness and slice separation so that the measured dose volume is imported by the treatment planning software with the
983
J. L. Robar and B. G. Clark: A practical technique for verification
983
FIG. 6. The treatment planning image fusion tools facilitate coregistration of the measured volume with the original CT set. Using the L-shaped fiducial marks defining the edges of the film volume, two faces of the measured volume are matched to the reference planes in the CT set 共i.e., the inferior and posterior inner surfaces of the cassette box兲.
correct spatial scaling. The software processing and export of a set of 20 film images requires approximately 5 min using a Pentium 333 MHz processor.
5. Coregistration of planned and measured dose volumes The treatment planning fusion tools are used to match the two reference planes of the dose volume with the corresponding bottom and vertical inner surfaces of the cassette box. This coregistration is verified by matching the fiducial marks in the measured dose volume with the inner surface of the cassette box 共Fig. 6兲. Fine control of this coregistration is achieved by aligning the fiducial marks with the box corners in magnified views of multiple axial, coronal and sagittal planes. The reproducibility of this coregistration has been assessed by repeating the process with the same film volume and CT set, and is consistent to within approximately ⫾0.5 mm 共root-mean-square error兲. III. RESULTS A. Multiple film phantom: Monte Carlo simulation
Figure 7 compares the simulated homogeneous and multiple-film phantoms in terms of dose to the interfilm spacers for the perpendicular beam orientation. As expected, for the 0.5 mm spacing, the presence of this large number of films results in a significant increase of photon attenuation in the phantom, indicated by the steeper variation of dose with depth. As the inter film spacing is increased in the simulation, however, the maximum dose perturbation is reduced from 2.5% for the 0.5 mm interfilm spacing to 1.3% and 0.8% for the 1.0 and 3.2 mm spacing, respectively. For the parallel beam orientation, the perturbation caused by the presence of the films is most pronounced across the central 2 cm of the profile and reaches 2.1% for the 0.5 mm interfilm spacing as shown in Fig. 8. For the 3.2 mm spacing, any disparity between the multiple-film and homogeneous cases is below the statistical uncertainty of the simulation (⬍0.6%). Medical Physics, Vol. 27, No. 5, May 2000
FIG. 7. Comparison between the homogeneous and multiple-film simulated phantoms in terms of dose to the interfilm water spacers for perpendicular beam orientation. For the 0.5, 1.0 and 3.2 mm interfilm spacing, the absolute dose differs by a maximum of 2.5%, 1.3% and 0.8%, respectively.
B. Experimental measurement of dose perturbation
For the parallel beam orientation, one-dimensional profiles across the optical density pattern recorded on the film at the center of the array of 19 films were compared to those recorded on the single film in phantom. These profiles 共and
984
J. L. Robar and B. G. Clark: A practical technique for verification
984
FIG. 9. 共a兲 The beam bouquet of six circular fields used as a nonconformal test of the phantom system. Also shown is a comparison between the 90%, 80% and 50% planned isodoses 共white lines兲 with the measured isodoses 共gray scale兲 for the 共b兲 sagittal, 共c兲 coronal and 共d兲 axial slices containing the isocenter.
FIG. 8. Comparison between the homogeneous and multiple-film phantoms in terms of dose to the interfilm water spacers for parallel beam orientation. For the 0.5 mm interfilm spacing, the absolute dose differs by as much as 3.2%. For the 3.2 mm spacing, any discrepancy is below the level of uncertainty in the simulation.
all profiles scanned at depths over the 12.0 cm range covered by the film兲 were congruent to within the noise inherent in the film and digitization (⫾15 pixel values兲. Similarly, for the perpendicular beam orientation, the scanned profiles of the spot pattern recorded on the films agree to within 1% for the single- and multiple-film cases. C. Example applications of the phantom system
1. Benchmark test of phantom system To test both the hardware and software components of the phantom system, an intentionally simple, nonconformal treatment plan was established, consisting of a bouquet of five circular, 30 mm diameter beams. This arrangement provided an approximately cylindrically symmetric planned dose distribution which had been verified previously using orthogonal two-dimensional film measurements. The treatment was administered to the phantom with a single set of 18 films 共spaced 3.2 mm apart兲 in sagittal planes. Figure 9 shows the comparison of the planned and measured isodoses Medical Physics, Vol. 27, No. 5, May 2000
on central axial, coronal and sagittal planes taken directly from the treatment planning system display. Both the planned and measured doses were normalized to the maximum dose in the distribution. Throughout the volume of the ellipsoidal distribution, the planned and measured 90%, 80% and 70% isodoses agree to within 1.5 mm. While the 50% isodoses agree throughout most of the volume, some mismatch 共up to 2.5 mm兲 was observed. This magnitude of spatial mismatch at the lower dose levels is consistent with the findings by other investigators for the same radiosurgical system and may arise from the lack of photon scatter modeling in the dose calculation.32
2. Conformal dose verification The main role of this phantom is the measurement of more complex, irregular dose distributions. Figure 10共a兲, for example, shows an arrangement of six shaped beams for the treatment of an irregularly shaped lesion. After the beam shapes are defined in the treatment planning system, a file is generated to specify the tool path of a computer-controlled hot-wire cutter 共Par Scientific兲 for the manufacture of tapered Styrofoam collimator mold inserts. Each insert is positioned in the mold by placing it on a uniquely shaped key and cerrobend is poured around each insert. The accuracy of poured collimator apertures may be verified by comparison with a scale template printed from the treatment planning system. Figure 10 also gives the comparison of planned and measured isodoses in example axial, coronal and sagittal planes for the conformal treatment of the lesion. The agreement is
985
J. L. Robar and B. G. Clark: A practical technique for verification
FIG. 10. 共a兲 The beam bouquet of six conformal fields and the comparison of the 90%, 80% and 50% planned isodoses 共white lines兲 with the measured isodoses 共gray scale兲 for the 共b兲 sagittal, 共c兲 coronal and 共d兲 axial slices containing the isocenter.
acceptable 共i.e., the measured 80% prescription isodose surface matches the planned isodose surface within 1.5 mm兲 throughout the treatment volume. However, in several regions of the dose volume the mismatch was more pronounced, up to 3.2 mm. In order to isolate whether this mismatch was due primarily to mechanical or algorithmic 共i.e., treatment planning dose calculation兲 sources, the manufactured beam aperture shapes were compared to the planned aperture shapes to highlight differences due to manufacturing tolerance 共e.g, errors due to hot-wire cutting tolerance or positioning on the central mould key兲. While most collimator shapes agree within the tolerance which can be achieved in hot-wire cutting 共approximately 1.5–2.0 mm at isocenter兲, one collimator insert appeared to have undergone a rotation on the mould key prior to pouring the cerrobend, producing spatial mismatches in the projected light field of up to 4 mm at isocenter. By replacing all of the planned shapes in the treatment planning system with the actual manufactured shapes, a new planned dose distribution was calculated. The new dose distribution reduced, but did not eliminate, the majority of the more significant 共i.e. ⬎3 mm) mismatches of the 80% and 90% isodose lines 共Fig. 11兲. However, spatial changes in the isodose lines were generally smaller in magnitude than the physical changes to the collimator aperture in the treatment plan, as can be expected since the dose distribution from each beam is not a step function and only one of the six aperture shapes in the plan was modified significantly. The remaining mismatch 共below 1.5 mm兲 is within the expected mechanical tolerance of treatment delivery and phantom repositioning. Medical Physics, Vol. 27, No. 5, May 2000
985
FIG. 11. 共a兲 The greatest mismatch observed between planned and measured isodoses for the conformal treatment was 3.2 mm. 共b兲 After correcting the planned field shapes to match the shapes of the manufactured collimators, this mismatch was significantly diminished to 1.2 mm, indicating both the significant effect of error in collimator manufacture and the sensitivity of the phantom technique to inaccuracy in beam shaping.
IV. DISCUSSION We have found this multiple-film phantom technique to be accurate, cost-effective and practical, typically requiring less than 3–4 hours for a complete dose verification. While the significant dose perturbation caused by low-energy, lateral photon scatter at depth in phantom21 would possibly preclude the use of closely spaced radiographic films for either large 共e.g., 20⫻20 cm) or low-energy photon beams, this technique takes advantage of the fact that over-response of film emulsion is minimized for smaller field sizes. This characteristic offers the practical advantages of reducing 共i兲 the dependence of film sensitivity on both depth in phantom and field size, and 共ii兲 the dose perturbation caused by the presence of the film emulsion. Recent reports indicate that these advantages will be realized for 6 MV beams22 over the range of field sizes used commonly in stereotactic radiosurgery 共i.e., up to 4 cm diameter兲 and also for 4 MV beams21 with field sizes as large as 6⫻6 cm. The selection of the interfilm spacer thickness 共and thus the number of films兲 involves a tradeoff between minimizing dose perturbation and improving the spatial resolution perpendicular to the film planes. The 3.2 mm interfilm spacing was chosen primarily based on the Monte Carlo and experimental findings shown here which indicate that the dose perturbation is below 1% for both the parallel and perpendicular beam orientations. The magnitude of this error is thus comparable to that which may be incurred due to the achievable reproducibility of film dosimetry. This interfilm spacing also involves the use of a maximum of 20 films for the 7 cm cassette box width, which results in a reasonable amount of
986
J. L. Robar and B. G. Clark: A practical technique for verification
time required for processing 共typically 15 min兲, scanning 共20–30 min兲, software analysis and export of DICOM images 共10 min兲. By minimizing the required user-intervention through the use of automated software for image analysis, processing and export, the entire dose verification procedure illustrated in Fig. 3 may be completed within a reasonable period of time 共3 to 6 hours typically, including imaging, treatment and data analysis兲. While the inherent spatial resolution perpendicular to film planes for a single set of films is low compared to that obtained in-plane 共0.25 mm/pixel兲, two orthogonal sets of films provide ample information for dose verification. However, since the exposure of two sets of films nearly doubles the time required for the dose verification, we evaluated the accuracy of the bicubic interpolation algorithm for the calculation of the dose between the measured planes obtained from a single set of films. This assessment was done by scanning a number of one-dimensional profiles through a typical sixfield conformal radiosurgical dose distribution on film at a spatial frequency of 共0.25 mm兲⫺1, and then arbitrarily resampling these profiles in software at a spatial frequency of 共3.2 mm兲⫺1 共i.e., the phantom sampling frequency perpendicular to film planes兲. This ‘‘under-sampled’’ data set was then provided as input to the bicubic interpolation algorithm. Figure 12 shows a comparison of the original 共true兲 profiles and the interpolated profiles. The spatial agreement is within 1.0 mm throughout the volume, even in regions where abrupt changes in gradient occur. This reasonable agreement may be attributed to the fact that the dose distributions are smooth and do not contain many high-frequency details that would be aliased by the low-frequency sampling. This is typical for most clinically relevant distributions where even highfrequency features 共e.g., spikes or protrusions兲 in the physical collimator shape result in much lower spatial-frequency variations in the isodoses at depth in phantom. Hence, while the user has the option of resampling the dose volume with film sets at different orientations, for typical dose distributions a single set of films will facilitate accurate verification, even in interpolated planes. The phantom system provides a means of comparing planned and measured isodoses and thus an indication of the aggregate spatial error arising from some or all of a number of sources including the finite CT scanning resolution, algorithmic limitations in dose calculation and beam shaping. Since the measured dose volume is coregistered to the inner surface of the cassette box, and therefore to stereotactic coordinates, this comparison will also highlight repositioning inaccuracies which have occurred between target localization and treatment delivery. The experience gained through this comparison is thus useful in establishing margins in treatment plans to account for uncertainty in dose delivery. In some cases, as illustrated here by the conformal application, it may be possible to retrospectively determine the predominant sources of error in the radiosurgical process. Although radiographic film offers the advantages of low cost, high spatial resolution and good signal-to-noise characteristics, one disadvantage is its narrow dose range (⬍1 Gy). Although this has not been problematic in evaluMedical Physics, Vol. 27, No. 5, May 2000
986
FIG. 12. The accuracy of the interpolation algorithm used in the phantom system was assessed by sampling profiles through a typical digitized distribution at a spatial frequency of (3.2 mm兲⫺1 and using these profiles as input to the interpolation routine to estimate pixel values at a higher spatial frequency 共0.25 mm兲⫺1. The interpolated profiles 共dashed line兲 are compared to ‘‘true’’ profiles scanned at a spatial frequency of 共0.25 mm兲⫺1 共solid line兲 at locations indicated by 共a兲 and 共b兲.
ating the accuracy of our conformal radiosurgery system, verification of more complex treatments 共e.g., involving a large number of multiple dynamic beams兲 may necessarily saturate the film. The wider dose range offered by radiochromic film33 共i.e. 3–100 Gy for MD-55-234兲 would be useful in such a case, and this option will become more promising as the spatial uniformity of the film improves. The phantom software and hardware described here may be used with radiochromic film with minimal modification. ACKNOWLEDGMENTS This work forms part of a doctoral dissertation by J.L.R. and it has been funded by the Natural Sciences and Engi-
987
J. L. Robar and B. G. Clark: A practical technique for verification
neering Council of Canada 共scholarship PGSB-2077721998兲, The BC Cancer Agency and The University of British Columbia. Andrew Yung is acknowledged for his contributions to software development. The authors are also grateful to Mya Warren for her contribution of the design of a film calibration phantom. a兲
Electronic mail:
[email protected] J. D. Bourland and K. P. McCollough, ‘‘Static field conformal stereotactic radiosurgery: Physical techniques,’’ Int. J. Radiat. Oncol., Biol., Phys. 28, 471–479 共1994兲. 2 A. S. Shiu, H. M. Kooy, J. R. Ewton, S. S. Tung, J. Wong, K. Antes, and M. H. Maor, ‘‘Comparison of miniature multileaf collimation 共MMLC兲 with circular collimation for stereotactic treatment,’’ Int. J. Radiat. Oncol., Biol., Phys. 37, 679–688 共1997兲. 3 L. Dong, A. Shiu, S. Tung, and K. Hogstrom, ‘‘A pencil-beam photon dose algorithm for stereotactic radiosurgery using a miniature multileaf collimator,’’ Med. Phys. 25, 841–850 共1998兲. 4 E. C. Halperin, G. Bentel, E. R. Heinz, and P. C. Burger, ‘‘Radiation therapy treatment planning in supratentorial glioblastoma multiforme: An analysis based on post mortem topographic anatomy with CT correlations,’’ Int. J. Radiat. Oncol., Biol., Phys. 17, 1347–1350 共1989兲. 5 F. H. Hochberg and A. Pruitt, ‘‘Assumptions in radiotherapy and glioblastoma,’’ Neurology 30, 907–911 共1980兲. 6 W. A. Friedman and F. J. Bova, ‘‘The University of Florida radiosurgery system,’’ Surg. Neurol. 32, 334–342 共1989兲. 7 A. Wu, G. Lindner, A. H. Maitz, A. M. Kalend, L. D. Lunsford, J. C. Flickinger, and W. D. Bloomer, ‘‘Physics of gamma knife approach on convergent beams in stereotactic radiosurgery,’’ Int. J. Radiat. Oncol., Biol., Phys. 18, 941–949 共1990兲. 8 Task Group 42 Radiation Therapy Committee, American Association of Physicists in Medicine, ‘‘AAPM Report No. 54: Stereotactic Radiosurgery’’ 共American Institute of Physics, Woodbury, NY, 1995兲. 9 A. S. Meigooni, M. S. Sanders, G. S. Ibbott, and S. R. Szeglin, ‘‘Dosimetric characteristics of an improved radiochromic film,’’ Med. Phys. 23, 1883–1888 共1996兲. 10 L. E. Olsson, A. Fansson, A. Ericsson, and S. Mattsson, ‘‘MR imaging of absorbed dose distributions for radiotherapy using ferrous sulfate gels,’’ Phys. Med. Biol. 35, 1623–1632 共1990兲. 11 J. Gore, Y. Kang, and R. J. Schulz, ‘‘Measurement of radiation dose distribution by nuclear magnetic resonance 共NMR兲 imaging,’’ Phys. Med. Biol. 29, 1189–1197 共1984兲. 12 R. J. Schulz, A. F. de Guzman, D. B. Nguyen, and J. C. Gore, ‘‘Dose response curves for Fricke-infused gels as obtained by nuclear magnetic resonance,’’ Phys. Med. Biol. 35, 1611–1622 共1990兲. 13 M. J. Maryanksi, R. J. Schulz, G. S. Ibbott, J. C. Gatenby, J. Xie, D. Horton, and J. C. Gore, ‘‘Magnetic resonance imaging of radiation dose distributions using a polymer-gel dosimeter,’’ Phys. Med. Biol. 39, 1437–1455 共1994兲. 14 M. J. Maryanski, G. S. Ibbott, P. Eastman, R. J. Schulz, and J. C. Gore, ‘‘Radiation therapy dosimetry using magnetic resonance imaging of polymer gels,’’ Med. Phys. 23, 699–705 共1996兲. 15 G. S. Ibbott, M. J. Maryanski, P. Eastman, S. D. Holcomb, Y. Zhang, R. G. Avison, M. Sanders, and J. C. Gore, ‘‘Three-dimensional visualization 1
Medical Physics, Vol. 27, No. 5, May 2000
987
and measurement of conformal dose distributions using magnetic resonance imaging of BANG polymer gel dosimeters,’’ Int. J. Radiat. Oncol., Biol., Phys. 38, 1097–1103 共1997兲. 16 S. L. Meeks, F. J. Bova, M. J. Maryanski, L. A. Kendrick, M. K. Ranade, J. M. Buatti, and W. A. Friedman, ‘‘Image registration of BANG gel dose maps for quantitative dosimetry verification,’’ Int. J. Radiat. Oncol., Biol., Phys. 43, 1135–1141 共1999兲. 17 C. W. Cheng and I. J. Das, ‘‘Dosimetry of high energy photon and electron beams with CEA films,’’ Med. Phys. 23, 1225–1232 共1996兲. 18 J. F. Williamson, F. M. Khan, and S. C. Sharma, ‘‘Film dosimetry of megavoltage photon beams: A practical method of isodensity-to-isodose curve conversion,’’ Med. Phys. 8, 94–99 共1981兲. 19 L. J. Van Battum and B. J. M. Heijmen, ‘‘Film dosimetry in water in a 23 MV therapeutic photon beam,’’ Radiother. Oncol. 24, 152–159 共1995兲. 20 J. I. Hale, A. T. Kerr, and P. C. Shragge, ‘‘Calibration of film for accurate megavoltage photon dosimetry,’’ Med. Dosim. 19, 43–46 共1994兲. 21 S. E. Burch, K. J. Kearfott, J. H. Trueblood, W. C. Sheils, J. Inhwan Yeo, and C. K. C. Wang, ‘‘A new approach to film dosimetry for high energy photon beams: Lateral scatter filtering,’’ Med. Phys. 24, 775–783 共1997兲. 22 J. L. Robar and B. G. Clark, ‘‘The use of radiographic film for linear accelerator stereotactic radiosurgical dosimetry,’’ Med. Phys. 26, 2144– 2150 共1999兲. 23 W. R. Nelson, H. Hirayama, and D. W. O. Rogers, ‘‘The EGS4 Code System,’’ Report SLAC-265 共Stanford Linear Accelerator Center, Stanford, California, 1985兲. 24 K. M. Ayyangar and S. B. Jiang, ‘‘Calculation of dosimetric data for small field sizes for 6 MV x-rays using BEAM/DOSXYZ Monte Carlo codes,’’ Med. Phys. 23, 1129 共1996兲. 25 R. Mohan, C. Chui, and L. Lidofsky, ‘‘Energy and angular distributions of photons from medical linear accelerators,’’ Med. Phys. 12, 592–597 共1985兲. 26 C. Malamut, D. W. O. Rogers, and A. F. Bielajew, ‘‘Calculation of water/air stopping-power ratios using EGS4 with explicit treatment of electron-positron differences,’’ Med. Phys. 18, 1222–1228 共1991兲. 27 A. Bielajew and D. W. O. Rogers, ‘‘PRESTA: The parameter reduced electron-step transport algorithm for electron Monte Carlo transport,’’ Nucl. Instr. Meth. B 18, 165–181 共1987兲. 28 U.S. Provisional Patent Serial No. 60/108,281. 29 F. M. Khan, The Physics of Radiation Therapy, 2nd ed. 共Williams and Wilkins, Baltimore, MD, 1994兲. 30 A. S. Beddar, D. J. Mason, and P. F. O’Brien, ‘‘Absorbed dose perturbation caused by diodes for small field dosimetry,’’ Med. Phys. 21, 1075–1079 共1994兲. 31 W. Press, S. A. Teukolsky, W. T. Vetterling, and B. P. Flannery, Numerical Recipes in C 共Cambridge University Press, Cambridge 1992兲. 32 V. P. Cosgrove, U. Jahn, M. Pfaender, S. Bauer, V. Budach, and R. E. Wurm, ‘‘Commissioning of a micro multi-leaf collimator and planning system for stereotactic radiosurgery,’’ Radiother. Oncol. 50, 325–336 共1999兲. 33 A. Niroomand-Rad et al., ‘‘Radiochromic film dosimetry: Recommendations of AAPM Radiation Therapy Committee Task Group 55,’’ Med. Phys. 25, 2093–2115 共1998兲. 34 N. V. Klassen, L. van der Zwan, and J. Cygler, ‘‘Gafchromic MD-55: Investigated as a precision dosimeter,’’ Med. Phys. 24, 1924–1934 共1997兲.