A Preliminary Investigation of Using Age and Distance Measures in the Detection of Evolutionary Couplings Abdulkareem Alali, Brian Bartman, Christian D. Newman, Jonathan I. Maletic Department of Computer Science Kent State University Kent, Ohio 44242, USA
[email protected],
[email protected],
[email protected],
[email protected] Abstract— An initial study of using two measures to improve the accuracy of evolutionary couplings uncovered from version history is presented. Two measures, namely the age of a pattern and the distance among items within a pattern, are defined and used with the traditional methods for computing evolutionary couplings. The goal is to reduce the number of false positives (i.e., inaccurate or irrelevant claims of coupling). Initial observations are presented that lend evidence that these measures may have the potential to improve the results of computing evolutionary couplings.
We now present our initial observations on this topic in the following manner. The next section (II) presents a brief discussion evolutionary coupling and how we mine the patterns. Following that are sections on using the distance measure (section III) and another on the age measure (section IV). Each section defines the measure and presents initial observation. Following that is motivating related work and conclusions and future work.
Index Terms— Evolutionary Coupling, Software Repositories.
Evolutionary coupling is determined by examining the history of a software system [1, 3]. It is an alternative approach to traditional static or dynamic analysis. The intent is to find hidden dependencies and traceability links that are difficult to identify through physical dependencies in the code. Software elements are evolutionarily coupled if they frequently cochange over a defined time window and with a minimum support for a given duration of history. These couplings are uncovered by searching for patterns of frequently co-changing items in the version history.
I.
INTRODUCTION
Evolutionary Couplings [1, 2] are patterns of co-changing items in software that are uncovered from the version history. That is, if two files change regularly together at the same time over and over again during software evolution then they are likely evolutionarily coupled. This coupling may exist for several reasons, but a static relationship may not be one of those. The software items in a change pattern can be related through static dependencies such as a function call. Yet others can be related through implicit dependencies, or hidden (e.g., potentially misplaced related artifacts in a software system with no clear static relation [3]). Evolutionary couplings are typically identified using a data mining technique called frequent pattern mining [4]. This is a commonly applied method in mining software repositories (MSR). Frequent pattern (item set) mining is applied to sets of files committed within a given interval of time. Unfortunately, these approaches typically suffer from high false-positive rates. The work presented here investigates the problem of reducing the number of false-positives by ranking the patterns. Two measures, namely distance and age, of a pattern are introduced. Our hypothesis is that these measures will help rank correct/important patterns higher than less meaningful or false-positive patterns. This has the potential to improve the usefulness of the patterns for developers by limiting them to only patterns that have a causal relationship as opposed to simply being correlated.
c 2013 IEEE 978-1-4673-2936-1/13
II.
EVOLUTIONARY COUPLING
A. Frequent Pattern Mining We use the Eclat algorithm for frequent pattern (or itemset) mining [16] to uncover evolutionary couplings. The technique searches for patterns of co-changing items. The underlying idea is that if items co-change together on a very frequent basis then they must be related to one another in either an explicit or implicit manner. The technique has a number of parameters that must be selected for the particular problem and data set. The first is the size of a transaction (or change set). The transaction size dictates which items “change together”. Since logical commits and physical commits are typically not mapped one-to-one, a time duration/window is needed to group physical commits into logical ones. Selecting the time window is an open problem as a logical commit can be spread out over multiple physical commits across days. The next parameter that must be selected is minimum support. This value regulates the low bound of the frequency of patterns (itemsets) produced. Low values of minimum
169
MSR 2013, San Francisco, CA, USA
c 2013 IEEE. Personal use of this material is permitted. Permission from IEEE must be obtained for all other uses, in any current or future media, including reprinting/ Accepted for publication by IEEE. republishing this material for advertising or promotional purposes, creating new collective works, for resale or redistribution to servers or lists, or reuse of any copyrighted component of this work in other works.
support generate higher numbers of patterns while higher numbers produce fewer patterns but with more support. Lastly, we must select the granularity of the changing item. For source code this could be a line of code, a function, a file, or a subsystem. In our case we use the file level. This is a common level of granularity to use and maps well to commits. B. Data Collection and Patterns Generation The implementation of the approach is achieved with two tools: δShopper (pronounced “delta shopper”) and srcMiner (reads “source miner”). These tools target data available from the Subversion version control system. The δShopper tool is responsible for extracting metadata and differences from a Subversion repository. The program takes a unit of time (δ) and extracts information about the modification of artifacts over the course of the history. The program identifies modifications to files within each time δ and generates the datasets of buckets of co-changing files, our δ here is a Subversion commit. To collect the files we use the archived logs for co-changing files. Table 1 presents the open source projects we use in this work, years range, the number files in each system, commits, minimum support counts, generated itemsets and their maximum observed itemset size. We use srcMiner to process our datasets and generate frequent patterns. We developed srcMiner based on Eclat frequent item sets data mining algorithm [16]. TABLE 1. CHARACTERISTICS OF THE ELEVEN OPEN SOURCE SYSTEMS USED IN STUDY INCLUDING YEARS, #COMMITS, #FILES, SELECTED MINIMUM SUPPORTS, #ITEMSETS GENERATED, AND MAXIMUM ITEMSET SIZES (L). System KDELibs KOffice Httpd Subversion Ruby Chrome QuanLib OpenMPI LLVM GCC Xapian
Years Commits 01-10 01-10 99-11 00-11 00-11 08-11 00-10 03-11 01-10 01-10 00-10
III.
54,189 55,651 11,264 23,420 12,439 35,650 7,791 11,682 50,327 50,145 4,703
Files 14,748 21,857 763 1,485 834 16,358 5,340 6,583 4,266 26,154 1,302
Min. Supp. 9 12 5 10 9 12 9 6 12 12 5
Itemsets
L
13,342 47,444 146,363 93,701 82,005 315,986 266,424 328,963 55,435 50,050 16,764
10 13 16 16 14 18 18 18 13 11 12
We use the definition of tree distance between any pair of files to define a distant pattern. A distant pattern is a pattern that contains a maximum tree distance between its items that exceeds a given threshold. We empirically assign the threshold based on the distribution of tree distances of all collected patterns. Specifically, we choose a point where the distance becomes relatively non-typical or outlier. For example, from Table 2, we can see that distances of 0 and 2 for multiple cases; 1 and 4 for single cases, represent the majority (above 75%) of the data. We consider the distances above that to be outliers and set the threshold at that value. TABLE 2. TYPICAL DISTANCES FOR FILE GRANULARITY. Majority Total% OSS Distance % Distance % KDELibs 0 86% 86% KOffice 0 97% 97% Httpd 0 84% 84% Subversion 0 99% 99% Ruby 0 99% 99% Chrome 0 32% 1 44% 76% QuantLib 0 99% 99% OpenMPI 2 81% 81% LLVM 2 63% 4 13% 76% GCC 0 92% 92% Xapian 0 27% 2 65% 91%
Distant patterns represent changes occurring across a broader portion of the system. Our hypothesis is that these patterns are more likely to represent hidden dependencies and may be otherwise difficult to uncover. Such patterns may be an indication of code that is a candidate for refactoring or reengineering. The premise is that outlier behavior is often problematic, where the majority of co-changes are localized.
PATTERN DISTANCE
Here, distance represents the position of multiple files relative to one another within the directory tree. Software projects normally split source files into a logical tree structure that represents abstract modules. For example, all source code that deals with UI management might be under the same subdirectory. We take advantage of this and use tree distance as our measure. A tree distance is the number of unmatched edges between any two files in the file structure tree. For example, the three files below represent an itemset set with support count 12. Two differ by three folders and as such the distance between them is 6, which is the maximum distance in this pattern: /koffice/krita/colors/gray_u16/kis_gray_u16_colorspace.h /koffice/plugins/colors/gray_u8/kis_gray_colorspace.h /koffice/plugins/colors/gray_u16/kis_gray_u16_colorspace.h
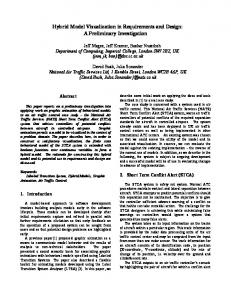
Figure 1. Distribution for Distances Appeared in the Generated Patterns in KOffice [2001-2010] for Files
The distribution for distances between itemset pairs is presented using a histogram over the eleven systems. The data mined (Table 1) is split into ten percentiles that are collapsed if we discovered percentiles that were clones of one another. Figure 1 presents the histogram created using the percentiles, which represent the file distances on the x-axis, by the frequency of files at each decile on a log scale. It can be seen that typical distances for KOffice are 0 and 2 for files, where the zero distance is dominating the set (zero means the files are children of the same folder). This implies that most evolutionary couplings occur within the same
170
subfolder and remain localized. This isn’t entirely unexpected, as changes to modules should happen, most of the time, in source files local to the module, as opposed to outside of the module. With this in mind, outliers in this data; couplings with a distance higher than three or four, may represent crossmodule couplings and require further analysis by engineers. For the other 10 systems we examined, most followed the same trend as KOffice with 0 dominating the set of distances. A distance of 2 took second place most of the time. Table 2 gives a partial listing of distances that, when combined, represent more than 75% of the data collected for the systems. IV.
contained in the graphs are split into ten percentiles that are collapsed if two percentiles represented the same value.
PATTERN AGE
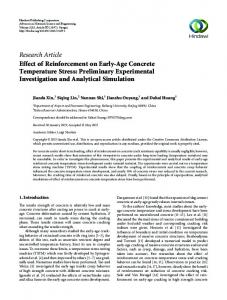
Age represents the duration of an evolutionary coupling. For impact analysis, the age of an evolutionary coupling may help to highlight both explicit and implicit couplings between files by showing that they have been co-changed extensively and persisted unbroken during maintenance for a long duration. We define a pattern age as the difference in days between the date on which a given pattern first appears and the date on which the same pattern last appeared during the selected study period. We refer to this difference as age because of the notion that patterns exist over an interval of time. Patterns are created through maintenance tasks, they persist for a period of time through maintenance tasks, and, eventually, through inaction or maintenance, their appearance becomes infrequent, perhaps denoting their end. The age does not necessarily reflect the end, or death, of a pattern due to the fact that it may reoccur during maintenance outside our range of study. To compute the age of an evolutionary coupling, we found the date on which an evolutionary coupling first appeared and subtracted this from the date on which the same coupling disappeared. We did this for eleven systems in order to get an overview of what the pattern age looks like for various software projects. For example, take a coupling that appeared first on Oct 6th and disappears on Nov. 1st during the same year. Let’s say there were multiple revisions that contained this coupling between those dates as well; on Oct 6th, Oct 10th, Oct 19th, Oct 30th, and Nov 1st. The age of this pattern is the difference between Oct 6th and Nov 1st, which is 26 days. Thus, age of this coupling is 26 days. A pattern appears during maintenance due to the existence of dependencies that exist between multiple items. Often, when patterns appear, there is a ripple effect that forces the same pattern to reappear within a short interval of time. This can be due to unfinished task, a bug created or uncovered due to the maintenance performed; a system wide API change is taking place, etc. The patterns then sleep for a short time and reappear once again. For example, in Figure 2 we have deciles for the difference in time from one appearance of a pattern to the next. The bars are the size of these differences in days. We notice that there is a 40% chance that, for every appearance of a pattern, the next appearance occurs within four days. We have made similar observations with the other systems used in our experiments. In order to get an idea of what is the typicality of age, we computed the distribution of ages for eleven systems. The data
Figure 2. Distribution of Patterns Reoccurring Differences in Days for KOffice [2001-2010] over Files
The distributions indicate that the age of coupled files tend to be short in most systems. This is presented in Table 3 and holds true for more than half of the systems we examined. For example, QuantLib’s maximum age is 3051 days, but 90% of the couplings have ages at or smaller than 399 days.
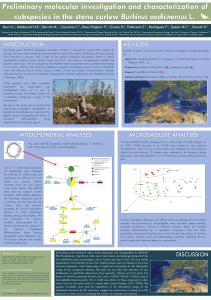
Figure 3. 10-Percentile Distribution for Patterns Age and Decile Widths in days for KOffice [2001-2010] for Files
Here, a short age is defined as half of the age of the longest evolutionary coupling within the system. Out of the eleven systems we studied, only three did not show this trend at file granularity. In Figure 3, we show the distribution for age for ten years of KOffice software package using file granularity. The x-axis represents the range of ages. The y-axis represents the frequency of couplings that fall between the ranges and the second bar is width of each percentile. We notice a normal like distribution for age, where the middle deciles are short and contain most frequencies of age. While the both tails are of long day ranges and less frequent. For example, from Figure 3, we see that 60% of the data collected has an age of 1456 or less, and the largest age for an evolutionary coupling is 3311 for files. This follows the trend for short ages because 1456 is less than half of 3311 and 60% of the data has an age 1456 days or less. Several of the other systems had similar distributions. These include OpenMPI, QuantLib, Httpd, Subversion, LLVM, Xapian, and Chrome and most of their evolutionary couplings were well below half of the maximum age. The only systems that did not show this trend are KDELibs, GCC, and Ruby.
171
TABLE 3. TYPICAL AGE DISTRIBUTION FOR FILES. THE THRESHOLD REPRESENTS THE AGE AT WHICH MOST OF THE DATA IS ACCOUNTED FOR. KDELibs KOffice Httpd Subversion Ruby Chrome QuantLib OpenMPI LLVM GCC Xapian
Max Age (days) 2046 3311 4491 4121 3591 878 3051 1990 3482 3642 3458
V.
Threshold (days) 1027 1456 1030 975 3302 103 399 929 928 2810 1206
%Data 60% 60% 90% 70% 90% 80% 90% 90% 80% 60% 60%
RELATED WORK
In 1997, Ball et al [5] are one of the first to introduce the idea and importance of co-changed artifacts. A visualization approach presented to detect co-changed classes. Gall et al [1, 2] introduced the concept of evolutionary coupling to detect implicit relationships between modules and classes using historical data and inferred architectural weaknesses of poor design interfaces and inheritance hierarchies. Ratzinger et al [6] called such classes code smells detected using evolutionary coupling. At a finer granularity level, Zimmermann et al [7] presented ROSE to find change patterns among entities (files, classes functions, and lines of code) using a sliding window approach. This led to work on automatic bug and code prediction (e.g. [8, 9]). D’Ambros et al [3, 10] presented Evolution Radar, a visualization technique to analyze evolutionarily coupled items to detect architecture decay and coupled components. Pinzger et al [11] proposed a visualization method to detect potential refactoring candidates. Beyer et al [12] proposed an visualization technique called Evolution Storyboards, they used distance of two files as the degree of change coupling values to spot clusters of related files. Robbes et al [13, 14] presented a fine-grain logical/evolutionary coupler, the goal is to overcomes shortcomings of VCS logical coupling methods, three ways to detect evolutionary coupling are presented using IDE recording, change-based, interaction, and time-based coupling. The problem with the IDE recording is that developers rarely use it and the recording is very detailed, which can be a distraction. Kagdi et al [15], present a conceptual and evolutionary coupling techniques to improve change impact analysis in software source code. VI.
(in the systems examined). Furthermore, it appears that the older a pattern is, the more rooted and frequent it has occurred. We are currently working to validate the rankings based on these measures. The aim is to help raise the awareness of important patterns to engineers and reduce the problem of too many false patterns being examined. For future work, we need to examine our assumptions made with regards to both age and distance. For instance, age presumes that the difference between when a coupling first and last appears is a proper measurement for the duration of an evolutionary coupling. This may not be the best representation of age, however.
CONCLUSIONS AND FUTURE WORK
Our goal is to investigate how effective ranking the patterns using the measures of age and distance are in reducing the number of false-positives. So far we have observed interesting characteristics for each measure. We noticed that patterns are most often localized changes (above 75%) with 0 and 2 distances between co-evolving files. We believe that the outliers are of great interest; that they may be indicative of hidden dependencies, for example. Ranking patterns based on distances can help direct developers to unusual couplings. With respect to the age of a pattern, we observed that there is a 40% chance that a pattern will occur again in 4 days or less
REFERENCES [1] H. Gall, K. Hajek, and M. Jazayeri, "Detection of Logical Coupling Based on Product Release History," ICSM, 1998. [2] H. Gall, M. Jazayeri, and J. Krajewski, "CVS Release History Data for Detecting Logical Couplings," IWPSE, 2003. [3] M. D'Ambros and M. Lanza, "Reverse Engineering with Logical Coupling," WCRE, 2006. [4] R. Agrawal and R. Srikant, "Fast Algorithms for Mining Association Rules in Large Databases," VLDB, 1994. [5] T. Ball, J.-M. K. A. A. Porter, and H. P. Siy, "If Your Version Control System Could Talk ..." in Workshop on Process Modeling and Empirical Studies of Software Engineering, 1997. [6] J. Ratzinger, M. Fischer, and H. Gall, "Improving evolvability through refactoring," SIGSOFT Software Eng Notes, vol. 30, pp. 1-5, 2005. [7] T. Zimmermann, P. Weisgerber, S. Diehl, and A. Zeller, "Mining Version Histories to Guide Software Changes," ICSE, 2004. [8] S. Kim, T. Zimmermann, K. Pan, and E. J. J. Whitehead, "Automatic Identification of Bug-Introducing Changes," ASE, 2006. [9] A. T. T. Ying, G. C. Murphy, R. Ng, and M. C. Chu-Carroll, "Predicting Source Code Changes by Mining Change History," TSE, vol. 30, pp. 574-586, 2004. [10] M. D'Ambros, M. Lanza, M. Lungu, "Visualizing Co-Change Information with the Evolution Radar," TSE, vol. 35, pp. 720735, 2009. [11] M. Pinzger, H. Gall, M. Fischer, and M. Lanza, "Visualizing multiple evolution metrics," ACM SoftVis, 2005. [12] D. Beyer and A. E. Hassan, "Animated Visualization of Software History using Evolution Storyboards," WCRE, 2006. [13] R. Robbes, D. Pollet, and M. Lanza, "Logical Coupling Based on Fine-Grained Change Information," WCRE, 2008. [14] R. Robbes and M. Lanza, "Versioning Systems for Evolution Research," IWPSE, 2005. [15] H. Kagdi, M. Gethers, D. Poshyvanyk, and M. L. Collard, "Blending Conceptual and Evolutionary Couplings to Support Change Impact Analysis in Source Code," in WCRE, 2010, pp. 119-128. [16] M. J. Zaki, S. Parthasarathy, and W. Li, "A localized algorithm for parallel association mining," ACM Symposium on Parallel Algorithms and Architectures, 1997. [17] J. I. Maletic and M. L. Collard, "Supporting Source Code Difference Analysis," ICSM, 2004.
172