This article aims at summarizing and aggregat- ing the wide range of models into one single meta-model that could allow a more comprehensive understanding ...
A Preliminary Model of Innovation Systems Mauricio Uriona1,2 , Ricardo Pietrobon1 , Gregorio Varvakis2 , and Elias Carvalho1 1
2
RoR Group. Duke University. Durham, NC, 27710, USA Department of Knowledge Engineering. Federal University of Santa Catarina. P.O. Box 476, Florianopolis, SC, 88040-970, Brazil 1 {m.uriona,rpietro,ecc18}@duke.edu 2 {grego}@egc.ufsc.br
Abstract The Innovation System (IS) approach is a conceptual framework used by scholars and policy makers to describe the scientific and technological structures and processes that influence economic development. The current literature offers a wide variety of models representing IS making difficult to choose the most appropriate one to inform and formulate policy. This article aims at summarizing and aggregating the wide range of models into one single meta-model that could allow a more comprehensive understanding of the structure - components and linkages - of an IS and offer rigorous and timely assessments of the evidence base to inform decision and policy makers. Thus, a preliminary structured model of a Regional Innovation System is developed and formalized through the use of a system dynamics simulation model that depicts changes in the linkages and its knowledge flows over time. The model might be used in future research in analyzing specific Innovation Systems. Keywords: Innovation Systems, System Dynamics, Simulation Models
1
Introduction
Innovation System (IS) is the term used by scholars and policy makers to describe the emerging scientific and technological structures and processes that influence economic development (Freeman, 1987; Lundvall, 1992; Nelson, 1993, 1992). As many complex systems, due to the presence of a large number of actors in the IS, policies which were meant to increase its performance often 1
produce the opposite, unintended effect. As Liu and White point out, it is the IS’ inherently endogenous structure i.e. the complex non-linear relationships among the actors and institutions composing the IS, that cause those failures in policy making (Liu and White, 2001). This context is especially problematic for Developing Countries where there are “weak liaisons, low trust and poor association between economic generators (companies) and their supporting institutions (government, federations, banks and academies). Innovation is not perceived as an asset, and high value entrepreneurship is not a common finding in the entrepreneurial profiles of most professionals” (Scheel and Parada, 2008) . Accordingly, efforts in understanding, explaining and managing IS, have focused on either statistical and econometric approaches or expert-based opinions (Melo, 2001). Since IS are inherently complex, these methods only account for partial explanations of IS behavior and performance, and consequently, only offer partial answers on how they should be managed. This article aims at summarizing and aggregating the wide range of models into one single meta-model that could allow a more comprehensive understanding of the structure - components and linkages - of an IS and offer rigorous and timely assessments of the evidence base to inform decision and policy makers. Thus, a preliminary structured model of an Innovation Systems is developed and formalized through the use of a system dynamics simulation model that depicts changes in the linkages and its knowledge flows over time and afterwards, instantiated in a Region in Brazil. This study presents the preliminary results of the research (model building and pre-testing phases).
2
Innovation Systems and System Dynamics modeling
The use of the Innovation Systems framework has brought undoubtedly several achievements, especially related with the understanding of the innovative process as a system, however, some shortcomings have been identified in the past few years. These shortcomings can be characterized as twofold: shortcomings related to the IS framework per se and shortcomings related to the modeling of IS. 2
First, because of the mainly economic approach that has driven the study of innovation for the last sixty years, scholars have had difficulties in explaining what is in nature an interdisciplinary phenomenon, which not only accounts for economic variables (Godin, 2009). Second, although the IS framework emphasizes that the relationships among the actors are the drivers that cause changes in the behavior of the Innovation System (Godin, 2009), it does not explain how the components of the system compete for resources, in other words, how the relationships between the components are coordinated (Lee and Yoo, 2007). Third, due to its static nature, the IS framework lacks in representing the behavior changes on the system over time (Lee and Yoo, 2007). As Lee sustains, the systemic and dynamic patterns of interactions among the actors of an Innovation System are neglected topics of study in the NIS literature (Lee, 2002). And fourth, because of the complexity of the system (large number of actors and relationships) the main emphasis of empirical studies carried out has been on the system’s statistics or comparative statistics, and none going onward more dynamic analysis (Carlsson et al., 2002). Furthermore, the study of IS does not give any attention to ”delay effects” or ”time lags”, i.e. there are long time delays between the moment a policy is launched and the moment the actual results of that policy are seen. In most cases it would take decades to see the effects of a policy or decision taken by one the innovation actors. Although the time lags have been studied in themselves, they have not been fully discussed in the context of a IS (Lee, 2002). The second type of shortcomings arises from the latter statement. So far, the current modeling of IS has been based on mainly quantitative (statistical, econometric) and discursive approaches, such as expert-based judgments (Melo, 2001; van Raan, 2003). The OECD for example, has focused mainly on applying large scale surveys among their member countries in order to obtain data and measure input and output indicators, however, those static measures have fail in fully representing some of the behaviors changes seen on Innovation Systems, especially those that depend on time. I do not state that one approach may be better than another, certainly, statistical analysis may help in having a scientific way to cluster data, so it can be analyzed by several alternative methods; on the other hand, the advantage of opinion surveys is that they can estimate factors where hard data is not available by using the intuitive insights of experts on subjective aspects, improving the qualitative analysis. We simply claim that joint approaches - when used in parallel - can substantially improve decision and 3
strategy-making. Thus, I sustain that traditional approaches, such as those cited above, have many times failed in representing the complexity of Innovation Systems due to their inability to deal with the non-linearity and dynamicity found on the NIS structures and relationships. As Lundvall emphasized “a system of innovation...is also a dynamic system, characterized both by positive feedback and by reproductioncumulative causation, and virtuous and vicious circles, are characteristics of systems and sub-systems of innovation” (Lundvall, 1992). Statistical models are based on past conditions and depend on time-series analysis and regression forecasts; econometric models on the other hand are built upon changes in socio-economic conditions (GDP growth, demographics, etc.) (Lyneis, 2000), often including ”judgmental” adjustments to their models in order to account for some non-linear behaviors. As Lyneis points out, these statistical approaches have not done a good job in explaining the complexity of non-linear, dynamic systems because they dont account for capturing the structure of the system which creates behavior over time (Lyneis, 2000). On the other hand, the risks of using discursive approaches, such as expert-based judgments, is that they are influenced by subjective elements, limited knowledge and narrowness in mental models combined with respondent biases, resulting likely in a reflection of a nation‘s reputation rather than its actual state and since it lacks of a hard quantitative basis for sustaining their proposal, they may also fail in explaining the behavior changes over time (van Raan, 2003; Atkinson and Andes, 2009). Structural modeling, through the use of System Dynamics helps in understanding patterns of behavior on complex systems in a more rigorous, scientific and consistent fashion by identifying the key-elements of dynamic complexity: time lags/delays, feedback loops and stocks and flows (Lyneis, 2000; Sterman, 2000). System Dynamics enable us to understand complex non-linear social systems by describing the causal explanations that produce their performance and behavior through causal maps (qualitative approach) and by proposing alternate strategies through rigorous modeling and simulation methods for improving their performance by constructing scenarios and by designing more effective policies (Forrester, 1994; Sterman, 2000). The proper use of System Dynamics for structural modeling provides certain advantages over other measuring and modeling approaches (Lyneis, 2000; Forrester, 1971):
4
• More reliable forecasts of short to mid-term trends than statistical models, since in may complex systems, “structural momentum” dominates over “noise” in the short term (Lyneis, 2000). • Means of understanding the causes of complex non–linear social systems behavior – as seen on Innovation Systems – and thereby changes on its structure as part of trend forecasting. • Models that allow the determination of reasonable scenarios as inputs to decisions, strategies and policies. • Takes account of a system’s dynamic complexity – the counterintuitive behavior of complex systems that arises from the interactions of the agents over time the unanticipated events or side effects that policy makers face when the system behaves in a hardly predictable way. Moreover, System Dynamics has been used in a variety of applications since its beginnings in the 1960’s, taken special attention for this research, on macro-models on science, technology and innovation policies (Soto-Torres et al., 2008; Lee, 2002; Galanakis, 2006; Stamboulis, 2008).
3
Research Design
The research is developed in two phases: Model Building and Model PreTesting.
3.1
Phase 1 - Model Building
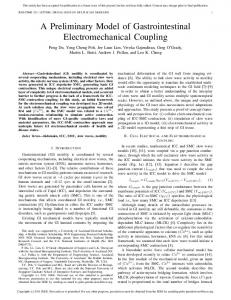
The purpose of this phase is to develop a system dynamics model for a generic Innovation System, based on the theoretical meta-model previously proposed by Uriona Maldonado et al. (ming). Based on their work, we will use the meta-model depicted in Figure 1 to drive our system dynamics model building process. According to Figure 1 the meta-model is made of a Financial component, a Scientific-Technological component, a Production-Industrial component, Market Component and a Workforce component helps in the sense that it relates flows rather than actors or agents by linking processes that occur inside the IS (Uriona Maldonado et al., ming). Despite the over-simplification of Figure 1, the closed-loop relationships in the macro-model are arguably showing the dynamic nature of this complex system.
5
INNOVATION SYSTEM
Qualified human capital
SCIENTIFICTECHNOLOGICAL
Innovative Capability
HUMAN CAPITAL
PRODUCTIONINDUSTRIAL
Investments in human capital
Innovative products
CONSUMER
Funding from Firms Profits
Investments in science and technology
FINANCIAL
Figure 1: Meta-Model of a generic Innovation System - Source: Uriona et al (Forthcoming)
6
Afterwards, we will use causal-loop diagraming (CLD) to represent the most relevant interactions among the five building blocks of the meta-model and then we will translate it to Stock and Flow programming language in order to run different simulations in our pilot study.
3.2
Phase 2 Model Pre-Testing
Once the model has been built, it will be compared against real Innovation System data, taken out of a Federal State in Brazil, in terms of the components of the meta-model and its relationship with CLD and stock and flow diagrams. The pilot study will use data from Santa Catarina State, in Southern Brazil, which has been increasing its investments on science, technology and innovation in the past years.
4
Model Building
The model building phase started with the CLD design, which was based on literature review and on the use of the meta-model proposed by Uriona Maldonado et al. (ming). Figure 2 shows the main CLD which includes 9 reinforcing loops (represented by the R letter) and 9 balancing loops (represented by the B letter). A detailed explanation has been omitted due the space constrains, however, in a nutshell the CLD represents the major relationships between investments (private and public), its use on Research and Development and its results as scientific andor technological outputs, which eventually produce a certain level of innovative capability. As Natera (2011) sustains the innovative capability is the ”ability of a country to produce and commercialize a flow of innovative technology over the long term”, concept borrowed from Furman et al. (2002). We consider the “Innovative Capability” variable essential to the understanding of the dynamics of innovation systems, since as more innovative capability is built, the number of technological innovations increases bringing with it increases on revenues for private and public funding sources which then feedback through the engagement on R&D activities. This innovative capability produces later process and product innovations, which eventually enhances the attractiveness of the product and helps in increasing market share as well. At his point, the model only accounts for STI knowledge disregarding (at least momentarily) the effects of DUI Knowledge, an additional source of knowledge as stated by Jensen et al. (For a broader review see Jensen et al. (2007). STI knowledge is depicted in 7
8
Figure 2: CLD Model for Innovation Systems - Source: Authors
Private R&D Activity
R7
B7
Qualified Human Capital from Private Investments B8
Private funding sources for private R&D -
Public funding sourc es for Private R&D R6
B9
Private Invetsments in Qualified Human Capital
Public funding sources for Public R&D +
Public Investments in R&D
R9
R5
Pressure from private sector to invest in other areas R8 +
+
B5
Public Investments in Qualifiyng Human Capital R3
Public Investment in Science and Tech +
+
Qualified Human Capital + from Public Investments
+
B3
Public Investments in Public Research
+
+ Public R&D activity
Public Funding sources for Public Research
R4
Other Income R2
Income through taxes +
B2 Private Investments in Private Research
Profit
+ Private Research Activity
+
+ B1 Price
+ + Public Research Activity
+
B4
+ + Scientific Output
+
Process Improvements + R1
+
Science and Tech Knowledge
Production Costs New and improved products +
+ Innovative Capability
+
Technological Output
our model of Figure 2 as the Science and Technology Knowledge variable, which feeds up from scientific and technological activities. Following the CLD, the next step was to develop a stock and flow model that could allow for simulation modeling. Figure 3 shows the stock and flow diagram which has been translated from the previous CLD. Once the model has been built we go through the next phase, Model Pre-Testing.
5
Pre-Testing
In the second phase, the stock and flow model was instantiated to represent the situation of the Santa Catarina State Innovation System in Southern Brazil. Santa Catarina (SC) is a Federal State in the southern region of the Federal Republic of Brazil, in terms of GDP it is the sixth in the country. In terms of GDP per capita, it is the fourth with 12.800USD approximately. The Human Development Index (HDI) of the SC State equals 0.840, the second best in Brazil, and the percentage of literacy is 95.6% (3rd better in Brazil). In terms of composition of its industry, 48.5% is manufacturing, 37.2% is services and 14.3% in agriculture. The most important sectors in the SC State are Agribusiness (38% of all SC exports and around 1 bi USD), Furniture/Lumber (800 Million USD in exports), Electro/metal/mechanical (700 Million USD in exports), Textile (260 Million USD in exports), Mining (141 Million USD in exports), Technology (630 Million USD in revenues) and Tourism (780 Million USD in revenues). These sectors are supported by Federal and State funds, which have increased in the last years. Specifically, expenditures on Science and Technology have seen an increase of 131% between 2000 and 2008 for State Expenditures, and of 175% for Federal expenditures on the same period (Sartori, 2011). In this phase, we will run three different scenarios, considering changes in public funding (from Federal or State sources). Scenario 1 considers no changes in the investment capacity of Federal and State entities in SC Innovation System; Scenario 2 considers reductions in the investment capacity of innovative activity in SC and Scenario 3 considers an increase in the investment capacity. Figure 4 shows the comparison of three scenarios in terms of Innovative Capability. As show non Figure 4, the increase on public investments on Sci-
9
Qualifiyng Human Capital from Private Sources
Qualified Human Capital for Private Investment
Private funding for Qualifiyng Human Capital
Private sources for investments in Science and Tech
Private Sources for R&D
Private sources for research
Resources for Science and Tech sales
profit
Profit rate to invest in Science and Tech
average sales expenses sales change due to new and improved products Private R&D activity
Science and Tec h Knowledge
effects
Acquiring knowledge
production costs
sales change due to price
innovative capability
Private Research Activity
process improvements price new and improved products
Qualified Hu man Capital f or R&D
Technological Output
taxa de invest em ativ priv P&D
Public R&D activity
Public sources for Private R&D investments
influence of State funding
public income
income through taxes Scientific Output
Public Investment in R&D
Qualified Human Capital for Research
Public Investment in Science and Tech Public investments for R&D
Public sources for Public R&D investments
other public income
Public Investments on qualifying human capital
Public investments for research
Public research activity Public investments for qualified human capital
public investments in Human Capital
Qualified Human Capital from public investments in R&D
Qualified Human Capital from Public Investments
Qualified Human Capital from Public Investments in Research
10
Qualified Human Capital from private investments in research
Figure 3: Stock and Flow Model for Innovation Systems - Source: Authors
Qualified Human Capital from Private Investments
Qualified Human Capital from private investments in R&D
ence and Technology produces an increase on innovative capability (scenario 3 blue line). innovative capability 0.8
0.6
0.4
0.2
0 0
5
10
15
20
25 30 Time (Year)
35
40
45
50
innovative capability : scenario3 innovative capability : scenario2 innovative capability : scenario1
Figure 4: Comparative results for Innovative Capability - Source: Authors Accordingly, a decrease of public investments produces a decrease on innovative capability (scenario 2 red line) and finally, if previous conditions are kept, innovative capability produces an intermediate outcome as well. It is worth noting that for the first 15 years there is no difference between three scenarios, which means that even when reducing investments, the outcome would not be evident in short term, reinforcing the idea of investment cuts. As the results of Figure 4 shows, the outcomes of reducing or even increasing investments in Science and Technology are visible only in the long term (20+ years). Similar results are evident for Scientific Output and Technological Output, as shown in Figures 5 and 6 respectively. In Figures 5 and 6 the simulation results of scientific outputs and technological outputs respectively, show the same behavioral patterns previously described in innovative capability. Changes in the growth pattern are also evident after the first decade has passed, which in terms of policy making represents that decisions that could endanger the innovative capability of 11
Scientific Output 2
1.5
1
0.5
0 0
5
10
15
20
25 30 Time (Year)
35
40
45
50
Scientific Output : scenario3 Scientific Output : scenario2 Scientific Output : scenario1
Figure 5: Comparative results for Scientific Output - Source: Authors
12
Technological Output 1
0.75
0.5
0.25
0 0
5
10
15
20 25 30 Time (Year)
35
40
45
50
Technological Output : scenario3 Technological Output : scenario2 Technological Output : scenario1
Figure 6: Comparative results for Technological Output - Source: Authors the SC State will only be visible 10+ years after they are implemented. It is also worth noting that in terms of the dimensionless scale used in our simulation runs, Scientific Output grows more than Technological Output for all three scenarios, which depicts a better performance of scientific activities over technological ones.
6
Conclusions
This research proposal deals with one of the main subjects inside IS literature, which is to find ways to properly manage innovation and its impact of economic growth, considering their complexity in terms of dynamics, nonlinear relationships and complex behavior. Until now, the current development of this research has shown that although there is a lack of agreement regarding which components are part of the IS and how to model them, there are commonalities among the models that we can use to propose an integrated model articulated with mathematical simulation tools, specifically System Dynamics tools, in order to properly address the management of Innovation Systems. Although the model has not yet passed through validation, its initial results based on the simulation 13
graphs – show that there are interesting links between the macro–elements of an IS. The further step will be to calibrate the model based on the model validation techniques. Furthermore, the theoretical contribution of this research is that methods such as System Dynamics: a) bring together a whole group of quantifiable indices (creating an explicit relation among them and addressing the single quantitative index problem), (b) quantify qualitative values (rather than disregarding them as being too soft), and (c) bring in both metrics together in an environment where they can be discussed to reach at least some modest degree of consensus; might improve the management and policy making of Innovation Systems, ultimately leading to welfare and economic growth.
References Atkinson, R. D. and S. M. Andes (2009). Benchmarking eu & us innovation and competitiveness. Technical report, The Information Technology and Innovation Foundation. Carlsson, B., S. Jacobsson, M. Holmn, and A. Rickne (2002). Innovation systems: analytical and methodological issues. Research Policy 31 (2), 233–245. doi: DOI: 10.1016/S0048-7333(01)00138-X. Forrester, J. W. (1971). Counterintuitive behavior of social systems. Technology Review 73, 53–68. Forrester, J. W. (1994). System dynamics, systems thinking, and soft or. System Dynamics Review 10 (2/3), 245–256. Presented at the international System Dynamics Annual Conference, Sterling, Scotland, July 1994. Also available as M.I.T. System Dynamics Group Memo D-4405-1. Freeman, C. (1987). Technology policy and economic performance: lessons from Japan. London: Pinter Publishers. Furman, J. L., M. E. Porter, and S. Stern (2002). The determinants of national innovative capacity. Research Policy 31 (6), 899–933. Galanakis, K. (2006). Innovation process. make sense using systems thinking. Technovation 26 (11), 1222–1232. Godin, B. (2009). National innovation system: The system approach in historical perspective. Science Technology Human Values 34 (4), 476–501. 14
Jensen, M. B., B. Johnson, E. Lorenz, and B. A. Lundvall (2007). Forms of knowledge and modes of innovation. Research Policy 36 (5), 680–693. Lee, S. H. and T. Yoo (2007). Government policy and trajectories of radical innovation in dirigiste states: A comparative analysis of national innovation systems in france and korea. Technology Analysis & Strategic Management 19, 451–470. Lee, T. L. (2002). Dynamic Analysis of the National Innovation Systems Model: A Case Study of Taiwans Integrated Circuit Industry. Ph. D. thesis. Liu, X. L. and S. White (2001). Comparing innovation systems: a framework and application to china’s transitional context. Research Policy 30 (7), 1091–1114. Lundvall, B. A. (1992). National Systems of Innovation. Towards a Theory of Innovation and Interactive Learning. London and New York: Pinter Publishers. Lyneis, J. M. (2000). System dynamics for market forecasting and structural analysis. System Dynamics Review 16 (1), 3–25. ISSN: 0883-7066. Melo, A. (2001). The innovation systems of latin america and the caribbean. Technical report, Inter-American Development Bank. Natera, J. M. (2011). The dynamics of national innovation systems: A panel cointegration analysis of the coevolution between innovative capability and absorptive capacity. Nelson, R. (1992). National innovation systems: A retrospective on a study. Ind Corp Change 1 (2), 347–374. Nelson, R. (1993). National Innovation Systems: A Comparative Analysis. New York and Oxford: Oxford University Press. Sartori, R. (2011). Governanca em Agentes de Fomento dos Sistemas Regionais de CT&I. Ph. D. thesis. Scheel, C. and J. Parada (2008). Leveraging competitiveness and economic growth through linking innovation systems to wealth creation in emerging countries. In PICMET: Portland International Center for Management of Engineering and Technology, Proceedings, pp. 572–583.
15
Soto-Torres, M. D., R. Fernandez-Lechon, and P. F. Soto (2008, July 20-24, 2008). The influence of subsidies on economic development: a system dynamics model. Stamboulis, Y. (2008, July 20-24, 2008). Exploring the system dynamics of innovation systems. Sterman, J. D. (2000). Business Dynamics. Systems Thinking and Modeling for a complex world. Boston: Mc Graw Hill Higher Education. Uriona Maldonado, M., A. Phadtare, J. Shah, and R. Pietrobon (Forthcoming). Towards an innovation systems meta-model: A systematic review of the literature. Research Policy. van Raan, A. F. J. (2003). The use of bibliometric analysis in research performance assessment and monitoring of interdisciplinary scientific developments. Technikfolgenabschtzung Theorie und Praxis 12 (1), 20–29.
16