Moreover, the 555 timer is connected in astable vibrator ... implementing 555 timer when the inductive coil was varied for .... [14] E. A. Parr, IC 555 Projects.
3URF��RI�WKH������,(((��UG�,QWHUQDWLRQDO�&RQIHUHQFH�RQ�6PDUW�,QVWUXPHQWDWLRQ��0HDVXUHPHQW�DQG�$SSOLFDWLRQV��,&6,0$����� � ������1RYHPEHU�������3XWUDMD\D��0DOD\VLD�
A Pressure Sensor Based Inductive Transducer Designed for Biomedical Applications First Atika Arshad1, Kushsairy Abdul Kadir2, Sheroz Khan1, A.H.M Zahirul Alam1 and Rumana Tasnim3 �
'HSDUWPHQW�RI�(OHFWULFDO�DQG�&RPSXWHU�(QJLQHHULQJ��,QWHUQDWLRQDO�,VODPLF�8QLYHUVLW\�0DOD\VLD��0DOD\VLD� � 'HSDUWPHQW�RI�(OHFWULFDO�(QJLQHHULQJ��8QL./�%0,��0DOD\VLD�� � 'HSDUWPHQW�RI�0HFKDWURQLFV�(QJLQHHULQJ��:RUOG�8QLYHUVLW\�RI�%DQJODGHVK��'KDND��%DQJODGHVK� ��DWLNDDUVKDG#KRWPDLO�FRP�
Abstract— This paper presents an inductive pressure sensor which can be employed for the acquisition of biomedical signal, and these signals can be extremely vital in monitoring and diagnosing human body conditions. Based on the nature of the application, such implementations require precise and real time measurement for measuring any biomedical parameters. The proposed inductive pressure sensor is based on the basic principle of producing inductive changes in response to the movement of a core towards a coil. Using the inductive coil, the physical parameter that is the movement of iron core is translated into a signal with proportionate output frequency change. This type of sensor offers some important criteria like high level of linearity and sensitivity. The proposed pressure sensor can be very effective as it can be used in many biomedical applications. Keywords—Inductive pressure sensor; displacement; variable inductance
I.
INTRODUCTION
Pressure in different organs of human body (e.g., brain, eye, heart, bladder) is largely regulated and its absolute value can determine patients’ health condition and disease progression. Sometimes the capability to normalize these pressures can be absent or sometimes the functional impairment can also be occurred. Continuous monitoring of the pressure or the change of internal pressure detection is indispensable. Obtaining a patient’s pressure data is a general phenomenon which gives limited information of the pressure profile of the organ of interest. Also it cannot capture trough values or variations in the profile which is unable to give significant clues to inform proper intervention approaches. Therefore advancements in sensing techniques for enabling precise, suitable and incessant pressure monitoring can be very effective for disease management. The development of lightweight, miniature and energy proficient circuit solution for healthcare sensor applications is a progressively vital research interest keeping in mind the fast technological advancement in healthcare monitoring tools, and microfabrication processes. This geared up the researchers and scientists to work on diagnosis and sensing procedures over the last few decades. Sensors have proven its significance by measuring immeasurable physical quantities like vibrations, displacement, pressure, effect of forces into qualitative and quantitative electrical signal for real life implementation. In recent times, a number of pressure sensors with high sensitivity
978-1-4673-7255-8/15/$31.00 ©2015 IEEE
and linearity have been developed. The real time application of such sensing technique is visible in medical science. For instance, if the pressure in cardiovascular system is to be measured, an implantable medical device will be suitable since previously used battery powered miniature active transmitters had limited lifetime. Researchers in [1] developed a capacitive type blood pressure measuring sensor in combination with a telemetric system to be used in implantable medical device. This system was able to record blood pressure variation animatedly although the resolution of this system showed poor performance. Later on some other researchers worked on this kind of capacitive based pressure sensors which demonstrated small temperature hysteresis and a good level of sensitivity with poor level of linearity [2-5]. The conventional Linear variable differential transformer (LVDT) based pressure sensors (LVDT) showed a good level of sensitivity, they are physically huge while being compared with other sensors [6], [7]. Moreover, the precision of these sensors suffer from nonlinear behavior which is why some other researchers worked towards improving the linearity level of their input-output characteristics [8] for health monitoring. Another type of sensor namely piezo-resistive sensors has demonstrated acceptable linearity and sensitivity although they are badly affected by huge temperature hysteresis [9]. Very recently a highly sensitive pressure sensor has been developed [10] by some researchers based on the technique of changing inductance of a coil. A prototype sensor was built as well as tested to show a change in inductance of nearly 34.5 mH over a pressure range of 10 kPa. An important application of inductive transducer based pressure sensor is fabrication of such sensor on a chip which is fitted to a pacemaker [11]. The device consists of coils of micro-dimensions interfaced with a timer in an oscillator mode. The heartbeat puts a pressure that moves the core. This leads to inductance changes converted as frequency or duty cycle output. This output frequency is analyzed to prove the importance of coil pressure sensor and its biomedical applications. Another work by [12] demonstrated the use of pressure sensor for biomedical pressure sensing applications designed for continuous intraocular pressure (IOP) monitoring in glaucoma patients. The sensor is implanted between the orbital bones and eyeball. An external coil is used to turn around an eyeglass
which creates a magnetic field and whose flux lines are affected by the sensor. This creates some computable variations of impedance in the external coil due to the changing pressure on the sensor. This paper aims to present a pressure sensor based on inductive transducer which is of miniature size and offers excellent linearity level. The orientation of this work has been set into a number of sections. Section I gives a descriptive picture of various sensing systems in terms of accuracy, sensitivity and linearity. Section II is supported by briefing the principle upon which the function of the reported transducer is based. Section III depicts the sensor circuit design along with derivation. Simulation results and analysis are given in section IV; while conclusion is presented in section V. II.
WORKING PRINCIPLE
An inductive transducer consists of three basic elements, coil, moveable core and a sensing element. This mechanism is illustrated in Fig. 1. With the displacement of core, a force is exerted, thereby making the displacement to be proportional to the force. This displacement will be linked to the inductance of the coil. From these aspects, the pressure as a function of inductance can be calculated, hence making it as an effective tool to be implemented for pressure sensor in different applications. As the inductive transducer or sensor will convert any physical quantity into electrical quantity, this mechanism can be implemented in different applications. The inductance variation will give different output in term of frequency or voltage; it can be used for identifying object purpose. Thereby this inductive based transducer is being used extensively for metal detection application. A good level of linearity and high sensitivity can be attained by changing the mechanical parameters of the sensor. The principle of the sensor (Fig. 1) is to make a variable inductance mechanism. As per the geometrical dimensions, the inductance of a coil can be determined by equation (1), where the length of coil is denoted by O, O-x is the specific length of coil that is determined when there is no displacement inside the core from position ‘b’ to ‘c’. In this position (from b to c), permeability remains μ0, (permeability of air or free space) since no variation in permeability occurs. The displacement of a specific material from position ‘a’ to ‘b’ is denoted by x. A variation in the permeability is observed with the variation of such displacement. The variation in permeability is addressed by relative permeability (μ0.μr) of the inserted material
Fig. 1. A movable core is placed inside the inductive coil as pressure acts on the core.
An expression for total inductance, L, is expressed as follows: Assuming N as the number of turns per unit length of the coil of total length l, A is the cross-sectional area of core, and μ as the permeability of the core, for a particular distance x, the total inductance will be given by,
/ $ −& =
μ0 1 2 $ § [ O
§ ¨¨ + μ U ¨1 − O © ©
[ ·· ¸¸ O ¹ ¸¹
(1)
Equation (2) indicates the displacement of position from C to A. /& − $ =
μ0 1 2 $ § O
[ § [ ·· ¨¨ μ U + ¨1 − ¸ ¸¸ O ¹¹ © O ©
(2)
A linear relationship has been achieved in Figure 4. The inductive variation in the circuit shown in Fig. 4 is based on the physical parameter. This physical parameter is basically the displacement of core towards the coil. The signal output over the total range of the physical parameter is addressed as a response. This response stays linear over the complete range. Equation (1) and (2) is plotted to indicate how the displacement of the core from position A to position C and also from position C to A affects the inductance of the coil. Fig. 2 illustrates this response.
Fig. 2.
Change in inductance (H) with respect to the displacement x (m).
The graph obtained in Fig. 2 is a plot of change in inductance (H) against the displacement (X). The graph demonstrates the inductive response of the core and its displacement as the core enters in and out of the inductive coil. The response is basically symmetrical, as if it is a two way movement repeating entirely at differential occurrence. It can be stated that when the core moves from position A to position B, the inductance of the core changes with its displacement, the change in inductance is proportional to the displacement of the core. A linear relationship for the inductance of the coil moving forward and backward in responses to displacement of the core is obtained.
III.
SENSOR STRUCTURE AND DERIVATION
In this paper, an inductive type pressure sensor is proposed. This sensor will then be tested to measure force. A timer 555 is used in this work and connected in astable mode. This timer is connected to inductive coil. The exerted force acting on the coil will make some changes. The changes in the inductance of the coils are reproduced as changes in the frequency output of timer 555. The force will be varied by its displacement, and the outcome will be studied. If force F moves form position A to Position B, and back to position A, the output digital frequency as a function of this displacement between A and B will be plotted. Simulation is carried out in several stages. The first stage is to simulate the astable timer. Timer 555 is connected in astable vibrator mode using RL external element. For a given value, the frequency output is plotted. From the plotted output, we can relate on calculation and theoretical with the simulated result. The next stage is to connect an inductive coil to the circuit. This inductor will acts as the pressure sensor. The pressure here will be represented by the displacement of the force acting on the coil. The value used for the inductor is varied to show the linearity and proportionality. The block diagram of the proposed sensor is shown in Fig. 3.
I =
( )
0.092 5O 2
μ 0 1 $(μ U O + [(1 − μ U )) 2
(4)
To attain the position of the core as a function of applied pressure, a minimum inductance is calculated to be; 3min =
)min $
(5)
In a mechanical structure a spring (as in Fig. 3) is linked to the core material, the force acting to the compression of the spring is given by ) = N[ , where k is the spring constant. Therefore, the displacement of the core is indeed a function of the frequency and pressure, which is denoted by [10], [=
(3 − 3min ) $ N
(6)
The frequency, f can further be simplified to equation (6) as a function of pressure and its displacement denoted by [10], I =
0.092 5NO 2 μ 0 1 $(Nμ U O + (1 − μ U )(3 − 3min )$) 2
(7)
For the prototype device described in this paper, the parameters and physical quantities are given in the following. • The length of the core and coil is set as 20mm. • The mass of core is from 0.68g to 0.98g. • The coil turns are (N) 100 in number. • The coil radius is 1mm and its resistance is 1k. • Iron core’s relative permeability is 4728. Fig. 3.
Block diagram of the inductive pressure sensor, to measure the change in inductance L.
With the movement of a mobile material inside the core by any changes of physical phenomena (pressure), the coil with mobile material makes significant variations in the inductance. In accordance with the change of permeability of material, changes in inductances with the corresponding output are observed. Here the changes in the inductance of the coil are represented as changes in the frequency output of the astable 555 timer. If the force F moves from position A to position B, and back to position A, the output digital frequency can be denoted as a function of this displacement as respect to change in inductance. A good level of linearity and proportionality can be observed with the varying inductance. Moreover, the 555 timer is connected in astable vibrator mode using RL external element. The frequency of the timer is given by [14], f = 0.092 R/L
(3)
By substituting equation (1) into (2), the frequency is such as,
•The measured displacement changes from 0.001 to 0.020m. • The spring constant, K, is 91.33N/m. •The maximum inductance, L is obtained and the minimum was determined by Lmin=Lmax/μr for various core materials. IV.
RESULTS AND DISCUSSION Pspice simulation of Fig. 4 was carried out in order to obtain the simulation results. The 555 timer is an integrated circuit that is being used for the purpose of oscillation generation. The inductance of the coil that acts as the model physical parameter is connected to the timer circuit. This will convert any changes into frequency output as seen in Fig. 5.
change in the output waveform was observed, hence, this is due to no change in inductance. Furthermore, when the material was moved in the opposite direction, the output waveform resulted in decreasing of the pulse width, this indicated that there is decrease in inductance. The results are tabulates as seen in Table 1 for the displacement of the material.
Fig. 4.
Schematic diagram of proposed pressure sensor. Fig. 6.
Fig. 5.
Experimental setup.
Frequency output waveform for change in inductance value for 5mH, 10mH 15mH and 20mH.
Fig. 5 shows the simulation results obtained for implementing 555 timer when the inductive coil was varied for three different values of inductance (3mH, 4mH and 5mH). By noting equation (3), it can be stated that a change in inductance value will produce an equivalent change in the frequency, thus a change in the waveform is produced by the 555 timer circuit. An experiment was conducted based on Fig. 3, firstly the astable circuit was built on a breadboard then a coil, which represents the sensor was placed between two resistors. The experimental setup can be seen in Fig. 6. The parameters of the coil used is; 1000 number of turns, a diameter of 2cm, and length of 4cm. The inductance of the coil was found to be 17.60 mH. The circuit is then connected to a power supply of 5V and the output is observed on the oscilloscope. The test material being used is iron. An iron nail of length 10cm is inserted to and fro into the core coil. Finally the effect of the material displacement is recorded for every 1cm movement to and fro. Fig. 7 illustrates the result observed when the material was towards and away from the core. It is noted that the output signal which is the square wave had wider width as the displacement was taking place towards the core and vice versa when the displacement took place away from the core. From this it can be concluded that; when a material moves inside the core, the inductance value increases, hence the time delay also increases. When the material was fully inside the core, no
Fig. 7.
Output waveform observed when the material was moving in and out of the core.
increase in inductance. The position between the points 6-12 shows a constant slope, this indicates there is no change in inductance. A similar observation is noted when the material is being removed from the core, however the observation is in reverse to when the material was moving inwards. Table 1: Output pulse width for material displacement
Position
Displacement of the material (cm)
1 2 3 4 5 6 7 8 9
0 (material outside the core) 1 2 (material half way through the core) 3 4 (material fully inside the core) 5 6 7 7 (material begins to move in opposite direction) 6 5 4 3 2 (material half way outside) 1 0 (material fully outside)
(a) Graph of pulse width against position of the material.
10 11 12 13 14 15 16
Pulse width (μs) 55 58 60 65 68 70 70 70 70 70 70 70 68 60 58 55
(b) Graph of pulse width against position of the material moving inside the core.
(c) Graph of pulse width against position of the material moving out of the core. Fig. 8.
Output waveform observed when the material was moving in and out of the core.
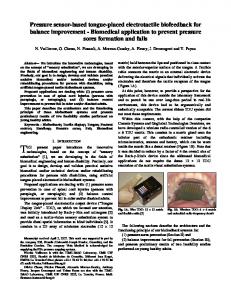
Fig. 8 shows the performance of the transducer in response to the displacement of the material. The pulse width of the output is plotted against the position of the material labeled from 1-16. The position 1-8 represents the movement of the material forward and the position 9-16 represents the movement backwards. It can be noted that the slope of the graph is increasing between positions 1-6, which indicates an
V. CONCLUSION An inductive pressure sensor is proposed in this paper which shows an excellent linear behavior. The sensing technique has brought about an inductive change by changing the physical parameters of the sensor into electrical one. The results are achieved keeping in mind its application for acquisition of biomedical signal from a human body using an interface circuit. The linearity achieved in this case is much higher than reported one in the literature. Also because of miniature size of the sensor along with interface circuit, it will occupy little room to make it suited for implantable and other biomedical device. In future this integrated system is expected to be combined with a passive telemetry link appropriate for blood-pressure measurements and implementation. Also the future work targets the proper optimization for sensitivity, resolution and testing in real time applications. REFERENCES [1]
[2]
[3]
C. Stavros, Dimitris Tsoukalas, and P. A. Neukomm, “A miniature pressure system with a capacitive sensor and a passive telemetry link for use in implantable applications,” Journal of Microelectromechanical Systems, vol. 9, no. 1, pp. 18-23, March 2000. A. Gefen, “Pressure-sensing devices for assessment of soft tissue loading under bony prominences: Technological concepts and clinical utilization,” Wounds, vol. 19, no. 12, pp. 350–362, 2007. A. V. Chavan and K. D. Wise, “Batch-processed vacuum-sealed capacitive pressure sensors,” J. Microelectromech. Syst., vol. 10, no. 4, pp. 580–588, December 2001.
[4]
E. G. Bakhoum and M. H. M. Cheng, “Capacitive pressure sensor with very large dynamic range,” IEEE Trans. Compon, Package. Technol., vol. 33, no.1, pp.79-83, March 2010. [5] H. A. Razak, A. Zayegh, R. Begg and Y. Wahab, “Foot Plantar Pressure Measurement System: A Review,” Sensors 2012, vol. 12, no. 7, pp. 9884-9912, 2012. [6] A. Dyer, “Survey of Instrumentation and Measurement,” New York: Wiley, 2001. [7] W. C. Dunn, “Fundamentals of Industrial Instrumentation and Process Control,” Boston, MA: Artech House, 2005 [8] P. Misra, S. K. Mohini, and S. K. Mishra, “Poster abstract: Ann-based non-linearity compensator of lvdt sensor for structural health monitoring.,” In Sensys ACM, pp. 363–364, 2009. [9] C. R. Jeevandoss, M. Kumaravel and V. K. Jagadeesh, “An Innovative Method for Determining the Junction Temperature of a Photovoltaic Cell,” IEEE I2MTC, pp. 1847-1850, May, 2012. [10] G. B. Ezzat, H. M. Cheng, “High-Sensitivity Inductive Pressure Sensor,” IEEE Transactions on Instrumentation and Measurement, vol. 60, no. 8, August 2011.
[11] L. Shuenn-Yuh, C. Cheng and M. C. Liang, “A Low-Power Bidirectional Telemetry Device with a Near-Field Charging Feature for a Cardiac Microstimulator,” IEEE Transactions On Biomedical Circuits And Systems, vol. 5, no. 4, pp. 357-367, 2011. [12] S. Lizón-Martínez, R. Giannetti, J. L. R. Marrero, and B. Tell, “Design of a System for Continuous Intraocular Pressure Monitoring,” IEEE Transactions on Instrumentation and Measurement, vol. 54, no. 4, August 2005. [13] A. Arshad, S. Khan, A.H.M. Zahirul Alam and R. Tasnim, “An Investigation of Soft Magnetic And Non-magnetic Materials Under Low Frequency” IIUM Engineering Journal, vol. 12, no. 6, pp. 59-70, 2011. [14] E. A. Parr, IC 555 Projects. London, U.K.: Babani Publ., Ltd., pp. 13, 1981. [15] A. Arshad, S. Khan, R. Tasnim, A.H.M. Zahirul Alam, “Modeling of Inductive Coupling Transducer for Activation of Low Wattage Electronic Implants”, IEEE Regional Symposium on Micro and Nanoelectronics (RSM), pp. 75-79, 2011.


![CS450/CS455 Pressure Transducer - Campbell Scientific [PDF]](https://m.moam.info/img/260x300/cs450-cs455-pressure-transducer-campbell-scientifi_64c912cf098a9e2b6c8b45ca.jpg)


