A Prioritization Process Rick Botta, BAE Systems A. Terry Bahill, PE, University of Arizona
Abstract: A prioritization process has been developed and used at Network Systems of BAE Systems. It has been used to derive weights of importance for the criteria in tradeoff studies and to prioritize goals, customer needs, capabilities, risks, directives, initiatives, issues, activities, requirements, technical performance measures, features, functions and value engineering activities. This article presents this prioritization process. Keywords: Requirements, Priority, Weight of Importance, Order, Rank EMJ Focus Areas: Quantitative Methods & Models, Systems Engineering
Why Is Prioritization Important? To help select a new car to purchase, assume that you will use evaluation criteria of five-year life-cycle cost, horsepower, and safety. The five-year life cycle cost (in U.S. dollars) includes purchase price, taxes, licenses, loan interest, insurance, gasoline, and maintenance. The horsepower is the peak SAE net horsepower. The safety rating is 0 to 5 stars based on the National Highway Traffic Safety Administration’s front and side crash test and rollover ratings. Assume that you have narrowed the field to three cars. One is best on five-year life-cycle cost, the second car is best on horsepower, and the third car is best on safety. Which car should you buy? Your answer obviously depends on which criteria are most important to you. To help you make this decision, it would be nice to have a prioritization process. This article describes such a process. Development of this prioritization process was stimulated by a need to prioritize requirements, but the resulting prioritization process is not limited to requirements. It can also be used to derive weights of importance for tradeoff studies and to prioritize customer needs, capabilities, risks, activities, and functions. First, we will discuss some of the reasons that requirements should be prioritized. Then, we will discuss prioritization of other items and, finally, we will present the prioritization process. A requirement is a statement that identifies a capability needed by a system in order to satisfy customer needs. A functional requirement defines what, how well, and under what conditions one or more inputs must be converted into one or more outputs at the boundary in question in order to satisfy the customer’s needs. A customer’s need might be to solve a problem, achieve an objective, or satisfy a contract, standard, or specification (Bahill and Dean, in press). For small projects the requirements might be put in an Excel spreadsheet; for large projects, the
requirements might be put in a requirements database. With either implementation, one of the attributes must be priority. Why should you prioritize requirements? 1. If the project is budget-constrained, prioritization will help you decide which requirements should be implemented and which should be candidates for elimination. 2. If the project is time-constrained, prioritization will help you decide which requirements should be implemented first. Often the product is delivered in phases. At each delivery, the system must have testable functionality. Prioritization helps you choose the functions to implement in each phase. 3. Prioritizing scenarios and identifying benefits, costs and dependencies will help create the system architecture. 4. Prioritization improves customer satisfaction by increasing the likelihood that the customer’s most important requirements are implemented and delivered first— customers like to see their funds being used effectively and wisely. 5. Prioritization will allow you to spend more time and effort reducing risks associated with hard technical problems and key performance parameters. 6. You might want to assign your best people to the highest priority requirements. 7. Prioritizing requirements will help you manage requirements creep. If requirements being added are high priority, then they might displace some lowpriority requirements. 8. Prioritizing requirements will reduce discussion time at meetings and reviews. 9. Prioritizing requirements will help identify the highpriority requirements for which you should create Technical Performance Measures (TPMs) (Oakes, Botta, and Bahill, 2006). Some requirements are more important than others; therefore, requirements must be prioritized. Build the most important features of the system first, making the critical functionality available to the users as soon as possible and leaving the less important features for future releases. Requirements prioritization enables implementation of the highest priority requirements first. To effectively prioritize requirements, you should consider risk, criticality to mission success, customer satisfaction, commitment, architecture, business value, priority of scenarios, benefit, cost, benefit to cost ratio, implementation time, when it is needed, frequency of use, safety, complexity, implementation difficulty, stability, dependencies, infrastructure, and reuse potential. Individual requirements can be prioritized or requirements can be grouped into functional categories and these new categories can be prioritized.
Refereed management tool manuscript. Accepted by Associate Editor Needy. 20
Engineering Management Journal
Vol. 19 No. 4
December 2007
Prioritization is a negotiation process that involves a wide range of project stakeholders, including the customer, user, project manager, chief engineer, architect, maintainer, etc.; however, it is ultimately up to the customer to determine which requirements are more important, but obviously, the contractor is responsible for working with the customer to define the relative importance. This means that the contractor’s requirements team cannot prioritize requirements in a vacuum—it must be done in conjunction with the customer. But getting the customer to prioritize requirements may not be as easy as it seems. The real value in prioritizing requirements comes when you have tight delivery schedules, staffing shortages and/or budget constraints. The value is delivering something that is useful to the customer even if you do not deliver all the requirements, since you have ensured the most important requirements are addressed. Requirements should be prioritized early in the system life cycle. Setting relative priorities during the requirements development phase: 1. Reveals to the contractor what the customer deems important 2. Helps balance customer expectations against available resources 3. Helps produce realistic schedules 4. Supports design tradeoff decisions 5. Helps formulate the system architecture. If features are planned for future development, then prioritization facilitates architecture such that adding lowpriority features later will not require redesign of the architecture. The product can be developed incrementally with high-priority requirements in early versions and low-priority requirements in later versions (Hooks and Farry, 2001). The preceding paragraphs specifically discussed requirements prioritization; however, prioritization is also applicable to deriving weights of importance for the criteria in tradeoff studies and to prioritizing goals, customer needs, capabilities, risks, directives, initiatives, issues, activities, use cases, technical performance measures, features, functions and value engineering activities. For these other tasks, some things will be different. For example, in prioritizing design activities, external constraints or changes in the intended operational environment may make some activities infeasible; therefore, they will be dropped. This is possible but not likely with requirements. In deriving weights of importance for the criteria in tradeoff studies, cost might be treated as an independent variable and hence not be in the criteria set for the tradeoff study. An important purpose in prioritizing requirements and design activities is scheduling the work—this is not true for prioritizing technical performance measures where all TPMs are managed throughout. One purpose of prioritization is to identify features that should be candidates for elimination; this is much more common for goals, customer needs, and capabilities than it is for requirements. When a project is nearing the end of a development phase (or spiral, iteration, time box) and it appears that you cannot produce all of the features that were scheduled during an iteration, do not slip schedule and delay the review until all the features are finished. Instead, push some low-priority features into the next iteration. Prioritization of features helps determine which features get delayed. This approach obviously depends on the contracted life cycle model. Furthermore, low-priority features should be renegotiated with the customer to see if they are really necessary. Changes to customer funding profiles may force lowpriority features to be deleted. Engineering Management Journal
Vol. 19 No. 4
All features will not be implemented equally—some will get extra-special polish. Companies often seek advice from outside consultants for the highest priority features. Also, they often assign their best people to the high-priority features and contract out the low-priority ones. As a noncommercial example, consider Little League baseball: the most important positions are pitcher and catcher. So where do coaches put their best athletes? Pitcher and catcher. Furthermore, the highest priority features might be subjected to more reviews and more thorough testing. Even if the extra testing is not planned, it will happen because of the nature of regression testing. In regression testing, at the end of a life cycle phase all completed features are tested. In the next phase, more features are added. And at the end of this phase, all competed features are tested—those completed in the second phase as well as those completed in the first phase. Thus, features finished first will be tested in every iteration. Priorities will change as you talk with your customer and gain a better understanding of your customer’s needs, as the environment changes, as the stakeholders change, as various features are implemented, as the system matures as its architecture develops, and as uncertainty is resolved; therefore, the priorities of all features should change with time (Gilb and Maier, 2005). Criteria That Help Prioritization Exhibit 1 lists criteria that are useful for prioritization. Cost is obviously an important criterion in most decisions. Cost should include money as well as other resources such as time, labor, finances, overhead, infrastructure, shipping, etc. In purchasing a new car, cost would include purchase price, taxes, licenses, loan interest, insurance, gasoline, and maintenance. Benefit is a measure of the good things that accrue due to acquiring a feature. This would include performance measures such as speed, mean time between failures, requests served per minute, market percentage, quality, convenience, testability, accuracy, etc. In purchasing a new car, horsepower is an important performance measure. Some criteria naturally go together, like peanut butter and jelly; therefore, cost and benefit are often combined into the benefit to cost ratio. Putting cost in the denominator gives low priorities to high-cost, low-value features. Of course, if you are using the benefit to cost ratio, then you should not include cost and benefit as separate criteria. In an ideal world, criteria used for prioritization would be completely independent; however, for modern complex systems this is not possible. The criteria in Exhibit 1 are meant to be orthogonal and as independent as possible. It is important that you do not look for derived effects. For example, features that affect the system architecture should be given a high priority because, in general, features that are likely to cause a lot of changes in other systems should be given a high priority; however, when assessing features that affect the architecture, do not derive the conclusion that they subsequently increase cost and risk and, therefore, give them low priorities. If you continually look for interactions, you will never finish the prioritization process. The criteria of Exhibit 1 are not listed in any particular order, although the top of the list has criteria that are more general. Of course, the criteria to be used must be tailored for the particular company and for the type of business. All of the criteria in Exhibit 1 would not be useful in all industries, and other criteria would have to be added for some industries. Some customers may allow no flexibility in requirements or schedule. This article is written for people who have flexibility in when and
December 2007
21
Exhibit 1. Criteria that are Useful in Establishing Priorities Criteria
Rationale
Risk
Work on high-risk features first in order to reduce risk; in addition, high-risk features are more likely to change thereby producing changes in other features. So working the high-risk features first will reduce the rework due to changing features. Furthermore, if it were impossible to satisfy the high-risk features and the project were cancelled, you would have saved the money that otherwise would have been squandered satisfying low-risk features. High-risk features should have high priorities (Jacobson, Booch, and Rumbaugh, 1999). Risk should be quantified as frequency of occurrence times the severity of consequences (INCOSE, 2004).
Criticality to Mission Success
Satisfy your customer’s critical needs first. These might be stated in the vision or mission statements.
Customer Satisfaction
Features that will increase customer satisfaction should get high priorities.
Commitment
If you told your boss (or your customer) that you would do something, then it should have high priority. If the organization said that it wanted a task done, then the task should have high priority.
Architecture
Give high priorities to features that will have a large impact on system architecture, because these will cause changes in many other entities.
Business Value
Different features will have different value to the business: some features have tactical usefulness, whereas others have long-term strategic value. If you are presenting your features to the President of your business unit, and you can only present three features, which would they be? These features should have high values for this criterion.
Priority of Scenarios
Give high priorities to features involved in scenarios (use cases) that are important for business goals.
Benefit
Give high priorities to features that increase performance measures such as speed, mean time between failures, requests served per minute, etc.
Cost
A basic business goal is to produce return on investment (ROI). Therefore, high-cost features should have low priorities. The cost for each feature would be the summation in dollar values of labor, travel, and material. This then may have to be converted into the range of values being used for the other criteria. Other measures that could be used for cost include internal rate of return, net present value, and payback period.
Benefit to Cost Ratio
Benefit and cost are often combined as a ratio. Putting cost in the denominator gives low priorities to high-cost, low-value features.
Implementation Time
Features that will take a long time to implement should have high priorities, to make sure they get scheduled early.
When it is Needed
Features that should be scheduled early, because of desire or constraints, should have high priorities.
Frequency of Use
Things that will be used often should have high priorities. For example, in software, code contained inside nested loops will be executed very often; therefore, it should have high priority and should be optimized.
Safety
Safety-critical features should have high priorities.
Complexity
Complex features should have high priorities. You should assign your best people to complex features.
Implementation Difficulty
Features that will be hard to implement should have high priorities. Attributes that can make implementation difficult include large size, tedium, uncertainty, novelty, number of people involved, and organizational constraints. Complexity and implementation difficulty are independent. For example, diagnosing illness is complex, but if the diagnosis is correct, implementing the cure is simple. Whereas describing a program to find 128-bit prime numbers is simple, but implementing the computation is difficult.
Stability
Implement stable features first. Identify features that are likely to change. If the changes have an external cause, give the feature a low priority, thereby giving the changes a chance to occur before you work on the feature. But if the changes are likely to be caused by work done on that feature, then give it a high priority to force the changes early.
Dependencies
If item A depends on item B, then B’s priority should be at least as high as A’s. If many other functions depend on a particular function, then give it a high priority. On the other hand, activities, such as optimization, that will have to be redone when other parts of the system change, should be given low priorities.
Infrastructure
If a system is a critical part of a bigger system, then it should have a high priority. On the other hand, if it depends critically on other systems, then perhaps its implementation should be delayed until the other systems are stabilized.
Reuse Potential
If an item is highly reusable, then give it a high priority.
22
Engineering Management Journal
Vol. 19 No. 4
December 2007
Deriving Values for the Criteria The prioritization process consists of first deriving values for all the criteria for all the features and then combining the data to reveal the priorities. Common criteria scales include: a. Low, medium, and high b. Optional, conditional, and essential c. Nice-to-have, goal, highly desired, and must achieve d. Numeric (e.g., 0 to 10) It is very important, however, to use the same range for all criteria. You should not use a range of 1 to 3 for one criterion and 0 to 10 for another (Bahill and Karnavas, 2000). Obtaining a consensus on criteria values might require a group decision support technique, e.g., voting, Delphi, the analytic hierarchy process, or specialized facilities and software. In an ideal world, to get the criteria values and priorities, you would first talk to the customer, but the following sequence is more realistic: The systems engineer assigns straw man values to all the criteria for all the features. These values are typically numbers (usually integers) in the range of 0 to 10, where 10 is the most important. The next step is to meet with specialty engineers and domain experts. The systems engineer should lead a discussion of each criterion in Exhibit 1 and try to get a consensus value for each feature. In the first pass, the engineers might evaluate each criterion and its context and then take the average value. After the in-house evaluation, the prioritizations should be taken to the customer (however many people that might be). The chief engineer should lead a discussion of each criterion in Exhibit 1 and try to get consensus values for all the criteria for all of the features; however, if the customer only looks at one or two criteria and says the feature is a 10, then it’s a 10. If the customer says that all criteria are very important, just continue with the process, because later on in the process the evaluation data may prioritize the features. Of course, as with all systems engineering processes, prioritization is not a waterfall process. It is highly iterative and many tasks can and should be done in parallel. In the beginning of a program, no one generally has a good understanding of the complexity, dependencies, and reuse potential. As knowledge about the system is developed, the prioritization process will be refined. Prioritization is a communication tool—the numbers that are derived are not as important as the understandings. There are alternatives to the above procedure: 1. Instead of assigning a number between 0 and 10, the systems engineer, in conjunction with the customer, could rank all the features. Sometimes this technique works in spite of being methodologically flawed. It is flawed because we are adding the weighted scores; therefore we need cardinal numbers (e.g., if feature A gets a score of 6 and feature B gets a score of 3, then feature A should have twice as much worth or utility as feature B), not ordinal (as in rank order) numbers. 2. The systems engineer can help the customer make pair-wise comparisons of all the features and then use the analytic hierarchy process to derive the values (Saaty, 1980). This
Engineering Management Journal
Vol. 19 No. 4
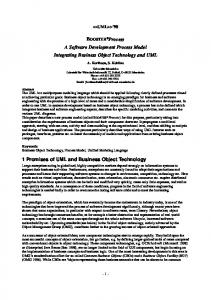
would not be a practical approach without a commercial tool such as Expert Choice. Tools that implement the analytic hierarchy process add value by producing a consistency index that shows how consistent the pair-wise comparisons were. For example, if the domain expert said that A was preferred to B, and B was preferred to C, then we would expect him or her to say that A is preferred to C. The consistency index indicates how consistent the comparisons were throughout the entire matrix. Normalization Values for the criteria could come in a variety of formats, for example, (low, medium, high), (0 to 10) or natural units that might run, for example, from one thousand to one million dollars. In order to combine apples and oranges like these, the values must be normalized. The values can be normalized with scoring (utility) functions (Daniels, Werner, and Bahill, 2001) so that all of the resulting scores are between 0 and 1. Exhibit 2 shows a typical scoring function for the cost criterion: higher cost gives a lower score. A simple program for implementing such scoring functions is available for free at http://www.sie.Arizona.edu/sysengr/slides/ SSF.zip. If scoring functions are thought to be too complex, Exhibit 2. Scoring Function for the Cost Criterion
��������������������������������� ���
�����
how well various features are implemented; however, a list should not be prioritized if the cost of prioritizing is not far less than the cost of doing the tasks. For example, for most people, it would not make sense to prioritize a grocery shopping list.
��� ��� ��� ��� ��� �
��
��
��
��
���
�����������
then simple linear normalization (as explained in the following paragraphs) will work. Suppose that a person is interested in buying one of three cars: car A produces 290 horsepower, car B produces 240 hp, and car C produces 170 hp. We want to normalize these values so they can be combined with other dissimilar data. First we must choose the input range over which we will normalize. The range could be legal values, the highest to the lowest values that would ever be expected, or maximum and minimum constraints given by the customer. If data are available for typical alternatives and software is available to update the weights when new alternatives are introduced, then real data could be used. In this example, let us choose the highest to lowest values that would ever be expected. Let us choose 100 to 400 hp. The general formula for linear normalization is: scorej =
valuej – valuej min valuejmax – valuej min
(1)
∈[0,1]
where the index j indicates the particular feature being evaluated. min Let the index j be Horsepower, then valuehp = 100 and max valuehp = 400 we get: valuehp – 100 scorehp =
December 2007
400 – 100
23
scorehp (car-A) = scorehp (car-B) = scorehp (car-C) =
290 – 100 400 – 100 240 – 100 400 – 100 170– 100 400 – 100
=
Exhibit 4. Evaluation Criteria and Values for Three Automobiles
190
= 0.63
300
(2) Evaluation Criteria
(3)
= 0.47
(4)
= 0.23
Five-year Life Cycle Cost (U.S. $) Horsepower (hp) Safety (stars)
This linearly normalized function is shown in Exhibit 3.
Car A Boxster
Car B S2000
Car C Miata
$52,000
$34,000
$22,000
290
240
170
4
5
3
Exhibit 3. Linear Normalization of the Horsepower Criterion
Next, we need to determine the range of each criterion. As mentioned above, there are several choices for the range. For this example, let us use the real data from Exhibit 4. For the three cars that we are examining, the maximum and minimum five-year life cycle costs are $52,000 and $22,000 (Exhibit 5).
��������������� � ��� �����
�����
���
Exhibit 5. Range of Values for Five-year Life Cycle Cost
�����
��� �����
��� � �
���
���
���
���
Five-year Life Cycle Cost
Value for the Worst Alternative
Value for the Best Alternative
$52,000
$22,000
�����������
Deriving Weights of Importance There are a dozen methods for deriving numerical values for the weights of importance for the evaluation criteria (Buede, 2000; Daniels, Werner and Bahill, 2001; Kirkwood, 1999; Weber and Borcherding, 1993). These methods can be used by individuals or teams. If the decision-makers are subject matter experts and simple qualitative comparisons will be made, then it is often sufficient to just ask the decision makers, “How important are each of these criteria? Give each a number between 1 and 10.” We would not expect a domain expert to give a weight of 0; however, a weight of 0 can be given to criteria that have no effect on the output—but whose consideration should be made prominent. Later the weights can be normalized so that they sum to 1. When the output values will be used for numerical comparisons in complex high-risk situations, then more quantitative methods might be useful. When the weights are to be assigned using both the decision makers’ relative importance and the expected range of input values, then the method of swing weights (as explained in the following paragraphs) can be used. Creating two sets of weights might be useful—one from the customer’s perspective and the other from the contractor’s perspective. The Method of Swing Weights Let us now explain one particular method—the swing weight method—using our example of selecting a new car. As evaluation criteria we will use five-year life cycle cost, horsepower, and safety. The five-year life cycle cost (in U.S. dollars) includes purchase price, taxes, licenses, loan interest, insurance, gasoline, and maintenance. The horsepower is the peak SAE net horsepower. (The Horsepower to Weight Ratio, however, might have been a better criterion.) The safety rating is 0 to 5 stars based on the National Highway Traffic Safety Administration’s front and side crash test and rollover ratings. Exhibit 4 has values for some typical cars. 24
Next, let us take horsepower. The three cars that we are examining have a minimum horsepower of 170 and a maximum of 290 (Exhibit 6). Exhibit 6. Range of Values for Horsepower
Horsepower
Value for the Worst Alternative
Value for the Best Alternative
170
290
Our third criterion is safety. The three cars have minimum and maximum values of 3 and 5 stars (Exhibit 7). Exhibit 7. Range of Values for Safety
Safety
Value for the Worst Alternative
Value for the Best Alternative
3
5
We now have definitions and ranges, measured from worst to best, for each of the three criteria that matter the most to us for selecting a new car. Other characteristics such as color or type of transmission may also be important considerations in the choice of a car; however, we are assuming that on all these other criteria the differences between the cars from which you are choosing are unimportant. This does not mean that these other characteristics do not matter, but only that, in the context of this choice, they are unlikely to vary sufficiently that you will have to make explicit tradeoffs among them.
Engineering Management Journal
Vol. 19 No. 4
December 2007
Now imagine a hypothetical car that is the worst it can be on all three criteria. In other words, its five-year life cycle cost is $52,000, its horsepower is 170, and its safety rating is 3 stars. Suppose that you can change the value of one (and only one) of these criteria on this hypothetical car from the worst to the best. This means that you can change only one of the following: • Five-year life cycle cost from $52,000 (worst) to $22,000 (best) • Horsepower from 170 hp (worst) to 290 hp (best) • Safety from 3 (worst) to 5 (best). Which one would you want to change? Suppose you say five-year life cycle cost. That means that you value a $30,000 drop in price (a change from $52,000 to $22,000) more than you do either an increase of 120 horsepower or an increase of 2 stars of safety. This criterion, the one that you most want to change from worst to best, is the one you weight most highly in the context of this problem. Assign it a score of 100 points. Now, which criterion do you value second? Let us say it is horsepower. Ask yourself, “How much less do I value the 120 horsepower change compared to the $30,000 drop in price?” Suppose that you value it one-half as much. Then you would assign it 50 points, or half the weight you gave to the most important criterion. Now look at the last criterion—safety. Because this criterion is ranked below horsepower, it should get fewer points. For example, if you value it two-thirds as much as horsepower, then give it 33 points. Note that this also means you are saying that safety, with its 33 points, is only one-third as important for this decision as the five-year life cycle cost. All that remains is to normalize the weights so that they add up to 1, as shown in Exhibit 8. Combining the Data Now that we have values and weights of importance for the criteria we must combine them. There are dozens of methods for combining these data (Daniels, Werner and Bahill, 2001). The most common is the simple sum of weights multiplied by criteria values. This additive method is appropriate when the decisionmakers’ preferences satisfy additive independence (Keeney and Raiffa, 1976), which is the case for most industry applications we have seen. This method is implemented with Equation 5 to compute the priority of the ith feature. Priorityi = wtRisk × Riski + wtComplexity × Complexityi
(5)
– wtCost × Costi + wtReuse × ReusePotentiali + ... This simplistic technique uses very simple mathematics. The weights and the criteria values are all integers between 0 and 10. Usually this technique gives good results.
The criteria to be included must be tailored for the individual decisions. Criteria that do not differentiate between alternatives can be omitted or be given a weight of zero. Other criteria, such as security and resources (in addition to the already included cost and time resources), might be added. IBM has a criterion of, “Can it be implemented in the future as easily as it can be added today?” The following alternative equation gives more importance to the Cost criterion:
Priorityi =
[
n
∑ wt jCriterion j
j=1
]
i
(6)
Costi
where n is the number of criteria you have chosen to include. If you use Equation 6, you should, of course, remove both the cost and the benefit to cost ratio from the criteria set being summed in the numerator. Using this equation, cost would not need to have the same range as the other criteria—dollar values could be used. Of course, this prioritization process is iterative. The first pass will show the most important features. These features might then be scheduled to be implemented first, which would change their values in the When it is Needed criterion. This simplistic technique usually works because the purpose of prioritization is communication. The numbers themselves should not be used in numerical calculations. If the priority values are to be used for calculations, then a more sophisticated technique must be used. Using Normalized Data If the priority values are to be used in calculations, then the weights of importance must be normalized so that the sum of the weights is 1.0, and the values of the criteria must also be normalized with scoring (utility) functions (Daniels, Werner and Bahill, 2001) so that the scores for the criteria are all between 0 and 1. Earlier we said that high-cost features, features that are likely to be changed by outside forces, and features that must be redone as the design progresses should be given low priorities. What does low priority mean? Does it mean a small weight of importance? No, because these criteria may be important. Does it mean a negative weight of importance? No, because the weights are supposed to be normalized so that they add up to one. It means that a large value for one of these criteria should reduce the priority score of the feature under consideration. OK, how can we do this? One of the reasons for using scoring (utility) functions (even if they are just simple linear transformations) is to ensure that more is better for all scores. For example, we might consider less cost to be better than more cost. The scoring function of Exhibit 2 inverts the Cost relationship so that a larger output score is better. Our combining equation now becomes:
Exhibit 8. Weights of Importance for Selecting a New Car Weight of Importance
Car A Boxster
Car B S2000
Car C Miata
Five-year Life Cycle Cost (US $)
0.55
$52,000
$34,000
$22,000
Horsepower (hp)
0.27
290
240
170
Safety (stars)
0.18
4
5
3
Evaluation Criteria
Engineering Management Journal
Vol. 19 No. 4
December 2007
25
Priorityi = wtRisk × RiskScorei + wtComplexity × ComplexityScorei + wtCost × CostScorei + wtReuse × ReusePotentialScorei + ...
(7)
If your customer wants to use the benefit to cost ratio instead of cost, this term could be added to the equation in either of these forms: Priorityi = wtBenefitCostRatio ×
BenefitScorei CostScorei
+ ...
(8)
or Priorityi =
BenefitScoreiwtBenefit + ... CostScoreiwtCost
(9)
The wtBenefit and wtCost in Equation 9 are indeed exponents, as they must be for the product-combining function (Daniels, Werner and Bahill, 2001). Other Fields That Use Prioritization DARPA’s Image Understanding programs use change detection algorithms to prioritize imagery for exploitation by image analysts (Jackson and Pierce, 2002). Cognitive decision models have been used to prioritize e-mails (Lee, Chandrasena and Navarro, 2002). Knowledge management activities have been prioritized using a matrix with levels of potential intervention (goals, knowledge, business processes, and data) and scopes of intervention (individual, team, organization and business environment) (Bornemann and Sammer, 2003). Google prioritizes the search entries that it presents to the user. Prioritization is used extensively in the medical field. One application is to prioritize prevention strategies. For example, of the four dozen risk factors for cataracts, the highest priority prevention strategies are to avoid tobacco smoke and avoid UV-B by using shade, sunglasses, and brimmed hats (McCarty, Nanjan, and Taylor, 2000). In the value engineering improvement technique, the value of a function is defined as the ratio of a function’s worth to its cost. The goal is to increase value while maintaining quality either by improving the function or reducing its cost. Value engineering should use a prioritization process, to ensure that the most important functions are worked on first. Other Methods for Prioritization Other methods that have been used for prioritization include Quality Function Deployment (Bahill and Chapman, 1993; Ghiya, Bahill and Chapman, 1999) and the Analytic Hierarchy Process (Saaty, 1980). Prioritization is different from performing a tradeoff study. In a tradeoff study, the criteria are specific to the problem domain (Daniels, Werner and Bahill, 2001). In the prioritization process presented in this article, the same criteria (with some tailoring) should be used for all prioritization tasks. The purpose of a tradeoff study is to select one or a few alternatives from a large list (Smith, Son, Piattelli-Palmarini, and Bahill, 2007). The purpose of prioritization is to prioritize the whole list and possibly eliminate a few features. Scheduling the development of features is not a purpose of tradeoff studies. Completeness of Coverage In retrospect we asked ourselves if the criteria of Exhibit 1 would give an even coverage of an organization’s aspirations and needs. To answer this question we looked at frameworks. 26
Frameworks help people organize models of their enterprises. This organization helps ensure interoperability of systems and helps control the cost of developing systems. The Zachman framework provides a general schema that can be used to organize and assess completeness of descriptive representations for a complex enterprise. To ensure a complete and holistic understanding of the enterprise, it is necessary to develop models that address the perspectives and aspects that constitute the rows and columns, respectively, of the framework (Bahill, Botta and Daniels, 2006). Therefore, we mapped the criteria of Exhibit 1 to the rows and columns of a Zachman framework. Criticality to Mission Success is in row 1, the scope of the organization. Business Value and Benefit to Cost ratio are in row 2, the business model. Architecture is in row 3, the system model. Complexity, Implementation Difficulty and Dependencies are in row 4, the technical model. Finally, Reuse Potential is in row 5, the detailed representation. Now for the columns, in a risk analysis, you look at the high-risk entities and ask, “What could possibly go wrong?” Hence Risks are in column 1–What. Implementation Difficulty quantifies how things are done; hence it is in column 2–How. Architecture describes the positioning and interconnection of things, so it is in column 3–Where. Commitments are made to people, therefore Commitment goes into column 4–Who, along with Customer Satisfaction. When it is Needed is in column 5–When. Business Value and Benefit to Cost Ratio have to do with the motivation of people and the organization, so they are in column 6–Why. So, although the criteria of Exhibit 1 do not fill all 36 cells of a Zachman framework, they do cover each row and each column. Therefore, the criteria of Exhibit 1 should cover the aspirations and needs of most organizations. Future Work We would like many intelligent people in many domains to use this prioritization process and then give us feedback, such as the list of criteria that they actually used along with their weights of importance. We want to know the domain in which it was used, such as DoD, commercial aerospace, NASA, medicine, government, or law, and the type of items that were prioritized, such as requirements, functions, or activities. Proprietary data is not desired, such as the actual items that were prioritized or their values. We will use this feedback to expand and refine our criteria set. Perhaps we will generate different criteria sets for different domains. Summary Requirements, goals, customer needs, capabilities, risks, directives, initiatives, issues, activities, features, functions, technical performance measures, and weights of importance for the criteria in tradeoff studies should all be prioritized. Prioritization will help with budget, schedule, system architecture, customer satisfaction and risk reduction. Prioritization can be very simplistic using integers from 0 to 10 for the weights and the values, or it can be robust, using normalized weights of importance and scoring functions for the criteria. Sometimes it is useful to create two sets of priorities—one from the customer’s perspective and the other from the contractor’s perspective. Exposing these conflicting objectives often explains existing misunderstandings. References Bahill, A. Terry, Rick Botta, and Jesse Daniels, “The Zachman Framework Populated with Baseball Models,” Journal of Enterprise Architecture, 2:4 (November 2006), pp. 50-68.
Engineering Management Journal
Vol. 19 No. 4
December 2007
Bahill, A. Terry, and William L. Chapman, “A Tutorial on Quality Function Deployment,” Engineering Management Journal, 5:3 (1993), pp. 24-35. Bahill, A. Terry, and Frank F. Dean, “Discovering System Requirements,” in Handbook of Systems Engineering and Management, Andrew P. Sage and William B. Rouse (Eds.), John Wiley & Sons, first edition (1999), pp. 175-220. Bahill, A. Terry, and William J. Karnavas, “Risk Analysis of a Pinewood Derby: A Case Study,” Systems Engineering 3:3 (2000), pp. 143-155. Bornemann, Manfred, and Martin Sammer, “Assessment Methodology to Prioritize Knowledge Management Related Activities to Support Organizational Excellence,” Measuring Business Excellence, 7:2 (2003), pp. 21-29. Buede, Dennis M., The Engineering Design of Systems: Models and Methods, John Wiley & Sons (2000). Daniels, Jesse, Paul W. Werner, and A. Terry Bahill, “Quantitative Methods for Tradeoff Analyses,” Systems Engineering, 4:3 (2001), pp. 199-212. Ghiya, Kinnar K., A. Terry Bahill, and William L. Chapman, “QFD: Validating Robustness,” Quality Engineering, 11:4 (1999), pp. 593-611. Gilb, Tom, and Mark W. Maier, “Managing Priorities: a Key to Systematic Decision-making,” Proceedings of 15th Annual International Symposium of INCOSE, Rochester, NY, (July 2005). Hooks, Ivy F., and Kristin A. Farry, Customer-Centered Products: Creating Successful Products Through Smart Requirements Management, AMACOM (2001). INCOSE, INCOSE Systems Engineering Handbook v2a, (2004), retrieved March 2007, http://www.incose.org/ProductsPubs/ incosestore.aspx. Jackson, Pamela, and William G. Pierce, “Artificial Intelligence’s Role in Advancing the National Imagery and Mapping Agency (NIMA),” USAWC Strategy Research Project, U.S. Army War College, Carlisle Barracks, PA, (April 2002), pp. 1-44. Jacobson, Ivar, Grady Booch, and James Rumbaugh, The Unified Software Development Process, Addison-Wesley (1999). Keeney, Ralph L., and Howard Raiffa, Decisions with Multiple Objectives: Preferences and Value Tradeoffs, John Wiley & Sons (1976). Kirkwood, Craig, W., “Decision Analysis,” in Handbook of Systems Engineering and Management, Andrew P. Sage and William B. Rouse Eds., John Wiley & Sons (1999), pp. 1119-1145. Lee, Michael D., Lama H. Chandrasena, and Daniel J. Navarro, “Using Cognitive Decision Models to Prioritize e-mails,” Proceedings of 24th Annual Conference of the Cognitive Science Society, (2002), pp. 478-483. McCarty, Catherine A., Mukesh B. Nanjan, and Hugh R. Taylor, “Attributing Risk Estimates for Cataract to Prioritize Medical
Engineering Management Journal
Vol. 19 No. 4
and Public Health Action,” Investigative Ophthalmology and Visual Science, 41:12 (2000), pp. 3720-3725. Oakes, James, Rick Botta, and A. Terry Bahill, “Technical Performance Measures,” Proceedings of 16th Annual International Symposium of INCOSE, Orlando, FL, (July 2006). Saaty, Tom L., The Analytic Hierarchy Process, McGraw Hill (1980). Smith, Eric D., Young Jun Son, Massimo Piattelli-Palmarini, and A. Terry Bahill, “Ameliorating Mental Mistakes in Tradeoff Studies,” Systems Engineering, 10:3 (2007), pp. 222-240. Weber, Martin, and Katrin Borcherding, “Behavioral Influences on Weight Judgments in Multiattribute Decision Making,” European Journal of Operational Research, 67:1 (May 1993), pp. 1-12.
About the Authors Rick Botta is the director of systems engineering for BAE Systems in San Diego. He holds a BS in computer science from California Polytechnic State University, San Luis Obispo. He has a quarter-century experience in a wide variety of engineering, engineering management and program management roles involving development and integration of complex, software-intensive systems. He is a member of INCOSE. A. Terry Bahill, PE, is a professor of systems engineering at the University of Arizona in Tucson. While on sabbatical from the University of Arizona, he did research with BAE Systems in San Diego. He received his PhD in electrical engineering and computer science from the University of California, Berkeley, in 1975. Bahill has worked with BAE Systems in San Diego, Hughes Missile Systems in Tucson, Sandia Laboratories in Albuquerque, Lockheed Martin Tactical Defense Systems in Eagan MN, Boeing Information, Space and Defense Systems in Kent, WA, Idaho National Engineering and Environmental Laboratory in Idaho Falls and Raytheon Missile Systems in Tucson. For these companies he presented seminars on systems engineering, worked on system development teams, and helped them describe their systems engineering process. He is a Fellow of the Institute of Electrical and Electronics Engineers (IEEE), of Raytheon, and of the International Council on Systems Engineering (INCOSE). He is the Founding Chair Emeritus of the INCOSE Fellows Selection Committee. He is a registered professional engineer in California and Pennsylvania. Contact: Terry Bahill, PE, Systems and Industrial Engineering, University of Arizona, Tucson, AZ, 85721-0020; phone: 520-621-6561;
[email protected]
December 2007
27