Rs 1 0.024 11 Rr I 0.014 11 Xm 1 3.0623 fl. 1 XIS I 0.0864 11 Xlr I 0.0564 11 H. Difierent linearizations of the single machine model were computed around 12 ...
IEEE Transactions on Power Systems, Vol. 1 1, No. 4, November 1996
1983
A Probabilistic Approach to Aggregate Induction Machine Modeling Aleksandar M. Stankovi?
Bernard C. Lesieutre'
Northeastern University Massachusetts Institute of Technology
Abstract In this paper we pursue probabilistic aggregate dynamical models for n identical induction machines connected t o a bus, capturing the effect of different mechanical inputs t o the individual machines. W e explore modei averaging and review in detail four procedures for linear models. W e describe linear systems depending upon stochastic parameters, and develop a theoretical justification f o r a very simple and reasonably accurate averaging method. W e then extend this t o the nonlinear model. Finally, we use a recently introduced notion of the stochastic norm t o describe a cluster of induction machines undergoing multiple simultaneous parametric variations, and obtain useful and very mildly conservative bounds on eigenstructure perturbations under multiple simultaneous parametric cariations.
1 Introduction The aggregate modeling of induction machines is important in cases in which it is impossible or impractical to include models of individual machines. In transient stability studies an aggregate model is used to represent t h e part of the power system load associated with induction motors; there are wide variety of different machines and it is impossible to model each device. Aggregation techniques are also important in situations in which many known induction machines are connected in parallel such as in wind farms.
96 WM 265-9 PWRS A paper recommended and approved by the IEEE Power System Engineering Committee of the IEEE Power Engineering Society for presentation at the 1996 IEEEPES Winter Meeting, January 2125, 1996, Baltimore, MD. Manuscript submitted January 3, 1995; made available for printing November 30, 1995.
The goal of aggregate modeling for loads is to capture physical phenomena associated with induction motors that constitute part of the load. In a wind power application the goals include the ability to predict generation capability given an expected wind distribution across the farm, and t a predict the dynamic behavior of the system given a network disturbance. The aggregate modeling of induction machines has been addressed extensively in the literature, and here we review only the references relevant to our approach. Almost exclusively, the model of a single machine is chosen for the aggregate model. Much effort has then been spent on the determination of the aggregate machine parameters. In [l] there is a discussion of standard techniques for estimating induction motor parameters. Typically, equivalent machine parameters are calculated from individual machine parameters using some type of weighted average based on the the individual machine ratings [2, 11. This works best when all of the motors are similar and are similarly loa.ded. In cases with many different machines it has been suggested that a combined model containing two induction motor models should be used [l]. In [3], the authors suggest a method in which the electrical parameters are aggregated by connecting irripedance branches in parallel (very similar to [l]),and estimate the aggregate motor inertia using physical arguments (not a weighted average). In [4] the authors model each motor by a dynamic Thevenin equivalent and combine them using standard techniques. The mechanical inertia in [4] is determined from the conservation of kinetic energy. In the ideal case in which all induction machines are identical and ate identically loaded it is straightforward to rigorously derive an aggregate average model and, in fact, all methods referenced above will give this same model. This is not the case when the machines are different and have different loadings. Departing from the ideal case, we examine identical induction machines connected in parallel subject t o different torque inputs described by a probability density function (pdf). We believe this is a reasonable approach because in almost all situations involving the aggregation of a large number of machines,
0885-8950/96/$05.00 0 1996 IEEE
1984
neicher the parameters nor the mechanical inputs are known exactly. Our numerical experiments suggest that pdf estimation procedures yield useful results for the case of wind farms. In that case the machine parameters are known with some certainty, however the mechanical torque due to the wind is not homogeneous across the farm. We also discuss methods for the extension to include parameter variations as well. Given a probabilistic description of the load we develop an average model that captures the expected values of important induction motor dynamic variables. First we examine methods for the aggregation of linearized models. We discuss techniques for achieving the desired model and iqtroduce and justify a heuristic method that works well and is easy to compute. We then apply this heuristic to the nonlinear model. Our approach is particularly successful in predicting the total reactive power for a cluster of induction machines. Finally we discuss problems aiising from multiple simultaneous machine parametei variations.
2
Dynamic Modeling
ds
= Tm-EbI~-E;lq
(1)
FVe c a n solve the algebraic constraints for the curi e n t to achieve a third-order system of real, nonlinear
differential equations. Linearization of the equations around a n operating point gives a linear model in standard state-space form:
?IT
L?Q]* and ii = [Tm are deviation variables and inputs, respectively. Xext, we consider a typical induction machine with the parameters given in Table 1.
where Z = [S
Table 1: induction machine data (all in D.u.) .
Rs 1
1 XIS I
0.024 0.0864
11 Rr I 0.014 11 X m 1
11
Xlr
I
0.0564
I
'ai
;
.........
-
7-t
. .. . ....... . .....................................
pIxu...
D .
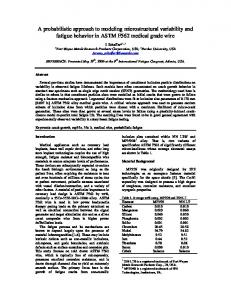
Figure 1: Eigenvalues for equilibria corresponding to torques 10% to 12O%, in steps of 10% to load torques of 0.1 pu, 0.2 pu and so on, up to Eigenvalues of these linearized model exhibit an interesting pattern, as seen in Fig 1; they are tightly clustered, with a complcy conjugate pair being at approximately -1s k j45, and a real pole a t around -3O.Xs the torque increases, the pair moves (slowly) away from the imaginary axis, while the real pole moves towards the origin (with a value of -27.4 for the 1.2 p.u. torque). These results suggest that an aggregate h e a r model could capture important aspects of the dynamics of the cluster of machines having different operating points and experiencing steps in torque.
T, = 1.2p.u.
Let us consider the following model for one machine in a cluster zs
2 H -dt
"i "i
I
3.0623
11 H I 0.4238
fl
Difierent linearizations of the single machine model were computed around 12 equilibria csrresponding
3
Averaging Model
the
Dynamical
We describe first a straightforward (and computationally intensive) conceptual procedure to obtain a nonlinear aggregate model that is the best approximation (in a precise sense) of a cluster of induction machines. In this procedure we w u m e that we have available a statistical description (say a pdf) for the pre-disturbance equilibria, and a similar description for the disturbances (for example, steps in load torques). We specify a structure for our aggregate model, for example the induction machine model with adjustable parameters. We shall also assume that the pre-disturbance equilibria and disturbances are statistically uncorrelated, so that the order of averaging (over pre-disturbance equilibria and disturbances) can be exchanged as needed. Then our conceptual procedure involves the following three steps: 1. A choice of the time horizon of optimization T ; 2.
1985
Simulation of trajectories from different initial states and for relevant disturbances (i.e. the evaluation of the flow of the vector field (1)-(5)), and calculate the average trajectory (that starts from the expected value for the pre-disturbance equilibrium). This step is computationally quite burdensome; 3. Optimization over the model parameters (six in our example) to get the trajectory that best approximates the average trajectory over T in a chosen norm.
is affected by the statistical descriptions for predisturbance states and for disturbances and by the choice of T , as the optimal solution has to trade-off errors in the beginning of the transient with steadystate errors (which start to dominate as T increases). For example, for large T , one very good suboptimal solution is (Aes)-I = &,,[A-'], which can be seen in (10) as t -+ o, assuming stability.
3.2 3.1
Averaging model
a
linear
dynamical
The just described general (nonlinear) model averaging procedure will now be modified to exploit advantages of the linear setting. We have available analytical formulas for the system trajectories, but we are also more demanding as we are looking for a procedure that will perform direct averaging over matrices, instead of generating all the relevant trajectories first, as in the step two of the procedure for the nonlinear model. Let 10 denote the initial state, and let A and B denote the corresponding linearization matrices (observe that A depends on X O ) - then [SI:
Jo
-
If we consider the deviations Z ( t ) = ~ ( 1 ) I O ,then for the torque step driven response, B = [l 0 OlT, Zo = 0 and U(.) = T, (the net step in torque).
) the equilibwhere i ( t ) is the deviation of ~ ( tfrom rium value of I. Then (assuming A invertible)
With xo and T, statistically independent as before, we get the expectation (over joint pdf for IO and T,, that factors under the independence assumption):
E[?@)] = €~[Tm]&,~[(e~('~)~ - I)A(zo)-']B (10) A similar calculation can in principle be performed if "0 and T, are statistically dependent and the joint pdf is known, but it requires a much better knowledge of the operating conditions of the cluster. Sow the task is to find A,, for an averaged, expected value system:
A heuristic for linear model averaging
In this section, we describe a heuristic for the generation of a good aggregate model that operates directly with A matrices, while assuming that T is large enough for the steadystate error to be important. We study the derivation of average models by averaging the eigenvalues and eigenvectors directly, and compare with the direct averaging of A matrices or their inverses. In all cases we compare the averaged dynamics with the dynamics of a cluster of 12 machines with random equilibrium torques. The comparisons are done in both the time-domain [step responses) and the frequency domain (Bode plots). We consider the torque step as input, and we define the D and Q axis currents ID and IQto be the outputs of interest. Let us describe the case with discrete probability functions first - there are n possible A matrices corresponding to each machine with associated probabilities PI,and distinct machines in a cluster are statistically independen't. Each A matrix is assumed to have distinct eigenvalues and the separation between the eigenvalues is large enough so that cIasses can be established (three in the example, one corresponding to real poles of all matrices, and one for each member of the conjugate pair). Thus in each class we have n eigenvalues, with their real parts being PI, and corresponding probabilities pi that are associated with "parent" matrices. We define the weight associated with D I as Ti
= --Tr %e
1/Pl x kPklpk
where TI is the time constant associated with the mode of the I-th matrix, and Taveis the average time constant (over all matrices). Then we define the weighted average with factor that favors real parts of eigenvalues that are closer to the imaginary axis (since they are "felt longer" in the step response): " I=1
which after some algebra gives that is the best approximation 'to E [ $ ] over the interval T (in a chosen metric). The choice of A,,
(12)
1986
We observe that the formula (14) is similar in its appearance to the “parallel impedance” formula, but note that pi, 5 1 guarantees that < p > r will be bounded by the smallest and the largest pi,. The continuous version is immediate:
Observe that since the matrices we are studying have distinct eigenvalues, they can be written in the form
Method I I1 I11 IV
I
ID 0.14 1.99 0.63 0.44
I I
IQ 0.27 11.16 4.18 2.96
Method 111:
1. For each entry (say k-th) of De, find the two A i with closest k-th eigenvalues, and denote the matrices with A1 and A?, and the distances from the k-th entry of De,to the corresponding eigenvalues of the two matrices with cll and d?. Let the eigenvectors corresponding to the k-th eigenvalue for the two matrices be v i and vi. Then we evaluate the averaged eigenvector as:
2 . Form the equivalent eigenvector matrix with colurnns v;q
v,,= [
v;q
]
(18)
3. Calculate the equivalent A matrix as
A,, =
veqD e ,
VG’
(19)
The continuous version of this method requires finding (on the curhe In the complex plane corresponding to the k-th class of poles) the pole closest to the k-th entry of D,,, and later evaluating the corresponding matrix of eigenkectors, and A e g ,as above. Our >lethod I1 differs in that the equivalent eigenvector matrix is obtained by direct averaging of the eigenvectors Method 11: k=l
where, as before, p k are the probabilities associated with the matrices .4k and v k are corresponding matrices of right (normalized) eigenvectors. Other methods that we explore are the direct avmatrices eraging of .-I
11
I
IQ 0.29 25.21 9.60 6.79
n
= where V is the matrix of (normalized) right eigenvectors and D is a diagonal matrix of eigenvalues. Our heuristic procedure yields an equivalent D e g ,and we can proceed in at least two ways in order to generate Our Method I involves the following steps (ass~ ming the discrete probability case, with n possible ,-! matrices, denoted with A!) JIethod I:
ID 0.26 4.55 1.31 0.92
PkAk
(21)
k=l
and the averaging - - of inverses Method IV: n
k=l
We pause to emphasize that these methods may result in A,, that do not correspond to the linearization of the nonlinear model for any choice of parameters. The probabilistic model does not fit a linear model of a single machine.
3.3
Time and frequency-domain comparisons
Next we shall compare the averaged dynamics with the dynamics of a cluster of 12 machines with random equilibrium torques. Each of the machines is assumed to have an equilibrium torque distributed uniformly between 0.13 and 1.23 pu (0.63 pu corresponding to the nominal slip) in steps of 0.1 pu. Throughout our simulations consider the torque step as input, and we define the currents I D and IQ to be the outputs. In the Table 2 we compare the discrepancies between the actual (simulated) outputs and those predicted by various equivalent dynamical models. Only the ratios of numbers presented are to be used for comparisons, as the absolute values of errors depend on sidulation details (time increment and step size). We present results for two time horizons, 1 sec and 5 sec (the longer time horizon accentuates the steady-state mismatches). A11 errors are measured in the quadratic norm (square root of the sum of squares of pointwise errors a t successive time instances). The same ordering of the methods was observed in other numerical experiments, with the relative difference between the Methods I and IV being somewhat smaller. For the same cases, as shown in Table 2, we have evaluated the frequency responses (Bode plots) over a range of frequencies, and compared with the equivalent transfer function obtained using the Method I. The difference between the magnitude and phase plots is hardly noticeable On the basis of previously presented results, it seems that the Method I
1987
is slightly preferable over the Method IV; both are advantageous over the Method 111, while the Method I1 is the distant last. The relative success of Method IV can also be justified analytically. It is straightforward t o show that the integral of the difference between the impulse responses of the expected values system (11) and the espected value of the linearized system (6) over an infinite time scale is identically zero. The usefulness of this comes by noting that the A,, of Method IV satisfies the expected value in steady state
assuming the disturbance is independent of the operating point. While many possibilities for A,, will satisfy Equation (24), A;: = &=[A-’]seem sensible as we are assuming a number of identical machines connected in parallel.
4
Averaging Model
the
Nonlinear
llethod IV in the previous section can be extended to the nonlinear model by examining an expected dynamic system with desirable steady-state properties. The resulting model is similar to the standard model (1)-(5), but includes a constant in equation (2) related to the probability distribution function describing the load [9].
where
with b y being the variance of the input torque (which is assumed to have a non-zero mean). In 191 the authors assume that a distribution in slip is specified; here we assume that the machine is operating in the linear portion of the torque/speed curve and specify the probability distribution function in terms of the input torque, T,. This model works well for capturing dynamics associated with changes in the load an networks. To test this system we examine a cluster of 12 induction machines with load torques equally spaced between 0.13 and 1 23 pu in steps of 0.1.In Figure 2 we show the response due to a 10% increase in applied torque evenly across the machines and a step increase of 10% in the torque applied to the probabilistic model, and, for reference. a 10% increase in the torque applied to single machine model. The actual expected value transient
-O
3
9
Figure 2: Time response to a 10% torque increase is labeled “A”, the response predicted from the a p proximated model (with K p d J ) is labeled “B”, while the response of the single machine is labeled “C”. The probabilistic model thus shows a noticeable improvement over the single machine model in both steadystate and transient characteristics. The results presented in the previous sections have immediate use in the study of wind farms. The model (25)-(26) can be used to study the espected value characteristics provided a statistical description of torque due to the wind is available. In [this case the steady-state conditions obtained from the equations presented here give an accurate estimate of the active and reactive power of the farm [9] (this problem is noted in [SI). The results presented here suggest that asingle machine equivalent model may be improved through a slight modification in the form of the model. In our departure from the ideal, we included the constant Kpdf to capture effects due a probabilistic description of the load.
5
Parametric Variations
In this section we examine the effect of parameter variations on model aggregation. This complicates the problem due to nonlinearities involved, as even a computation of the liinear expected value model given a probabilistic description of the loads and parameters is difficult. We next describe a versatile technique that can be used to examine the validity of an expected value linear model under parametric variations. We apply the stochastic norm theory introduced in [6] t o estimate the difference between the modes of the system and the modes predicted by the expected value system. A random perturbation matrix , AA, from the expected value matrix A is as-
1988
sumed to be of the form
AA = S, H S F
(27)
where S, and S, are positive semidefinite scaling matrices for columns and rows, respectively, and elements of H are uncorrelated with mean zero and variance 1. From this description we can compute conservative (but not over cautious) bounds on the difference between the eigenvalues of the expected value linear system and those of the actual system (the reader is referred to [6] for the details.) We denote regions in the complex plane a circles centered around the expected value of the eigenvalues whose radius is given by the deviation of the eigenvalues resulting from the perturbation and measured in the stochastic norm. If the regions do not intersect then we expect that the reduced-order model will work sufficiently well for our purposes. T h e challenge in using this technique is specifying the details of the random perturbation matrix given by Equation (27). .is an example, we consider the case of simultaneous, independent variations of several machine parameters. We assume the deviations t o be given by normal pdf, with values given in Table 3: and
These choices yield ll4Allls = 7.80 ,while our numerical experiments (1000 trials) give IAXll = 4.79. Thus the stochastic norm estimate is not very conservative, and furthermore it is likely to be improved,by exploring other choices for S, and S,. In Fig. 3 we show a histogram of eigenvalue changes in our experiment. Note that while we need statistics for the changes in A to calculate the stochastic norm, we do not have to perform numerically expensive eigen analysis for each such deviation in order to estimate the eigenvalue changes. This can be contrasted with the formidable interval matrix stability problem which is well known in the robust control literature [i']. To conclude, if M m r a m of mal *I*
vahrds in 1M)O sinuQdons
n
"t
70
i 20
Table 3: Parameter Variations of the Induction Machine-?dodel 1 Param. 1 E[.] } U(.) 1 Limits
1
.so
10
2!
-7.0
.15
Figure 3: Real eigenvalue changes caused by parametric variations
I
, 0.63
1
0.04
I
0.53-0.73
X,, = Xi,. From numerical cxperiments we obtain the sampled standard deviations for entries of AA as r(A.4) =
[
0 0.12 0.37 2.67 5.04 0.92 1-00 0.92 5-04
3
(28)
sight.
It is shown in [6] that if we denote the columns of AA with a i , then their covariance equals Cov(ak, a!) = (ST S r ) ~ (S,,'~Se)
(29)
where ( . ) i , i denotes the k,l-th entry of the matrix. Next, let us assume for simplicity that columns of AA are uncorrelated (this could be justified for example by the large number of factors influencing AA). Thus we can pick s, = I (30) and to make sure that we match the largest entries in each row and column of u(AA) (note the entries (1,3),(2,2) and (3,3)) we choose S,
= diag(O.4, 5.1, 5.1)
there are numerous sources of uncertainty in the liner model, then the stochastic norm approach could be an efficient way to obtain a useful, non-conservative bound. This seems to be the case in actual operation of many induction machines, in particular in the wind-farm example. One case-dependent modeling task is to design matrices the S, and S, to capture the size of expected deviations, and it has to be based on both numerical experiments and OR engineering in-
(31)
6
Conclusions
In this paper we describe probabilistic aggregate models for a cluster of identical induction machines. We assume that a probabilistic description of the o p erating conditions is available, and we proceed to derive a probabilistic aggregate model that captures the effects introduced by uncertain mechanical loads. We also propose and compare four simple, numerically tractable procedures for calculating an aggregate linear model in terms of associated matrices and a given probabilistic description. Using this approach we avoid the need for costly simulations and numerical optimization, and our results could suffice for
1989
practical needs. The aggregation results are verified with time-domain simulations and in the frequencydomain. We also extend these linear results to the nonlinear model, resulting in a slightly modified version of a nonlinear single-machine model. This modification involves the addition of the constant Kpdf that depends upon the statistical properties of the torque. In the end, we propose an analytical extension of the aggregation process that allows multiple simultaneous parametric variations.
References F. Nozari, M.D. Kankam, W.W. Price, “Aggregation of induction motors for transient stability load modeling,” I E E E Transactions on Power Systems, Vol. 2, No. 4, pp. 1096-1102, November 1987. M.M. Abdel Hakim, G.J. Berg, “Dynamic Single Unit Representation of Induction Motor Groups,” IEEE Trans. on PAS, Vol. PAS-95, pp. 155-165,
1976. D.C. Franklin, A. Morelato, “Improving Dynamic Aggregation of Induction Motor Models,” Paper 94 W M 167-7 PWRS presented at the 1994 IEEE PES Winter Meeting, New York, January 1994. 11. Taleb, A. Akbaba, E.A. Abdullah, “Aggregation of Induction Machines for Power System Dynamic Studies ,” Paper 94 WM 165-1 PWRS presented at the 1994 I E E E PES Winter Meeting, Sew York, January 1994.
\.C‘.J. Rugh., Linear System Theory, Prentice Hall, 1993. G.W. Stewart, “Stochastic Perturbation Theory”, SIAM Review, Vol. 32, No. 4,December 1990, pp. 579-610. B.R. Barmish, New Tools for Robustness of Linear Systems, Macmillan, 1994.
R. Chedid, 3.LaWhite, M. Ilk, “Aggregation and Dynamics of Grid Connected Wind Turbine Generators”, Submitted to I E E E Trans. on Education B.C. Lesieutre, A.M. Stankovic, “Aggregate Induction Machine Modeling Using Probabilistic Techniques”, Proc. of the 26-th North American Power Symposium, Manhattan, KS, pp. 595-604. Aleksandar M. StankouiC (S187,M’93) received his Dipl. Ing. and M.S. degrees from the University of Belgrade, Yugoslavia in 1982 and 1986, respectively, and his Ph.D. degree from the Massachusetts Institute of Technology, Cambridge, MA, in 1993, all in electrical engineering. He is currently an Assistant
Professor of Electrical Engineering a t Northeastern University, Boston, MA. His research interests include modeling and control of power systems, electromechanical and power electronic systems. Bernard C. Leszeutre (S’86,&1’93)received his B.S., M.S. and Ph.D. degrees in electrical engineering from the University of Illinois a t Urbana-Champaign in 1986, 1988 and 1993, respectively. He is presently an Assistant Professor of Electrical Engineering a t the Massachusetts Institute of Technology. His research interests include machine modeling and power system dynamics, stability and control. He is a member of Eta Kappa Nu.