or lobular architecture of the organ. Independent quantifiable parameters were correlated and com- pared between the simulation and chimaeric liver tissue.
Development 99, 187-196 (1987) Printed in Great Britain © The Company of Biologists Limited 1987
187
A probabilistic model of mosaicism based on the histological analysis of chimaeric rat liver
P. M. IANNACCONE*, W. C. WEINBERG and L. BERKWITS Department of Pathology and Northwestern University Cancer Center, Northwestern University Medical School, 303 E.Chicago Ave., Chicago, IL 60611, USA
' To whom correspondence should be addressed
Summary The analysis of pattern development in mosaic and chimaeric animals has provided insight into a number of developmental problems. In order to aid the understanding of the dynamics of the development of mosaic tissues, a computer simulation of the generation of a mosaic tissue was created using simple probabilistic decisions. Results of quantitative analysis of the simulated mosaicism were compared with chimaeric liver. Chimaeric animals were produced by morula aggregation between histologically distinguishable strains of congenic rats. The livers of these animals revealed a pattern of patchy mosaicism unrelated to either acinar or lobular architecture of the organ. Independent quantifiable parameters were correlated and compared between the simulation and chimaeric liver tissue. This analysis showed that extensive cell migration is not required to develop finely variegated
mosaic tissue and that the patterns of mosaicism observed could have resulted from tissue development in which as few as three reiterated decisions were required. First, the simulation established anlagen of two cell types of various specified proportions with randomly chosen placement. Second, in each generation of the simulation the order in which the cells divided was established randomly. Third, there was a random choice of the direction of placement of the daughter cell. The quantitative relationships between the proportion of cell types, the area of patches and the number of patches per unit area was consistent between the simulation and the chimaeric tissue.
Introduction
to support theories concerning the generation of such tissues (West, 1975, 1976; Whitten, 1978; Hutchison, 1973). Previous models of mosaicism have mainly examined the relationship between the proportion of cell types present in the mosaic tissue and clone size as well as distribution of the cell lineages present in the mosaic tissue. None of the models described to date deal with the generation of the mosaic tissue. Investigation of the degree of tissue variegation in the liver has led to conflicting conclusions concerning the degree of clonal expansion of primordial elements in the liver. Studies based on the observation of variation in proportion of isoenzyme activity in large numbers of small samples indicated that the liver had large contiguous areas of similar lineage, and thus little cell migration had occurred in the development of the organ (Wegmann, 1970). When this tissue was reexamined with histological markers of mosaicism,
Chimaeric animals, produced by the amalgamation of zygotes with subsequent development in surrogate mothers, have been used to establish the patch size and coherent clone size of solid viscera in order to deduce mechanisms of organogenesis (Iannaccone, 1980; West, 1975, 1976; Hutchison, 1973; Lewis, 1973). This approach has been limited by the lack of histological markers that are capable of distinguishing closely related strains of inbred animals. Such markers are necessary for the analysis of organ development in chimaeras whose embryonic cellular assortment is not influenced by disparate genotype combinations. Another limitation has been the lack of suitable quantitative methodologies that facilitate such analysis. Where appropriate methodologies were available, models of mosaicism were developed
Key words: rat liver, chimaera, pattern formation, mosaic tissues, computer simulation.
188
P. M. lannaccone, W. C. Weinberg and L. Berkwits
/J-glucuronidase or omithine carbamoyltransferase, it was apparent that there was far less clonal expansion than previously expected (West, 1976; Wareham, Howell, Williams & Williams, 1983). These studies led to the conclusion that a high degree of variegation meant that active cell migration occurred late into development and resulted in relatively little coherent clonal expansion. For this report mosaic liver tissue was analysed in chimaeric rats made between congenic strains in which the mosaicism could be demonstrated histologically using a system in which the lineage of cells comprising most visceral organs could be established (Weinberg, Howard & lannaccone, 1985b). Patterns of mosaicism were discerned and analysed quantitatively utilizing monoclonal antibodies against class I antigens which vary between the strains used to construct the chimaeras. We describe a computer simulation of the generation of mosaic tissue in order to test several assumptions concerning the formation of mosaic liver. The simulation was programmed to begin with an anlage of a specified proportion of two cell types randomly distributed. In each generation all cells divide in a random order and the daughter cells occupy an adjacent position chosen randomly. The comparison of the computer simulation with chimaeric tissue revealed that extensive cell migration is not required for fine variegation of mosaic tissue and that such tissue patterns can arise as the result of a few, highly reiterated, simple decisions.
Materials and methods Chimaera production Chimaeras were produced by the amalgamation of embryos of PVG strain congenic rats. The rats were maintained by sib mating in a facility with constant temperature and humidity. The light cycle was reversed to facilitate the timed removal of embryos. Mating was determined to have occurred by observing sperm in the vaginal smear; the day of discovery was considered day 0 of the pregnancy. Oviducts of pregnant females of the appropriate strains of animals were flushed on day 3 of pregnancy with a phosphate-buffered medium (Papaioannou & West, 1981) using a 30-gauge stainless steel needle. Zonae pellucidae were removed by brief treatment with acid tyrode containing polyvinylpyrolidine (Nicolson, Yanagimachi & Yanagimachi, 1975). Zona-free morulae were apposed in microdrops of Bigger's media supplemented with vitamins as previously described (Yamamura & Markert, 1981). The amalgamated embryos were held for several hours in a 5 % CO2 atmosphere at 37 °C. The morulae pairs were then moved to a CO 2 incubator and cultured overnight. The following afternoon the pairs that had successfully mixed were transferred to the uteri of pseudopregnant Holtzman rats. The surrogates were used on day 3 of pseudopregnancy following mating with vasectomized male Holtzman
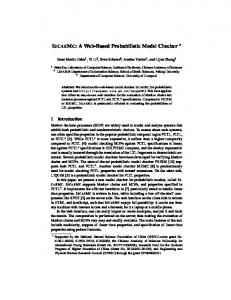
rats. Mating was determined to have occurred by discovery of a copulatory plug (day 0 of pseudopregnancy). Genotype marker The congenic PVG rats vary in the expression of class I antigens that can be recognized by a variety of monoclonal antibodies directed to these RT1 differences. The strains used in this study have been designated PVG-RT1* and PVG. The antibodies were obtained from Dr J. C. Howard (Cambridge, UK). The use of these antibodies to distinguish the tissues of the congenic strains has been described previously (Weinberg, Deamant & lannaccone, 1985a). Briefly, the monoclonal antibodies were iodinated by 30 s nondestructive treatment with chloramine T. The iodinated monoclonal antibody was applied to fresh cryostat sections of tissue which had been incubated with PBS containing 10% fetal calf serum and 10% nonimmune PVG-«77U serum for 30min at 4°C. The tissue sections were then incubated with iodinated monoclonal antibody for 1 h at 4°C. The sections were rinsed in PBS containing 10 % FCS, washed extensively in cold PBS,fixedand dried. • Autoradiography The labelled sections were coated with NTB-2 photographic emulsion (Kodak, Rochester, NY) at 42CC. The slides were dried in the dark with ambient conditions for 2-3 h, then stored in the dark at 4CC for 3-5 days. At the end of this exposure time the slides were developed in D-19 developer (Kodak, Rochester, NY) diluted 1:1 (v/v) with water, rinsed in dilute acetic acid and fixed with Kodak fixative. Photography The autoradiograms were photographed with a Leitz epivert microscope using Kodak EPY-50 emulsion. Computer simulation of mosaic tissue growth The tissue was modelled with a two-dimensional tablet of numbers containing 76 vertical positions and 76 horizontal positions. Each element of this matrix represented a cell within the tissue. The elements assumed one of three values. Zero denoted unoccupied elements. A value of one denoted the presence of a cell of type 1, while a value of two denoted a cell of type 2. The 100-cell 'anlage' consisted of cells of types 1 and 2 in a proportion that was approximately specified. The precise proportion of the cell types varied slightly by chance. The distribution of type 1 and type 2 cells was random. Division of cells in the matrix was accomplished by choosing the direction in which the 'daughter cell' moves following division, then selecting which cell divides. Cells may divide in eight possible directions with respect to the parent cell. If the direction of the neighbouring element directly above the parent cell was called 0°, then a cell may divide in the following directions: 0°, 45°, 90°, 135°, 180°, 225°, 270° and 315° (Fig. 1). All cells within the matrix were assigned a direction of division in a random fashion. This direction was stored in the same element of the matrix that contained the cell type. Each element was then selected at random. The cell was divided in the division direction
Mosaic pattern analysis of liver 4
A
A A
3
B
y=2 1
A
B
A
A
B
B
A
A
x == 0
1
2
3
4
4
A
A
3
B
A
0
B
y=2
1
A
B A
B
0
1
0
-
A B
A
A
Fig. 1. Division of parent cell at x = 2, y = 2 in the 45° direction. Daughter cell is produced at x = 3, y = 3. previously chosen. When cells have divided, the neighbouring cells must be shuffled in the direction of division to accommodate the newly formed daughter cell. If a nonoccupied element was present in the direction of division, the cells were shuffled up to the nonoccupied element. In this manner, the 'tissue' expanded to fill the vacant space within the matrix. When all of the elements had divided, one 'generation' was completed (Fig. 2). The simulation was performed at specified starting proportions (pr) of type 1 cells of 0-5, 0-6,0-7, 0-8 and 0-9. The simulation completed three independent runs of ten generations each. The actual proportions varied with each run and the average proportions tested were 0-537 (±0-002), 0-650 (±0-023), 0-706 (±0-019), 0-793 (0-030) and 0-92 (±0-007). Quantitative determinations were made for each run at each specified proportion and at each generation. The determinations were made as described below and included the number of patches per unit area (number of patches in the total area of the matrix with occupied elements at a given generation) of simulated tissue, the average area (number of contiguous occupied elements of a
189
given type) of the patch, and the actual proportion of the two 'cell' types in the simulated tissue. A second simulation of three independent runs with specified proportions of type 1 cells of 0-1, 0-2, 0-3, 0-4, 0-5 was performed to demonstrate that the results of the simulation were not biased by which proportions were chosen to start the simulation. The actual proportions run were type 1 cells = 0-10 (±0-01), 0-17 (±0-003), 0-31 (±0-014), 0-38 (±0-015), and 0-49 (±0-03). Analysis of the regions of contiguously similar cell type (patches) employed the image-processing techniques of feature extraction and region labelling. The features of type 1 and type 2 tissues were extracted from the matrix and a component labelling algorithm (modified from Rosenfeld & Kak, 1976) was applied to the extracted features. Once the labelling was completed, the number of regions and the area of each labelled region in the tissue were determined. A mean and standard error of these areas were computed. Regions that included elements along the border of the matrix were not included in the computation of mean and standard error of areas. Border regions were included in the determination of number of regions. Growth of mosaic tissue was simulated on an NEC-APC 16-bit microcomputer (8086) with 128 K of memory. The simulation software was written in the C language and compiled with the Aztec C compiler. The application ran under the CP/M-86 operating system.
Digital quantification The photomicrographs were projected onto a digitizing tablet (Summagraphics MM1200) through a first surface mirror. The patches were then traced with the tablet cursor and percent parental genotype, number of patches/unit area and average patch area were computed using a microcomputer and a program previously described in detail (Berkwits & Iannaccone, 1985). The smallest patch digitized by this method was 80 jon2 in area representing a single hepatocyte. Patches consisting of 2-10 hepatocytes were easily digitized by this method.
• i i • « • i • i > i • i J • • • * t
• •
•
• •
•
• • i
•
-. ,
i •
:i •
A
.
,
:
:
B
C
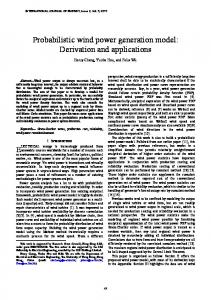
Fig. 2. Representation of the computer-generated mosaic tissue. A represents the starting 'anlage' at generation 0. The proportion of the two 'cell' types, # and - , was selected as described in 'Materials and methods'. B represents generation 2 and C represents generation 4 produced by the stimulation as described in 'Materials and methods'.
190
P. M. Iannaccone, W. C. Weinberg and L. Berkwits
Statistical evaluation All of the relationships presented in this report were established statistically using Pearson's moment-product correlation test to establish a coefficient of correlation (r). The significance of the linear association is presented as the probability that the association occurred by chance alone (P). This probability was established using a f-test of the coefficient of correlation for degrees of freedom less than 30
(Bruning & Kintz, 1968). The standard errors of the means are presented. Results
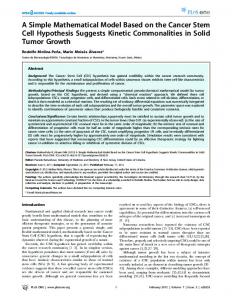
Liver tissue from the two parental strains of rat demonstrated uniform presence or absence of grain accumulation in the autoradiograms appropriate to the genotype under consideration (Weinberg etal. 1985a). Sections of liver from all of the chimaeric animals, however, demonstrated patchy mosaicism as shown in Fig. 3. Fig. 3 also demonstrates a typical digitized section of the chimaeric livers. These plots represent the reconstruction of digitized data and were used in all cases to check the accuracy of the digitization of sections. The patches (contiguous regions of the same lineage) were randomly placed in the tissue with no apparent relationships to the distribution of liver structures. There was no evidence of zonal distribution of mosaicism in any of the animals. The comparison of sections demonstrating patch distribution with serial haematoxylin- and eosin-stained sections (Fig. 4) failed to demonstrate an association between patches and either the lobular architecture or the acinar architecture of the liver. The randomness of the patch in the liver with reference to the microscopic or functional anatomy of the organ led to the supposition that the organogenesis of the liver requires relatively simple decisions. This hypothesis was tested by creating a computer simulation of the formation of a mosaic tissue in two dimensions by reiterating simple decisions (randomly distributing cells in an anlage, randomly choosing the order of division during each generation and randomly choosing the adjacent position of the daughter). The simulated tissue was analysed at each generation. The number of patches per unit area was determined to be nearly equal at equal proportions of the two cell types, pr = 0-53, in all generations. The number of patches of the minor cell type, however, increased rapidly as a function of generation number at pr>0-65 (Fig. 5). This relationship reflects the formation of a lattice of the major cell type at relatively low proportions. By pr>0-79 there is a Fig. 3. (A) Unstained autoradiogram of section 11 of the liver of animal 0906. The image was digitized as described in 'Materials and methods' for quantitative analysis and the digitized section, as seen by the computer, is shown in B. This section represents an animal with a larger proportion of PVG-R77" derived cells, thus patches of PVG were traced. (C) An unstained autoradiogram of section 18 from the liver of animal 0912. (D) The digitized data from this section in which patches of the PVG-RT1* type were analysed. The photomicrographs .(A,C) are x45; in the digitized sections (B,D) bar, 0-25 mm.
Mosaic pattern analysis of liver
191
6O-1
150g 125o S1 100S E
pr(type l ) = 0-65
75 " 50-^
180» 150o
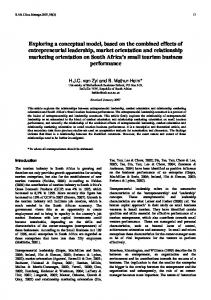
Fig. 4. Computer-generated plots of digital data from liver sections of animal 0911. (A) Data from an unstained autoradiogram of liver section 1, showing the distribution of patches of PVG-R778 lineage. Since the proportion of cells of this lineage was less than 0-7 (pr = 0-66) it was possible in this instance to trace the PVG-RT1* patches. (B) A serial frozen section was stained with haematoxylin and eosin (H&E) and pin registered to the autoradiogram (i.e. the sections were aligned using independent registration marks in the tissue of each section to ensure that there was no bias in their reconstruction). Several liver lobules are outlined ( ). The liver lobule is roughly hexagonal in cut section and is defined by portal triad spaces (ps) and with a central vein (cv) in the middle of the lobule. Liver cell plates (not shown) radiate toward the cv. The liver acinus, on the other hand, is arranged around a circulatory tree defined by the terminal hepatic arteriole. An example of a liver acinus is outlined (...). Zl, Z2, and 73 refer to zones of progressively poorer quality arterial blood supply. A sublobular vein (slv) is present. The liver lobule and the liver acinus represent the two predominant current views of anatomic organization in the liver. There is no apparent relationship between the distribution of patches and either lobular or acinar architecture in any of the sections examined. Bar, 0-25 mm.
pr(type l) = 0-79
'g> 120° 90|
60^
1
30H i 1
i 2
i 3
r 4
i 5
125-
.1'5b
10
0
I 1
I I 2 3 Generation number
I 4
I 5
Fig. 5. The relationship between the number of regions in computer-simulated mosaic tissue and the generation number of the tissue. This relationship is presented for four preparations (pr) of type 1 cells in the initial 'anlage' as described in 'Materials and methods'. The solid lines represent type 1 regions and the dashed lines represent type 2 regions. As described in 'Results' the number of regions of the major type (type 1) approaches 1 (a lattice) at proportions in excess of 0-7.
192 210-1
0-5
P. M. Iannaccone, W. C. Weinberg and L. Berkwits Generation 5
0-8 Proportion of major cell type
0-9
Fig. 6. The correlation between the number of regions (patches) per unit area (A) and the area (in arbitrary units) of regions (B) in the computer-simulated mosaic tissue and the proportion of type 1 cells (major type) in the 'tissue' at generation 5. Since the computer uses algorithms that can analyse the background lattice as well as the minor 'cell' type, this correlation is presented for both 'cell' types as a function of type 1 proportion. The dashed line represents type 2 (minor type) regions and the solid line represents type 1 (major type) regions. As described in 'Results', the number of type 2 regions (minor type) increases rapidly as the probability of the type 1 cells (major type) increases up to a proportion of approximately 0-8. Standard errors of the means (S.E.M.) are presented as vertical bars unless the S.E.M. bar is smaller than the symbol representing the mean.
background lattice in the first generations and only after three generations does the number of patches begin to rise as this lattice is fragmented. By pr > 0-92 the number of major cell type patches was essentially invariant with generation. The number of patches/ unit area was examined as a function of the proportion of the major cell type at generation five. Five generations were sufficient to bring the developing 'tissue' to the limit of the image analysable matrix. The relation between pr and the number of regions (patches) per unit area is shown in Fig. 6. The number of type 1 regions between pr values of 0-5 and 0-9 decreases with a shallow negative slope. The two parameters fit a linear model with a correlation
coefficient of -0-97 ( P < 0-001). As in chimaeric liver tissue (below), the number of patches of the minor type per unit area increased as a linear function of pr (r = 0-98; P