The 23rd International Technical Conference on Circuits/Systems, Computers and Communications (ITC-CSCC 2008)
A Probabilistic Short-length Linear Predictability Approach to Blind Source Separation Mahdi Khosravy , Mohammad Reza Alsharif and Katsumi Yamashita Department of Information Engineering, Faculty of Engineering, University of the Ryukyus, 1 Senbaru, Nishihara, Okinawa 903-0213, Japan Tel: +81-98-895-8681 Fax: +81-98-895-8727 Graduate School of Engineering, Osaka Prefecture University, 1-1 Gakuen-cho, Sakai, Osaka, Japan E-mail :
[email protected],
[email protected],
[email protected] Abstract: A merit function based on short length linear predictability of signal in an objective probabilistic algorithm is defined and used for blind source separation (BSS) of linear mixtures of signals. In BSS literatures, it has been conjectured that linear mixture of statistically independent source signals will result in a set of signals which each of them has less predictability than (or equal to) that of any of component source signals. We have used this property to extract source signals by finding an un-mixing matrix that maximizes the proposed merit function of predictability for each recovered signal. This method which is called Probabilistic Short-length Linear Predictability BSS (PSLP-BSS), its performance has been driven with many tests performed with mixtures of different kinds (speech, audio, image, constructed mathematical signals like saw tooth and sinusoidal). In all cases, correlation between each of source signals and each of extracted signals shows near-perfect performance of the method. The proposed BSS doesnt require any assumption regarding the probability density function of source signals. It has been demonstrated that PSLP-BSS can separate signal mixtures in which each mixture is a linear combination of source signals with gaussian, super-gaussian and sub-gaussian probability density functions. However, the method is adapted to temporal structure of recovered signals. Since, the un-mixing matrix that is concluded by proposed merit function can be obtained as the solution to a generalized eigenvalue routine, signals can be extracted simultaneously using the fast eigen value. Key words: blind signal separation, predictability, gradient ascent, eigen value
1. Introduction The separation of blind sources from mixed observed data is a fundamental signal processing problem that is known as Blind Source Separation (BSS). Typically, the observations are obtained at the output of a set of sensors. Each sensor receives a different combination of the source signals. Blind means that, the source signals are not observed and also no information is available about the mixture. Solution to BSS is based on realistic assumption as its basic principle that different physical mixing processes generate signals with properties different from source signals. The increment or decrement of such measurable property is the main key difference between observation and source signals. Usually BSS methods are based on a cost(merit) function of signals which measures the desired property of signals, and they look for a separation matrix
381
which maximizes the cost function, or minimize it. The minimization or maximization depends on the desired property for signals as well as merit function defined to measure the property. This paper defines a probabilistic short-length predictability (PSLP) measurement of signal as a merit function for separation of blind sources. In BSS literatures among other principles for extraction of source signals, predictability[1] as well as complexity[2] have received much less attention than others like independence[3], non-gaussianity[4], Infomax [5]. Complexity pursuit suggest that any observed mixture of source signals is always more complex than each of source signals. And source signals which each of them has generated by a different physical source are simpler than mixture signals. Based on this conjecture, complexity pursuit seeks minimally complex source signals as key principle of separation. While complexity pursuit methods is derived directly from information-theoretic[6], such methods tend to be more general and more complicated than is required for many BSS problems. In contrast, temporal predictability[1] minimizes a very simple measure of complexity. Here, based on probability theory, we present a simple and fast short length measure of predictability. The proposed function, by using the most and least probable combinations as prediction values in measurement of predictability, performs near perfect efficiency in BSS. The performance of new method has been evaluated with many tests performed over mixtures of different kinds (speech, audio, image, constructed mathematical signals like saw tooth and sinusoidal). Appropriate probabilistic choice of expectation weights in prediction, has brought us the advantage of fast measurement of predictability by means of a short averaging window. Furthermore, since the un-mixing matrix that is concluded by proposed merit function can be obtained as the solution to a generalized eigenvalue routine, source signals can be extracted simultaneously using the fast eigen value routine. So by using the proposed method higher performance speed will obtain at two points: first in short length proposed method of predictability measurement , and second in capability the of method for extension to fast eigenvalue problem. Almost all BSS algorithms sometimes in optimizing the appropriate weights for maximization or minimization of merit function have the problem of being caught in a local minimum or maximum. But since the proposed merit function is composed of quadratic forms, like the classic pre-
dictability merit function it has exactly one global maximum, and the proposed BSS doesn‘t suffer from such problem. Finally as another advantage, the method is adapted to temporal structure of recovered signals. The structure of the paper is as follows: section 2 explains general formulation of a BSS problem. section 3 presents the proposed measurement of predictability and BSS based on proposed method is explained in section 4. section 5 discusses the performance of the proposed BSS in separation of signal and image mixtures of different kinds sources. Finally section 6 concludes the paper.
2. BSS Problem Formulation Here we face the general form of BSS problem. unknown source signals upon transmission through a medium has been linearly mixed together and mixture signals are collected from sensors. We don’t know any thing about source signals and also mixing process. So, in matrix notation the vector ), is multiplication of X of observed signals ( vector S of unknown source signals ( ), by Unknown mixing matrix A: X
A
S
Given only the observation signals X, the solution of BSS problem, seeks for the best matrix as un-mixing matrix to obtain extracted signals as much as possible close to unknown source signals as follows Y
W
X
vector of extracted signals ( ). Each where Y is un-mixing vector related to each row of W is the extracted signal .
Here we want to estimate the least probable expectation , with the same preceding samples values as used for , but different probability weights. Therefore, we consider the finite length of expectation window as a precondition to our probabilistic estimation. And we choose each sample weight proportional to its probability of not being equal to the current sample value. By such choice of weights the expectation value, as a prediction would be the weighted average with the most probable difference from the current sample. Therefore by using the short term window, the least probable expectation as a prediction of current sample value is estimated as follows: (2)
where is weighted probability of false prediction for preceding sample and is normalization factor of weights. Based on above concept of the most and the least probable prediction values, here we interpret short length predictability of signal. It means that signal has a property that by applying the probability weights of the most probable expectation, mean square error of prediction will have its minimum value and by applying the probability weights of the least probable expectation, mean square error will have its maximum value. The probabilistic short length predictability function for a msampled signal is defined as: (3)
3. Probabilistic Measurement of Predictability The merit function that we have defined for blind source separation is based on linear prediction model[7]. it measures predictability of recovered signals s based on a finite length of prior sample values. It performs by using two short length linear combination of past samples as prediction values, which both are probabilistic expectations; the most probable expecand the least probable expectation . tation ,we choose each sample weight proporFor obtaining of being equal to current sample. tional to its probability The most probability weight belongs to the closest sample ,and by going farther from through samples, their probability weights in prediction should be decreased. Experimentally we have observed that exponentially decrement leads to a better result. The most probable expectation as a prediction of current sample value can be estimated by the following short term weighted average: (1)
where is weighted probability of true prediction for prior sample ( ) and is normalization factor of weights.
382
and are respectively mean square errors for the Where least probable expectation and the most probable expectation with the same short length expectation window.
4. PSLP-BSS Consider an extracted signal formed by multiplication of component vector by the set of corresponding observed signals mixtures X. Given that X , equation (3) can be rewritten as (4) is a covariance matrix of the error sigwhere nals of the least probable expectation of signal mixtures and is a covariance matrix of the error signals of the most probable expectation as prediction signal. The covariance matrix of error of the most probable and the least proband m-sampled mixtures able expectations between are as follows (5)
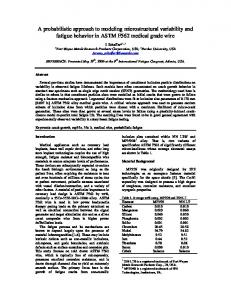
Music Signal sources
(6) and are the least and the most probable expectawhere tion signals of signal mixture. For a given set of signal mixand need to be computed only once. The derivatures tive term of , (for gradient ascent learning) is as follows
Mixture Signals
(7) Since the function is a ratio of quadratic forms, for gradient ascent the local minimum or maximum is not an issue of problem.
Extracted Signals
4. 1 Extension to generalized eigen problem Since, the solution of BSS problem will be the point that the gradient of F is zero, from equation (7), it can be obtained,
Correlation = 1
Correlation = 1 Correlation = 1
(8) Where is identity matrix. It can be easily seen that the equa. This is the form of tion (8) has the form of a generalized eigenvalue problem. So BSS solutions for can be obtained as eigen vectors of matrix with corresponding eigen values . Therefore by solving the generalized eigenvalue routine and obtaining W that contains , all source signals all un-mixing vectors can be simultaneously extracted. The form of equation (8) is cause of form of the merit function whose derivative leads to eigenvalue equation. Indeed it makes separation of blind sources so fast by the bless of fast solution of eigenvalue problem.
5. Results and Discussion The PSLP-BSS performance has been driven with many tests performed with mixtures of different kinds, such as speech signals, audio signals, gray-scale images and constructed mathematical signals like saw tooth and sinusoidal. In our simulation the length of prediction window for both of the most and the least probable expectations, is only 8 samples, and probability of equality of current oncoming signal samprior sample value is . Alple value and its though values taken for the length of prediction window and are not the most optimum, in all cases, correlation between each of source signals and each of extracted signals shows near perfect performance of the method. Furthermore, it has been demonstrated that PSLP-BSS can separate signal mixtures in which each mixture is a linear combination of source signals with gaussian, super-gaussian and sub-gaussian probability density functions. Fig.1 shows three audio source signals, three linear mixture of them and extracted signals by PSLP-BSS. The permutation matrix (multiplication matrix of the mixing and separator matrices as a quantitative measure of separation) in this example test is as follows (normalized form);
383
Figure 1. Audio source signals (top), their linear mixture signals (middle) and separated audio signals (bottom). Table 1. Correlation between audio source signals (S1, S2 & S3) and extracted signals related to fig.1. Source 1 Source 2 Source 3 Extracted 1 0.0011 1.0000 0.0024 Extracted 2 1.0000 0.0009 0.0068 Extracted 3 0.0065 0.0000 1.0000
For matrix, the closer underlined elements to one, and the closer other elements to zero indicate the more successful separation. besides the permutation matrix, table.1 shows the correlation between audio source signals and extracted signals related to fig.1. As it can be seen, the PSLP-BSS performance for separation audio mixtures is almost perfect. We have applied the proposed BSS for separation of mixtures of gray-scale images too. It separates blind image sources as well as blind signal sources with a high performance. Fig.2 shows the PSLP-BSS performance in separation linear mixtures of gray-scale images. Table.2 approves its near perfect performance by correlation between source and extracted images. We also applied PSLP-BSS over mixture signals made of source signals with different probability distribution functions. Fig.3 shows one of experiments related to sources with different PDFs. In this figure sources are an audio signal, a sine wave and a white noise signal whose PDFs are respectively super-gaussian, sub-gaussian and gaussian. Table.3 convey the high performance of BSLP-BSS in separation of these sources and it approves its independence of any assumption regarding the probability density functions of sources.
2000
2000
1500
1500
1000
1000
500
500
600 500 400 300 200 100
0 −0.5
Figure 2. Source images (top), their linear mixture images (middle) & separated images by PLSP-BSS (bottom)
Table 2. Correlation between source Images (S1, S2 & S3) and extracted images related to fig.2. Source 1 Source 2 Source 3 Extracted 1 0.9914 0.0416 0.0171 Extracted 2 0.0190 0.0974 0.9994 Extracted 3 0.1304 0.9943 0.0298
6. Conclusion A merit function based on short length linear predictability of signal in an objective probabilistic algorithm is defined and used for blind source separation of linear mixtures of signals as well as images. Its high performance over a lot of signals and images of different kinds has been approved. Since, the method has been extended to generalized eigenvalue problem, fast and simultaneous separation of sources has become possible. In the other hand, because of appropriate probabilistic choice of expectation weights in prediction, it can use a short length window in predictability measurement, and it is faster than predictability measurement suggested in [1]. So proposed method obtains higher performance speed at two points: first by capability of using short length window for predictability measurement , second by the means of extension of the proposed method to fast eigenvalue routine. BSS based on proposed merit function can extract signals with different PDFs from the mixture and it doesn’t require any assumption for PDF of source signals. However, the most optimum weights and length of short-length prediction window are issues of our future work.
384
0
0.5
0 −1
0
1
0 −1
0
1
Figure 3. Three source signals with different PDFs(top) and their PDFs: resp. super gaussian, sub-gaussian & gaussian (second row), their linear mixture signals (third row) and extracted signals by PSLPBSS(bottom) . Table 3. Correlation between source signals with different PDFs (S1, S2 & S3) and extracted signals from their linear mixture. Source 1 Source 2 Source 3 super gaussian sub-gaussian gaussian Extracted 1 0.0014 0.0016 0.9999 Extracted 2 1.0000 0.0006 0.0083 Extracted 3 0.0006 1.0000 0.0146
References [1] JV. Stone, Blind source separation using temporal predictability, Neural computation, 13(7), pp. 1559 1574, 2001. [2] A. Hyvarinen, Complexity pursuit: Combining nongaussinity and autocorrelations of signal separation, ICA2000, Helsinki, Finland, pp. 175 180, 2000. [3] C. Jutten, & J. Herault, Independent component analysis versus PCA, In Proc. EUSIPCO, pp. 643 646, 1988. [4] J. Friedman, Exploratory projection pursuit, Journal of the American Statistical Association, 82(397), 249 266, 1987. [5] AJ. Bell, & TJ. Sejnowski, An information-maximization approach to blind separation and blind deconvolution, Neural computation,vol. 7, 1129 1159, 1995. [6] A. Hyvarinen, Complexity pursuit: Separating interesting components from time series. Neural computation, 13, 883898, 2001. [7] SV. Vaseghi, Linear Prediction Models, chapter. 8 of Advanced digital signal processing and noise reduction, John Wiley & Sons,Ltd ,Third edition, 2006.