A process-oriented approach to modeling the gravity signature of continental margins A. B. WATTS, Oxford University, U.K. J. D. FAIRHEAD, GETECH, University of Leeds, U.K.
258
THE LEADING EDGE
FEBRUARY 1999
differences. Sometimes, the differences are apparent along the length of the same age margin. At the east coast (U.S.) margin, for example, the high alternates between being sometimes larger in amplitude than the flanking low (profiles 2 and 3 on the right of Figure 1) and sometimes smaller (profiles 1 and 4). We have observed a similar pattern at other margins. Offshore West Africa the high is dominant along parts of the margin (e.g., Namibia) and more subdued along others (e.g., Gabon). Process-oriented gravity modeling. To better understand the cause of these edge-effect variations, an attempt has been made to compute the gravity anomaly that is associated with the different processes occurring at margins such as sedimentation and magmatic underplating. We therefore have adopted a Òprocess-orientedÓ rather than a ÒstaticÓ modeling approach to gravity
Free-airFree-air Gravity Anomaly "Edge Effect" Gravity Anomaly "Edge Effect" Worzel ( 1968) Worzel ( 1968)
100 mGal
100 0
Rifting 0
Rifting 1
1
-100
2
-100 0
gh
-10 2
-30 300
0
200
300
Sh
Gr 100
Edge effect low
elf
200
km
Fig
4
.4
Ap
pa
-400 -300 -200 -100
100
av
0 2
-30
ian
-20
lac h
-400 -300 -200 -100 1
ity
-10
slo pe
Crustal structure (Airy) 1 -20
0
Hi
40
Edge effect high
2
Crustal structure (Airy)
East Coast, USA
3 35
4
Shelf break
3
2 2
1
Gravity
Depth (m)
The edge-effect anomaly. One of the most distinctive geophysical features of rifted continental margins is the free-air gravity edge-effect anomaly. In its simplest form, the anomaly comprises a gravity ÒhighÓ which correlates with the outer shelf and a ÒlowÓ associated with slope and rise regions. At some margins (Figure 1), there is an additional low landward of the high or a high seaward of the low.
Traditionally, the edge effect has been interpreted as the result of the juxtaposition of thick continental crust and thin oceanic crust. The anomaly can be explained by a model in which the continent-ocean transition is localized to the region of the present-day shelf break. However, the edge effect is very sensitive to the location of the transitionÑchanging abruptly if it is displaced a few tens of km landward or seaward of the shelf break (left inset in Figure 1). Since the transition zone at rifted margins is the product of rifting, the edge effect has the potential to tell us about the styles, geometry, and dynamics of continental breakup. Recent compilations of terrestrial and satellite-derived gravity anomaly data have revealed complexities in the simple edge-effect anomaly pattern. While some margins display the ÒtypicalÓ edge-effect of a similar amplitude and wavelength landward high and a seaward low, others show
mGal
T
he gravity anomaly at a continental margin can be regarded as the result of all the processes that have shaped it through time. These include rifting, sedimentation, and magmatic underplating. This article discusses a new Òprocess-orientedÓ approach to gravity interpretation which uses seismic constraints on sediment thickness and the underplate at continental margins to estimate the gravity anomaly that is associated with rifting, sedimentation, and magmatic underplating. By comparing the calculations to the observed free-air gravity Òedge-effectÓ anomaly, we have been able to determine the elastic thickness and crustal structure, and to provide an estimate of the location of the ocean-continent transition. Since crustal structure is a proxy for the amount of heating that occurred at the time of rifting, the approach has important implications for the deep-water hydrocarbons industry. Rifted continental margins form as a result of the breakup of continents and the formation of new ocean basins. Some margins (e.g., the U.S. east coast; Labrador) correlate with up to 15 km in thickness of seaward-dipping sediments. Others (e.g., Goban Spur) have only a thin sedimentary cover. Many margins (e.g., Voring) are associated with abundant magmatism which is expressed in the form of high P-wave velocity lower crustal bodies and seaward-dipping reflector sequences. While differences in the thicknesses of sediments and the amount of magmatic material explain the diversity of rifted margins, they obscure our physical understanding of the rifting process.
1
0 -2000 -4000 -6000
Topography
100
200
300
400
Distance (km)
30 -85
-80
-75
-150 -70 -60 -50 -40 -30 -20 -10 0
-70
-65
10 20 30 40 50 300
Figure 1. The free-air gravity anomaly field of the east coast (U.S.) based on DNAG data. FEBRUARY 1999
THE LEADING EDGE
0000
anomaly interpretation. In static modeling, the density structure is determined that best explains the gravity anomaly. Such an approach has been useful in determining the physical properties of the crust and mantle in continental margin regions. However, it has told us little about the role that processes such as sedimentation and magmatic underplating, together with their loading effects, may play in the evolution of a margin. Sediment loading. Sediment loading can contribute significantly to the edge-effect anomaly. Figure 2 shows the case of a rifted margin which is subject to a wedge-shaped prograding sediment load. Prior to loading, the rifted margin has a typical edgeeffect high and low which reflect the transition from normal thickness continental crust across a region of rifted continental crust to oceanic crust. We term this the rifting anomaly. The wedge-shaped sediment load, however, is associated with a central high that is flanked by two lows. The high arises because sediments are denser than the water that they displace while the low is the result of the downward displacement of the relatively low-density crust into a denser mantle by the sediment load. ToSediment Loading 100
Rifting
0
mGal -100 0 km -10 -20 -30 100
Te = 35 km
Sedimentation
mGal 0 Te = 5 km
-100
Backstrip
0 -10 km
-20
Backstrip Moho
-30 100
Te = 35 km
Flexed Moho
Sum
mGal 0 -100
Te = 20 km
5 km
-400 -300 -200 -100 0 100 Distance (km)
200
300
Figure 2. The gravity anomaly associated with sediment loading and its influence on the anomaly due to rifting based on an assumed density of the water, crust, and mantle of 1030, 2400, and 3330 kg/m3, respectively, and elastic thickness values of 5, 20, and 35 km. 260
THE LEADING EDGE
FEBRUARY 1999
gether, these anomalies define the sedimentation anomaly. The sedimentation anomaly, as Figure 2 shows, depends strongly on the elastic thickness, Te, of the lithosphere which is a measure of its longterm (i.e., > 1 Ma) strength. Sediment loading of a strong margin (Te = 35 km), for example, produces a single large-amplitude gravity anomaly high which is flanked by low-amplitude, long-wavelength lows. In contrast, the same load, when deposited on a weak margin (Te = 5 km), results in two highsÑthe wider one being located over the original shelf break and the narrower one over the new one. The net result of sediment loading is to modify the rifting anomaly in such a way that the edge-effect high and flanking low migrate from the original shelf break to the new one (the migration being more obvious for the case of the strong margin than the weak one). Magmatic underplating. Magmatic underplating also modifies the rifting anomaly. Figure 3 shows that the gravity anomaly associated with magmatic underplating of the slope and rise region comprises two effects, a low due to the low-density underplated material and a high due to the displacement of water by the uplifted crust. The underplating anomaly depends strongly on lithospheric strength. At a weak margin (Te = 0 km), underplating reduces the amplitude of the edge-effect ÒhighÓ and the flanking ÒlowÓ and increases its wavelength. At a strong margin (Te = 20 km), however, the opposite effect occurs, with underplating increasing the amplitude of the high and low and decreasing its wavelength. Both models in Figures 2 and 3 are Òforward modelsÓ in the sense that the rifting geometry (i.e., the amount of initial crustal thinning), the sediment thickness and the configuration of the underplated region, and Te were all specified prior to calculating the gravity anomalies. The sediment and underplate are often imaged in seismic reflection and refraction data at rifted margins and so are ÒobservableÓ quantities. The rifting structure and Te, however, are unknown. What is of interest then is whether we can develop a method that uses observations of the sediment and underplate to deduce the rifting structure and, hence, Te in a rifted margin setting. One way to do this is to take a combined back-stripping and gravity
modeling approach. The first step is to use knowledge of the sediment and underplate from seismic data to calculate the depth that basement would have been in the absence of sediment loading and underplating. In the case of sediments, this can be carried out by progressively backstripping each stratigraphic layer, summing the contributions, and then adding them to the water that still remains (the unfilled part of the margin). The resulting curve should represent the sum of all the tectonic subsidence and uplift that has occurred at the margin. In the case of underplating, the uplift that is associated with a particular underplate can be subtracted from this sum. Both the sediment and underplate calculations require an assumption about Te. The second step is to calculate the depth to the Moho from the tectonic subsidence and uplift, assuming some form of isostatic model (the Òback-stripÓ Moho). This calculation yields the crustal and mantle structure associated with rifting. The final step is to calculate the gravity anomaly of rifting and add it to the anomaly due to sedimentation and underplating. By comparing observed and calculated anomalies, we can then constrain the Te structure at a rifted margin.
Underplating 100 50 mGal 0 -50 -100
Rifting
0
km
-10 -20
-30 50 mGal 0 -50 -100
Te = 0 km
Underplating
Te = 20 km
0
km
Te = 10 km Flexed Uplift Backstrip
-10 -20
-30 100 50 mGal 0 -50 -100 -150
Backstrip Moho Underplate
Sum
Te = 10 km
Te = 0 km
Te = 20 km
-300
-200
-100
0
100
200
Distance (km)
Figure 3. The gravity anomaly associated with magmatic underplating and its influence on the anomaly due to rifting based on a density of the underplated material of 2900 kg/m3 (other densities as in Figure 2) and elastic thickness values of 0, 10, and 20 km. FEBRUARY 1999
THE LEADING EDGE
0000
Hinge Zone
Shelf Break ECMA
Te = Z 450 o C
"Strong"
* Observed
Te = Variable
"Weak"
75
*
mGal
50
Te = Z
25
150 oC
0 -25 -50
COST B-2
-75
ESP 1
Coastal Plain
2 3
Shelf
0
4
5
Slope
Tertiary Cretaceous
Rise Tectonic Subsidence from Flexural Backstripping
L.Jurassi
c
M.Jura
ssic
km
E.Ju
Continental Crust
10
rass
ic
Oceanic Crust
20
Backstrip Moho based on Airy Isostasy Flexed Seismic Moho Moho
30
Weak
? ? Craton
40
-50
0
50
Strong
Te=Z 150oC Stretched Continental Crust 100
150
200
Te=Z 450oC Ocean
250
300
350
400
450
km
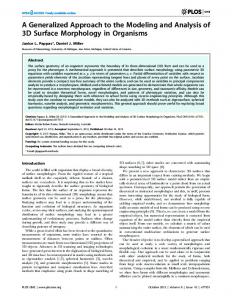
Figure 4. Combined back-stripping and gravity modeling of a seismically constrained profile of the Baltimore Canyon Trough (see Figure 1 for profile location). The black dots show the observed free-air anomaly based on shipboard measurements. The blue profiles show the calculated anomalies obtained by combining the rifting and sedimentation anomalies. Three cases of margin strength have been considered: one (upper profile) that corresponds to oceanic lithosphere; one (lower profile) that corresponds to rifted continental lithosphere; and a combination of both cases. 0000
THE LEADING EDGE
FEBRUARY 1999
Lithosphere flexure and the significance of Te. We know from flexure studies that significant differences exist between the T e structure of oceanic and continental lithosphere. In the oceans, Te is given approximately by the depth to the 450¡C isotherm based on cooling plate models. For example, Te increases from 4 to 12 km at the midoceanic ridge where the lithosphere is relatively young and hot to >30 km where it is old and cold. Studies in the continents, however, do not show such a simple relationship between Te and thermal age. Rather, there is a spread in the data such that Te may change by several tens of km over length scales that are as short as a few tens of km. In general, though, weak zones (low Te) seem to typify rifts while strong zones (high T e) appear to characterize cratonic shield regions. The results of flexure studies suggest that if we can determine the Te structure at a margin, then it might be possible to determine whether the sediment or underplate has been emplaced on oceanic or continentaltype crust. For example, if the observed edge-effect anomaly is best explained by a model in which the sediments-loaded lithosphere that was initially weak and then became stronger with time, then this would argue that the sediments were deposited on oceanic rather than continental crust. If, on the other hand, the anomaly is best explained by a model in which sediments-loaded weak lithosphere which remained weak following rifting, then this would favor rifted continental crust over oceanic crust. Modeling of the edge effect at the east coast (U.S.) margin. An example of the application of a combined back-stripping and gravity modeling approach to explain the edge-effect anomaly at the east U.S. coast margin is shown in Figure 4. We chose the Baltimore Canyon Trough region because a wealth of high-quality seismic and gravity-anomaly data exists from this part of the margin. The first step in the modeling was to progressively back-strip the main stratigraphic units using a Te that depends on the depth to a particular oceanic isotherm. The tectonic subsidence obtained by back-stripping was then used to compute the backstrip Moho assuming, in this case, airy isostasy. The next step was to calculate the rifting anomaly (from FEBRUARY 1999
THE LEADING EDGE
261
the tectonic subsidence and uplift and the back-strip Moho), the sedimentation anomaly (from the sediment load and its compensation), combine the two anomalies, and compare them to the observed anomaly. The combined anomalies were calculated for two cases of TeÑone where Te was given by the depth to the 450¡C and one where it followed the 150¡C. Figure 4 shows that neither case explains all the details of the observed profile. Portions of the profile, however, can be explained. The eastern end of the profile, for example, can be best explained by the calculated anomaly that is based on a Te that depends on the depth to the 450¡C isotherm while the western end of the profile seems to be best fit by the 150¡C isotherm. Since we know that oceanic Te depends on the depth to the 450¡C isotherm, this suggests that the eastern end of the profile is underlain by oceanic crust. The western end of the profile, however, appears too weak to be explained by an oceanic model, suggesting that it is underlain by rifted continental crust instead. A combination model in which a strong crust to the east of the shelf break abuts a weak one to the west (i.e., a variable Te) explains the observed data well. Once the T e structure is constrained, it is a relatively simple matter to predict the crustal structure. At the Baltimore Canyon Trough, Figure 4 shows that the crustal structure predicted by combined back-stripping and gravity modeling is in good overall agreement with that based on seismic refraction data. This indicates that the seismic Moho is at the depth
that we would expect given the rifting and sediment-loading history of the margin. This is not the case at all rifted margins, however. At the southwest approaches to the U.K. margin, the seismic Moho is deeper than the back-strip Moho, suggesting that the Moho is relatively young compared to the age of rifting and that material has subsequently been added to the crust. At other margins (such as the western Mediterranean), the seismic Moho is shallower, suggesting that material has been removed. The successful application of the process-oriented modeling approach to the determination of Te, and hence crustal structure, at the Baltimore Canyon Trough has encouraged us to apply it to other margins, especially those where there is little or no seismic constraints on the depth to Moho.
Off the west coast of Gabon, for example, the best-fitting model is one in which stretched continental crust underlies the slope and lower rise regions. This region is associated with a large-amplitude gravity anomaly low (Figure 5) which extends for some 500 km along the length of the margin. The low ends abruptly at about 2¡S and 5.6¡S where it changes to a high. Unfortunately, we do not yet have access to seismic reflection profile data from the gravity high regions. It would be interesting, for example, to see if the crust that underlies these regions is also stretched continent or whether it is oceanic. Irrespective of the origin, it is clear from Figure 5 that there is a distinct gravity ÒsegmentationÓ along the length of the Gabon margin. Limiting the ambiguity inherent in
Figure 5. The gravity anomaly field (Bouguer onshore, free-air offshore) of the West Africa margin based on GETECH data. Upper right inset shows the interpreted crustal structure along Profile AB of the Gabon margin, based on a combined back-stripping and gravity modeling approach. 262
THE LEADING EDGE
FEBRUARY 1999
FEBRUARY 1999
THE LEADING EDGE
0000
potential-field data. Our modeling approach is based on potential-field data, so there is an inherent ambiguity in the results. However, we believe that by adopting a combined back-stripping and gravity modeling approach (which takes into account plausible schemes for the manner that sediment and magmatism flexurally load the crust), we have significantly reduced the ambiguity. We caution, however, that the approach does not always yield a definitive answer on crustal type. This is partly because of problems to do with data. The approach relies, for example, on high-quality seismic images of the postrift sedimentary fill and the underlying Òbasement.Ó Because of salt tectonics or basaltic flows, however, such images may be difficult to obtain. Other problems concern the rheological behavior of the lithosphere. For example, the lithosphere may have a finite strength during rifting which, if correct, would modify the rifting anomaly. Indeed, the existence of finite strength is indicated in the rift flank uplifts that persist for long periods of time at many rifted margins. A related problem is that there may not have been sufficient time for the youngest part of the sedimentary section on rifted margins to have been isostatically compensated. This is suggested by the close association of large-amplitude free-air gravity anomaly highs with Plio-Pleistocene river delta systems (e.g., Ebro). Thus, margins may appear to be strong and have a high Te even if most of their sediment fill actually accumulated on a weak lithosphere. We believe, however, that with the application of the approach to more margin systems we should be able to address the rheology problems in the future. We have recently developed a method that is able to use the tectonic subsidence and uplift deduced from back-stripping to compute the back-strip Moho that takes into account the possibility of strength during rifting.
rich fluviatile lake beds. Second, the crustal structure is an important constraint on heat flow at a rifted margin. The change in crustal thickness along a profile provides a measure of the amount of extension and, hence, heating that occurred at a margin during rifting. Since the rate of maturation of organic matter in sediments depends strongly on the duration of heating, the crustal thickness can be used, together with the depositional architecture (e.g., porosity, permeability), to better understand the subsurface fluid circulation in rifted margins. In addition, there are the implications of a gravity segmentation at rifted margins. The segmentation may be due to the extension of oceanic fracture zones into the margin, in which case we would expect differences in the pattern of tectonic subsidence and uplift along the length of a margin. Alternately, the segmentation may be caused by the juxtaposition of lithosphere of different Te structure. Such strength variations would influence not only the tectonic history but also the pattern of faulting (e.g., fault lengths) in the basement and, hence, the geometry of the syn-rift sedimentary fill. Either way, the segmentation would be expected to influence the hydrocarbon play. Some margins (e.g., east coast of Canada) are highly segmented as regards their productivity in oil and gas, with some segments being rich (e.g., Newfoundland) and others being poor (e.g., Nova Scotia), even though the age of rifting is approximately the same along the length of the margin. Also, segmentation implies basement structures and/or stratigraphic ÒaxesÓ that are at a high angle to the local trend of the margin, and these may exert some controls on fluid migration paths. The complexity of rifted margin
structure, together with the increasing availability of high-quality gravity anomaly and seismic data, suggest that it would be useful in the future to develop the modeling approach outlined here. Such an effort would be timely, especially in view of the shift by the hydrocarbon industry into the slope and rise regions. We know (from detailed seismic studies, scientific ocean drilling and bottom sampling) that offshore western Europe (Goban Spur, Galicia Bank) rifted continental crust underlies water depths >4 km. Water depths of >3 km are already within the capability of current oil and gas industry drilling technology. The problem is that at many margins where there has been deep water drilling (e.g., Gulf of Mexico) the deep structure is too poorly known to determine whether a particular well is located on rifted continental crust or not. Combined back-stripping and gravity modeling studies offer an exciting new low-cost prospect to address this problem in the future. Suggestions for further reading. Ò3-D subsidence analysis and gravity modeling of the continental margin offshore NamibiaÓ by Stewart et al. (submitted to the Geophysical Journal). ÒGravity anomalies, crustal structure and flexure of the lithosphere at the Baltimore Canyon TroughÓ by Watts (Scientific Letters, 1988). ÒGravity anomalies and magmatism at the British Isles continental marginÓ by Watts and Fairhead (Geological Society of London, 1997). ÒGravity anomalies and segmentation of the continental margin offshore West Africa, Earth PlanetÓ by Watts and Stewart, (Scientific Letters, 1998). LE Corresponding author: J. D. Fairhead 44-113233-5240; fax 44-113-242-9234; email
[email protected]
Implications for the hydrocarbon industry. Our modeling results have a number of implications to the hydrocarbons industry. First, the determination of crustal type beneath a sedimentary basin (i.e., whether stretched continent or oceanic) is important with regard to source rocks. Stretched continental crust is often associated with narrow halfgrabens, some infilled by organic0000
THE LEADING EDGE
FEBRUARY 1999
FEBRUARY 1999
THE LEADING EDGE
263