Hindawi Publishing Corporation Journal of Electrical and Computer Engineering Volume 2016, Article ID 3583962, 10 pages http://dx.doi.org/10.1155/2016/3583962
Research Article A Processor-Sharing Scheduling Strategy for NFV Nodes Giuseppe Faraci, Alfio Lombardo, and Giovanni Schembra Dipartimento di Ingegneria Elettrica, Elettronica e Informatica (DIEEI), University of Catania, 95123 Catania, Italy Correspondence should be addressed to Giovanni Schembra;
[email protected] Received 2 November 2015; Accepted 12 January 2016 Academic Editor: Xavier Hesselbach Copyright © 2016 Giuseppe Faraci et al. This is an open access article distributed under the Creative Commons Attribution License, which permits unrestricted use, distribution, and reproduction in any medium, provided the original work is properly cited. The introduction of the two paradigms SDN and NFV to “softwarize” the current Internet is making management and resource allocation two key challenges in the evolution towards the Future Internet. In this context, this paper proposes Network-Aware Round Robin (NARR), a processor-sharing strategy, to reduce delays in traversing SDN/NFV nodes. The application of NARR alleviates the job of the Orchestrator by automatically working at the intranode level, dynamically assigning the processor slices to the virtual network functions (VNFs) according to the state of the queues associated with the output links of the network interface cards (NICs). An extensive simulation set is presented to show the improvements achieved with respect to two more processorsharing strategies chosen as reference.
1. Introduction In the last few years the diffusion of new complex and efficient distributed services in the Internet is becoming increasingly difficult because of the ossification of the Internet protocols, the proprietary nature of existing hardware appliances, the costs, and the lack of skilled professionals for maintaining and upgrading them. In order to alleviate these problems, two new network paradigms, Software Defined Networks (SDN) [1–5] and Network Functions Virtualization (NFV) [6, 7], have been recently proposed with the specific target of improving the flexibility of network service provisioning and reducing the time to market of new services. SDN is an emerging architecture that aims at making the network dynamic, manageable, and cost-effective, by decoupling the system that makes decisions about where traffic is sent (the control plane) from the underlying system that forwards traffic to the selected destination (the data plane). In this way the network control becomes directly programmable and the underlying infrastructure is abstracted for applications and network services. NFV is a core structural change in the way telecommunication infrastructure is deployed. The NFV initiative started in late 2012 by some of the biggest telecommunications service providers, which formed an Industry Specification
Group (ISG) within the European Telecommunications Standards Institute (ETSI). The interest has grown, involving today more than 28 network operators and over 150 technology providers from across the telecommunications industry [7]. The NFV paradigm leverages on virtualization technologies and commercial off-the-shelf programmable hardware, such as general-purpose servers, storage, and switches, with the final target of decoupling the software implementation of network functions from the underlying hardware. The coexistence and the interaction of both NFV and SDN paradigms is giving to the network operators the possibility of achieving greater agility and acceleration in new service deployments, with a consequent considerable reduction of both Capital Expenditure (CAPEX) and Operational Expenditure (OPEX) [8]. One of the main challenging problems in deploying an SDN/NFV network is an efficient design of resource allocation and management, functions that are in charge of the network Orchestrator. Although this task is well covered in data center and cloud scenarios [9, 10], it is currently a challenging problem in a geographic network where transmission delays cannot be neglected, and transmission capacities of the interconnection links are not comparable with the case of above scenarios. This is the reason why the problem of orchestrating an SDN/NFV network is still open and attracts a lot of research interest from both academia and industry.
2 More specifically, the whole problem of orchestrating an SDN/NFV network is very complex because it involves a design work at both internode and intranode levels [11, 12]. At the internode level, and in all the cases where the time between each execution is significantly greater than the time to collect, compute, and disseminate results, the application of a centralized approach is practicable [13, 14]. In these cases, in fact, taking into consideration both traffic characterization and required level of quality of service (QoS), the Orchestrator is able to decide in a centralized manner how many instances of the same function have to be run simultaneously, the network nodes that have to execute them, and the routing strategies that allow traffic flows to cross the nodes where the requested network functions are running. Instead, centralizing a strategy dealing with operations that require dynamic reconfiguration of network resources is actually unfeasible to be executed by the Orchestrator for problems of resilience and scalability. Therefore, adaptive management operations with short timescales require a distributed approach. The authors of [15] propose a framework to support adaptive resource management operations, which involve short timescale reconfiguration of network resources, showing how requirements in terms of load-balancing and energy management [16–18] can be satisfied. Another work in the same direction is [19] that proposes a solution for the consolidation of VMs on local computing resources, exclusively based on local information. The work in [20] aims at alleviating the inter-VM network latency defining a hypervisor scheduler algorithm that is able to take into consideration the allocation of the resources within a consolidated environment, scheduling VMs to reduce their waiting latency in the run queue. Another approach is applied in [21], which introduces a policy to manage the internal on/off switching of virtual network functions (VNFs) in NFV-compliant Customer Premises Equipment (CPE) devices. The focus of this paper is on another fundamental problem that is inherent to resource allocation within an SDN/ NFV node, that is, the decision of the percentage of CPU to be assigned to each VNF. If at a first glance this could show a classical problem of processor sharing that has been widely explored in the past literature [15, 22, 23], actually it is much more complex because performance can be strongly improved by leveraging on the correlation with the output queues associated with the network interface cards (NICs). With all this in mind, the main contribution of this paper is the definition of a processor-sharing policy, in the following referred to as Network-Aware Round Robin (NARR), which is specific for SDN/NFV nodes. Starting from the consideration that packets that have received the service of a network function from a virtual machine (VM) running on a given node are enqueued to wait for transmission through a given NIC, the proposed strategy dynamically changes the slices of the CPU assigned to each VNF according to the state of the output NIC queues. More specifically, the NARR strategy gives a larger CPU slice to serve packets that will leave the node through the NIC that is currently less loaded, in such a way as to minimize wastes of the NIC output link capacities, also minimizing the overall delay experienced by packets traversing nodes that implement NARR.
Journal of Electrical and Computer Engineering As a side contribution, the paper calculates an on-off model for the traffic leaving the SDN/NFV node on each NIC output link. This model can be used as a building block for the design and performance evaluation of an entire network. The paper is structured as follows. Section 2 describes the node architecture. Section 3 introduces the NARR strategy. Section 4 presents a case study and shows some numerical results. Finally, Section 5 draws some conclusions and discusses some future work.
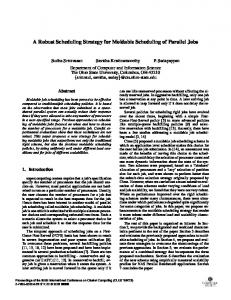
2. System Description The target of this section is the description of the system we consider in the rest of the paper. It is an SDN/NFV node as the one considered in [11, 12], where we will apply the NARR strategy. Its architecture, shown in Figure 1(a), is compliant with the ETSI Specifications [24]. It is composed of three different domains, namely, the Compute domain, the Hypervisor domain, and the Infrastructure Network domain. The Compute domain provides the computational and storage hardware resources that allow the node to host the VNFs. Thanks to the computing and storage virtualization provided by the Hypervisor domain, a VM can be created, migrated from one node to another one, and halted, in order to optimize the deployment according to specific performance parameters. Communications among the VMs, and between the VMs and the external environment, are provided by the Infrastructure Network domain. The SDN/NFV node is remotely controlled by the Orchestrator, whose architecture is shown in Figure 1(b). It is constituted by three main blocks. The Orchestration Engine executes all the algorithms and the strategies to manage and orchestrate the whole network. After each decision, the Orchestration Engine requests that the NFV Coordinator instantiates, migrates, or halts VMs and consequently requests that the SDN Controller modifies the flow tables of the SDN switches in the network in such a way that traffic flows can traverse VMs hosting the requested VNFs. With this in mind, a functional architecture of the NFV node is represented in Figure 2. Its main components are the Processor, which manages the Compute domain and hosts the Hypervisor domain, and the Network Card Interfaces (NICs) with their queues, which constitute the “Network Hardware” block in Figure 1. Let 𝑀 be the number of virtual network functions (VNFs) that are running in the node, and let 𝐿 be the number of output NICs. In order to simplify notation, in the following we will assume that all the NICs have the same characteristics in terms of buffer capacity and output rate. So, let 𝐾(NIC) be the size of the queue associated with each NIC, that is, the maximum number of packets that each queue can contain, and let 𝜇(NIC) be the transmission rate of the output link associated with each NIC, expressed in bit/s. The Flow Distributor block has the task of routing each entering flow towards the function required by the flow. It is a software SDN switch that can be implemented, for example, with OpenvSwitch [25]. It routes the flows to the VMs running the requested VNFs according to the control messages received by the SDN Controller residing in the
Journal of Electrical and Computer Engineering
Hypervisor domain
VNF
Compute domain
VNF
Virtual computing
3
···
Infrastructure Network domain
VNF
Virtual storage
Virtual network
Orchestration engine
Virtualization layer Computing hardware
Storage hardware
NFVI nodes
Network hardware
NFV coordinator
SDN controller NIC
NIC
NIC
NFV node (b) Orchestrator
(a) NFV node
Figure 1: Network function virtualization infrastructure.
Processor Arbiter 𝜇(F) [1]
.. .
FM
N1
Processor
Flow distributor
F1
.. .
NL
𝜇(F) [M]
𝜇(N)
𝜇(N)
Figure 2: NFV node functional architecture.
Orchestrator. The most common protocol that can be used for the communications between the SDN Controller and the Orchestrator is OpenFlow [26]. Let 𝜇(𝑃) be the total processing rate of the processor, expressed in packets/s. This rate is shared among all the active functions according to a processor rate scheduling strategy. (𝐹) , with 𝑚 ∈ Let 𝜇(𝐹) be the array whose generic element, 𝜇[𝑚] {1, . . . , 𝑀}, is the portion of the processor rate assigned to the VM implementing the function 𝐹𝑚 . Of course we have 𝑀
(𝐹) = 𝜇(𝑃) . ∑ 𝜇[𝑚]
(1)
𝑚=1
Once a packet has been served by the required function, it is sent to one of the NICs to exit from the node. If the NIC is transmitting another packet, the arriving packets are enqueued in the NIC queue. We will indicate the queue associated with the generic NIC 𝑙 as 𝑄𝑙(NIC) .
In order to implement the NARR strategy proposed in this paper, we realize the block relative to each function with a set of 𝐿 parallel queues, in the following referred to as insidefunction queues, as shown in Figure 3 for the generic function 𝐹𝑚 . The generic 𝑙th inside-function queue of the function 𝐹𝑚 , indicated as 𝑄𝑚,𝑙 in Figure 3, is used to enqueue packets that, after receiving the service of the function 𝐹𝑚 , will leave the (𝐹) node through the NIC 𝑙. Let 𝐾Ins be the size of each insidefunction queue. Each inside-function queue of the generic function 𝐹𝑚 receives a portion of the processor rate assigned (𝐹Ins ) to that function. Let 𝜇[𝑚,𝑙] be the portion of the processor rate assigned to the queue 𝑄𝑚,𝑗 of the function 𝐹𝑚 . Of course, we have 𝐿
(𝐹 )
(𝐹) Ins = 𝜇[𝑚] . ∑ 𝜇[𝑚,𝑙] 𝑙=1
(2)
4
Journal of Electrical and Computer Engineering
Qm,1
With this in mind, the idea is to give a higher processor slice to the inside-function queues whose flows are directed to the NICs that are emptying. Taking into account the goal of privileging the flows that will leave the node through underloaded NICs, the Processor ( → NIC ) Arbiter calculates 𝜇Aggr 𝑙 as follows:
(F )
Int 𝜇[m,1]
.. . Qm,l
( → NIC𝑙 )
(F )
𝜇Aggr
Int 𝜇[m,l]
.. . Qm,L
=
𝑞ref − 𝑆𝑙(NIC)
∑𝐿𝑗=1 {𝑞ref − 𝑆𝑗(NIC) }
𝜇(𝑃) ,
where 𝑆𝑙(NIC) represents the state of the queue associated with the NIC 𝑙, while 𝑞ref is defined as follows: (F )
Int 𝜇[m,L]
𝑞ref = min {𝛼 ⋅ max (𝑆𝑗(NIC) ) , 𝐾(NIC) } . 𝑗
Fm
Figure 3: Block diagram of the generic function 𝐹𝑚 .
The portion of processor rate associated with each insidefunction queue is dynamically changed by the Processor Arbiter according to the NARR strategy described in Section 3.
3. NARR Processor-Sharing Strategy The NARR (Network-Aware Round Robin) processor-sharing strategy observes the state of both the inside-function queues and the NIC queues, with the goal of reducing as far as possible the inactivity periods of the NIC output links. As already introduced in the Introduction, its definition starts from the fact that packets that have received the service of a VNF are enqueued to wait for transmission through a given NIC. So, in order to avoid output link capacity waste, NARR dynamically changes the slices of the CPU assigned to each VNF, and in particular to each inside-function queue, according to the state of the output NIC queues, assigning larger CPU slices to serve packets that will leave the node through less-loaded NICs. More specifically, the Processor Arbiter decides the processor rate portions according to two different steps. Step 1 (assignment of the processor rate portion to the aggregation of queues whose output is a specific NIC). This step meets the target of the proposed strategy that is to reduce, as much as possible, underutilization of the NIC output links and, as a consequence, delays in the relative queues. To this purpose, let us consider a virtual queue that contains all the packets that are stored in all the inside-function queues 𝑄𝑚,𝑙 , for each 𝑚 ∈ [1, 𝑀], that is, all the packets that will leave the node through the NIC 𝑙. Let us indicate this virtual queue as ( → NIC ) ( → NIC ) 𝑄Aggr 𝑙 , and its service rate as 𝜇Aggr 𝑙 . Of course, we have ( → NIC𝑙 )
𝜇Aggr
(4)
𝑀
(𝐹 )
Ins = ∑ 𝜇[𝑚,𝑙] .
𝑚=1
(3)
(5)
The term 𝑞ref is a reference target value calculated from the state of the NIC queue that has the highest length, amplified with a coefficient 𝛼, and truncated to the maximum queue size 𝐾(NIC) . It is determined in such a way that, if we consider 𝛼 = 1, the NIC queue that has the highest length does not receive packets from the inside-function queues because the service rate of them is set to zero; the other queues receive packets with a rate that is proportional to the distance between their length and the length of the most overloaded NIC queue. However, through an extensive set of simulations, we deduced that setting 𝛼 = 1 causes bad performance because there is always a group of inside-function queues that are not served. Instead, all the 𝛼 values in the interval ]1, 2] give almost equivalent performance. For this reason, in the numerical analysis presented in Section 4, we have set 𝛼 = 1.2. Step 2 (assignment of the processor rate portion to each inside-function queue). Let us consider the generic 𝑙th inside-function queue of the function 𝐹𝑚 , that is, the queue 𝑄𝑚,𝑙 . Its service rate is calculated as being proportional to the current state of this queue in comparison with the other 𝑙th queues of the other functions. To this purpose, let us indicate ( → NIC ) ( → NIC ) the state of the virtual queue 𝑄Aggr 𝑙 as 𝑆Aggr 𝑙 . Of course, it can be calculated as the sum of the states of all the insidefunction queues 𝑄𝑚,𝑙 , for each 𝑚 ∈ [1, 𝑀]: that is, ( → NIC𝑙 )
𝑆Aggr
𝑀
(𝐹 )
= ∑ 𝑆𝑘,𝑙Ins .
(6)
𝑘=1
So, the service rate of the inside-function queue 𝑄𝑚,𝑙 is determined as a fraction of the service rate assigned at the ( → NIC ) ( → NIC ) first step to the virtual queue 𝑄Aggr 𝑙 , 𝜇Aggr 𝑙 , as follows: (𝐹 )
Ins 𝜇[𝑚,𝑙] =
(𝐹 )
𝑆𝑚,𝑙Ins
( → NIC𝑙 ) 𝜇 . ( → NIC𝑙 ) Aggr 𝑆Aggr
(7)
Of course, if at any time an inside-function queue remains empty, the processor rate portion assigned to it will be shared among the other queues proportionally to the processor portions previously assigned. Likewise, if at some instant an empty queue receives a new packet, the previous processor rate portion is reassigned to that queue.
Journal of Electrical and Computer Engineering
5
4. Case Study In this section we present a numerical analysis of the behavior of an SDN/NFV node that applies the proposed NARR processor-sharing strategy, with the target of evaluating the achieved performance. To this purpose, we will consider two other processor-sharing strategies as reference, in the following referred to as round robin (RR) and queue-length weighted round robin (QLWRR). In both the reference cases, the node has the same 𝐿 NIC queues, but it has only 𝑀 processor queues, one for each function. Each of the 𝑀 (𝐹) (𝐹) , where 𝐾Ins represents queues has a size of 𝐾(𝐹) = 𝐿 ⋅ 𝐾Ins the size of each internal function queue, already defined so far for the proposed strategy. The RR strategy applies the classical round robin scheduling policy to serve the 𝑀 function queues; that is, it serves (𝐹) = 𝜇(𝑃) /𝑀. each function queue with a rate 𝜇RR The QLWRR strategy, on the other hand, serves each function queue with a rate that is proportional to the queue length; that is, (𝐹 )
𝑚 = 𝜇QLWRR
(𝐹𝑚 )
where 𝑆 tion 𝐹𝑚 .
𝑆(𝐹𝑚 ) (𝐹𝑘 ) ∑𝑀 𝑘=1 𝑆
𝜇(𝑃) ,
(8)
is the state of the queue associated with the func-
4.1. Parameter Settings. In this numerical analysis, we consider a node with 𝑀 = 4 VNFs, and 𝐿 = 3 output NICs. We loaded the node with a balanced traffic constituted by 𝑁𝐹 = 12 flows, each characterized by a different 2-uple {𝑟𝑒𝑞𝑢𝑒𝑠𝑡𝑒𝑑 𝑁𝐹𝑉, 𝑜𝑢𝑡𝑝𝑢𝑡 𝑁𝐼𝐶}. Each flow has been generated with an on-off model characterized by exponentially distributed on and off periods. When a flow is in off state, no packets arrive to the node from it; instead, when it is in on state, packets arrive with an average rate 𝜆 ON . Each packet is assumed with an exponential distributed size with a mean of 1 kbyte. In all the simulations we have considered the same on-off cycle duration, 𝛿 = 𝑇OFF + 𝑇ON = 5 msec, while we have varied the burstiness. Burstiness of on-off sources is defined as 𝜆 𝑏 = ON , (9) 𝜆 Mean where 𝜆 Mean is the mean emission rate. Now, indicating the probability of the ON state as 𝜋ON , and taking into account that 𝜆 Mean = 𝜆 ON ⋅ 𝜋ON and 𝜋ON = 𝑇ON /(𝑇OFF + 𝑇ON ), we have 𝑏=
𝑇OFF + 𝑇ON 𝑇ON
.
(10)
In our analysis, the burstiness has been varied in the range [2, 22]. Consequently, we have derived the mean durations of the off and on periods, as follows: 𝑇ON =
𝛿 , 𝑏
𝑇OFF = 𝛿 − 𝑇ON .
(11)
Finally, in order to maintain the same mean packet rate for different values of 𝑇OFF and 𝑇ON , we have assumed that 75 packets are transmitted, on average: that is, 𝜆 ON = 75/𝑇ON . The resulting mean emission rate is 𝜆 Mean = 122.9 Mbit/s. As far as the NICs are concerned, we have considered an output rate of 𝜇(NIC) = 980 Mbit/s, so having a utilization coefficient on each NIC of 𝜌(NIC) = 0.5, and a queue size 𝐾(NIC) = 3000 packets. Instead, regarding the processor, we (𝐹) considered a size of each inside-function queue of 𝐾Ins = 3000 packets. Finally, we have analyzed two different processor cases. In the first case we considered a processor that is able to process 𝜇(𝑃) = 306 kpackets/s, while in the second case we assumed a processor rate of 𝜇(𝑃) = 204 kpackets/s. Therefore, defining the processor utilization coefficient as follows: 𝜌(𝑃) =
𝑁𝐹 ⋅ 𝜆 Mean 𝜇(𝑃)
(12)
with 𝑁𝐹 ⋅ 𝜆 Mean being the total mean arrival rate to the node, the two considered cases are characterized by a processor uti(𝑃) (𝑃) = 0.6 and 𝜌High = 0.9, respectively. lization coefficient of 𝜌Low 4.2. Numerical Results. In this section we present some results achieved by discrete-event simulations. The simulation tool used in the paper is publicly available in [27]. We first present a temporal analysis of the main variables characterizing the SDN/NFV node, and then we show a performance comparison of NARR with the two strategies RR and QLWRR, taken as a reference. For the temporal analysis we focus on a short time interval of 720 𝜇sec, in order to be able to clearly highlight the evolution of the considered processes. We have loaded the node with an on-off traffic like the one described in Section 4.1, with a burstiness 𝑏 = 7. Figures 4, 5, and 6 show the time evolution of the length of the queues associated with the NICs, the processor slice assigned to each virtual queue loading each NIC, and the length of the same virtual queues. We can subdivide the considered time interval into three different periods. In the first period, ranging from the instants 0.1063 and 0.1067, from Figure 4 we can notice that the NIC queue 𝑄1(NIC) has a greater length than the queue 𝑄3(NIC) , while 𝑄2(NIC) is empty. For this reason in this period, as shown in Figure 5, ( → NIC ) ( → NIC ) the processor is shared between 𝑄Aggr 1 and 𝑄Aggr 3 , and ( → NIC3 )
the slice assigned to serve 𝑄Aggr
𝑄1(NIC)
is higher, in such a way
and 𝑄3(NIC) reach the same that the two queue lengths value, situation that happens at the end of the first period, around the instant 0.1067. During this period, the behavior ( → NIC ) ( → NIC ) of both the virtual queues 𝑄Aggr 1 and 𝑄Aggr 3 in Figure 6 remains flat, showing the fact that the received processor rates are able to balance the arrival rates. At the beginning of the second period that ranges between the instants 0.1067 and 0.10693, the processor rate ( → NIC ) assigned to the virtual queue 𝑄Aggr 3 has become not sufficient to serve the amount of arriving traffic, and so the virtual ( → NIC ) queue 𝑄Aggr 3 increases its length, as shown in Figure 6.
6
Journal of Electrical and Computer Engineering 70
During this second period, the processor slices assigned to ( → NIC ) ( → NIC ) the two queues 𝑄Aggr 1 and 𝑄Aggr 3 are adjusted in such a
Queue length (packets)
60 50
S1(NIC)
40 30
S3(NIC)
S3(NIC)
20 10
S2(NIC)
0 0.1063 0.1064 0.1065 0.1066 0.1067 0.1068 0.1069 Time (s)
0.107
Figure 4: Lenght evolution of the NIC queues.
220 (→NIC2 )
(→NIC3 )
200
𝜇Aggr
𝜇Aggr
Processor rate (kpackets/s)
180 160 140 120 (→NIC1)
𝜇Aggr
100 80 60
(→NIC3 )
𝜇Aggr
40 20
0 0.1063 0.1064 0.1065 0.1066 0.1067 0.1068 0.1069 Time (s)
0.107
Figure 5: Packet rate assigned to the virtual queues.
150 (→NIC1)
Queue length (packets)
SAggr
100
(→NIC3 )
50
SAggr
(→NIC2 )
SAggr
0 0.1063 0.1064 0.1065 0.1066 0.1067 0.1068 0.1069 Time (s)
Figure 6: Lenght evolution of the virtual queues.
0.107
way that 𝑄1(NIC) and 𝑄3(NIC) remain with comparable lengths. The last period starts at the instant 0.10693, characterized ( → NIC ) by the fact that the aggregated queue 𝑄Aggr 2 leaves the empty state, and therefore participates in the processor-sharing process. Since the NIC queue 𝑄2(NIC) is low-loaded, as ( → NIC ) shown in Figure 4, the largest slice is assigned to 𝑄Aggr 2 in
such a way that 𝑄2(NIC) can reach the same length of the other two NIC queues as soon as possible. Now, in order to show how the second step of the proposed strategy works, we present the behavior of the insidefunction queues whose output is sent to the NIC queue 𝑄3(NIC) during the same short time interval considered so far. More specifically, Figures 7 and 8 show the length of the considered inside-function queues, and the processor slices assigned to them, respectively. The behavior of the queue 𝑄2,3 is not shown because it is empty in the considered period. As we can observe from the above figures, we can subdivide the interval into four periods: (i) The first period, ranging in the interval [0.1063, 0.10657] is characterized by an empty state of the queue 𝑄3,3 . Thus, in this period, the processor slice ( → NIC ) assigned to the aggregated queue 𝑄Aggr 3 is shared by 𝑄1,3 and 𝑄4,3 , only. (ii) During the second period, ranging in the interval [0.10657, 0.1067], 𝑄1,3 is scarcely loaded (in particular it is empty in the second part of this period), and so the processor slice assigned to 𝑄3,3 is increased. (iii) In the third period, ranging between 0.1067 and 0.10693, all the queues increase and equally share the processor. (iv) Finally, in the last period, starting at the instant 0.10693, as already observed in Figure 5, the processor ( → NIC ) slice assigned to the aggregated queue 𝑄Aggr 3 is suddenly decreased, and consequently the slices assigned to the queues 𝑄1,3 , 𝑄3,3 , and 𝑄4,3 are decreased as well. The steady-state analysis is presented in Figures 9, 10, and 11, which show the mean delay in the inside-function queues, in the NIC queues, and the durations of the offand on-states on the output links. The values reported in all the figures have been derived as the mean values of the results of many simulation experiments, using Student’s 𝑡distribution and with a 95% confidence interval. The number of experiments carried out to evaluate each numerical result has been automatically decided by the simulation tool with the requirement of achieving a confidence interval less than 0.001 of the estimated mean value. To this purpose, the confidence interval is calculated at the end of each run, and simulation is stopped only when the confidence interval matches the maximum error requirement. The duration of each run has been chosen in such a way that the sample standard deviation is so low that less than 30 runs are enough to match the requirement.
7
50
50
45
45
40
40 Queue length (packets)
Queue length (packets)
Journal of Electrical and Computer Engineering
35 30 25 20 15
35 30 25 20 15
10
10
5
5
0 0.1063 0.1064 0.1065 0.1066 0.1067 0.1068 0.1069 Time (s)
0.107
0 0.1063 0.1064 0.1065 0.1066 0.1067 0.1068 0.1069 Time (s)
(a) Queue 𝑄1,3
0.107
(b) Queue 𝑄3,3
50 45
Queue length (packets)
40 35 30 25 20 15 10 5 0 0.1063 0.1064 0.1065 0.1066 0.1067 0.1068 0.1069 Time (s)
0.107
(c) Queue 𝑄4,3
Figure 7: Length evolution of the inside-function queues 𝑄𝑚,3 , for each 𝑚 ∈ [1, 𝑀].
The figures compare the results achieved with the proposed strategy with the ones obtained with the two strategies RR and QLWRR. As said so far, results have been obtained against the burstiness, and for two different values of the (𝑃) (𝑃) = 0.6 and 𝜌High = 0.9. utilization coefficient: that is, 𝜌Low As expected, the mean lengths of the processor queues and the NIC queues increase with both the burstiness and the utilization coefficient. Instead, we can note that the mean length of the processor queues is not affected by the applied policy. In fact, packets requiring the same function are enqueued in a unique queue and served with a rate 𝜇(𝑃) /4, when RR or QLWRR strategies are applied, while, when the NARR strategy is used, they are split into 12 different queues and served with a rate 𝜇(𝑃) /12. If in a classical queueing theory [28] the second case is worse than the first one because of the presence of service rate wastes during the more probable periods of empty queues, this is not the case here because the processor capacity of an empty queue is dynamically reassigned to the other queues.
The advantage of the NARR strategy is evident in Figure 10, where the mean delay in the NIC queues is represented. In fact, we can observe that, with only giving more processor rate to the most loaded processor queues (with the QLWRR strategy), performance improvements are negligible, while applying the NARR strategy we are able to obtain a delay reduction of about 12% in the case of a more performant (𝑃) = 0.6), reaching the 50% when the processor processor (𝜌Low (𝑃) works with a 𝜌High = 0.9. The performance gain achieved with the NARR strategy increases with burstiness and the processor load, conditions that are both likely. In fact, the first condition is due to the high burstiness of the Internet traffic; the second one is true as well because the processor should be not overdimensioned for economic purposes; otherwise, if overdimensioned, it can be controlled with a processor rate management policy like the one presented in [29] in order to save energy. Finally, Figure 11 shows the mean durations of the onand off-periods on the node output links. Only one curve is
Journal of Electrical and Computer Engineering 140
140
120
120 Processor rate (kpackets/s)
Processor rate (kpackets/s)
8
100 80 60 40 20
100 80 60 40 20
0 0.1063 0.1064 0.1065 0.1066 0.1067 0.1068 0.1069 Time (s)
0.107
0 0.1063 0.1064 0.1065 0.1066 0.1067 0.1068 0.1069 Time (s)
(𝐹 )
0.107
(𝐹 )
Int (a) Processor rate 𝜇[1,3]
Int (b) Processor rate 𝜇[3,3]
140
Processor rate (kpackets/s)
120 100 80 60 40 20 0 0.1063 0.1064 0.1065 0.1066 0.1067 0.1068 0.1069 Time (s)
0.107
(𝐹 )
Int (c) Processor rate 𝜇[4,3]
Figure 8: Processor rate assigned to the inside-function queues 𝑄𝑚,3 , for each 𝑚 ∈ [1, 𝑀].
shown for each case because we have considered a utilization coefficient 𝜌(NIC) = 0.5 on each NIC queue, and therefore in the considered case we have 𝑇ON = 𝑇OFF . As expected, the mean on-off durations are higher when the processor rate is higher (i.e., lower utilization coefficient). This is because, in this case, the output processor rate is lower, and therefore batches of packets in the NIC queues are served quickly. These results can be used to model the output traffic of each SDN/NFV node as an Interrupted Poisson Process (IPP) [30]. This model can be iteratively used to represent the input traffic of other nodes, with the final target of realizing the model of a whole SDN/NFV network.
5. Conclusions and Future Work This paper addresses the problem of intranode resource allocation, by introducing NARR, a processor-sharing strategy
that leverages on the consideration that, in any SDN/NFV node, packets that have received the service of a VNF are enqueued to wait for transmission through one of the output NICs. Therefore, the idea at the base of NARR is to dynamically change the slices of the CPU assigned to each VNF according to the state of the output NIC queues, giving more CPU to serve packets that will leave the node through the less-loaded NICs. In this way, wastes of the NIC output link capacities are minimized, and consequently the overall delay experienced by packets traversing the nodes that implement NARR is reduced. SDN/NFV nodes that implement NARR can coexist in the same network with nodes that use other strategies, so facilitating a gradual introduction in the Future Internet. As a side contribution, the simulator tool, which is public available on the web, gives the on-off model of the output links associated with each NIC as one of the results. This model can be used as a building block to realize a model for
Journal of Electrical and Computer Engineering
9 180 160
𝜌(P) Low = 0.6
2.5 140 2
120 Time (𝜇s)
Mean delay in the processor queues (ms)
3
𝜌(P) = 0.9 High
1.5 1
𝜌(P) Low = 0.6
100 80 𝜌(P) = 0.9 High
60 40
0.5 20 0
2
3
4
5
6 7 Burstiness
8
9
10
11
NARR QLWRR RR
0
2
3
4
5
6 7 Burstiness
8
9
10
11
NARR QLWRR RR
Figure 9: Mean delay in the function internal queues.
Figure 11: Mean off- and on-states duration of the traffic on the output links.
0.5 Mean delay in the NIC queues (ms)
0.45
cloUd Service Support) project funded by the European Commission under the Horizon 2020 Programme (Call H2020-ICT-2014-1, Grant no. 644672).
𝜌(P) Low = 0.6
0.4 0.35 0.3
References
= 0.9 𝜌(P) High
0.25 0.2 0.15 0.1 0.05 0
2
3
4
5
6 7 Burstiness
8
9
10
11
NARR QLWRR RR
Figure 10: Mean delay in the NIC queues.
the design and performance evaluation of a whole SDN/NFV network.
Conflict of Interests The authors declare that there is no conflict of interests regarding the publication of this paper.
Acknowledgment This work has been partially supported by the INPUT (InNetwork Programmability for Next-Generation Personal
[1] White paper on “Software-Defined Networking: The New Norm for Networks”, https://www.opennetworking.org/. [2] M. Yu, L. Jose, and R. Miao, “Software defined traffic measurement with OpenSketch,” in Proceedings of the Symposium on Network Systems Design and Implementation (NSDI ’13), vol. 13, pp. 29–42, Lombard, Ill, USA, April 2013. [3] H. Kim and N. Feamster, “Improving network management with software defined networking,” IEEE Communications Magazine, vol. 51, no. 2, pp. 114–119, 2013. [4] S. H. Yeganeh, A. Tootoonchian, and Y. Ganjali, “On scalability of software-defined networking,” IEEE Communications Magazine, vol. 51, no. 2, pp. 136–141, 2013. [5] B. A. A. Nunes, M. Mendonca, X.-N. Nguyen, K. Obraczka, and T. Turletti, “A survey of software-defined networking: past, present, and future of programmable networks,” IEEE Communications Surveys and Tutorials, vol. 16, no. 3, pp. 1617–1634, 2014. [6] White paper on “Network Functions Virtualisation”, http://portal.etsi.org/NFV/NFV White Paper.pdf. [7] Network Functions Virtualisation (NFV): Network Operator Perspectives on Industry Progress, ETSI, October 2013, http:// portal.etsi.org/NFV/NFV White Paper2.pdf. [8] A. Manzalini, R. Saracco, E. Zerbini et al., “Software-Defined Networks for Future Networks and Services,” White Paper based on the IEEE Workshop SDN4FNS, http://sites.ieee.org/ sdn4fns/whitepaper/. [9] R. Z. Frantz, R. Corchuelo, and J. L. Arjona, “An efficient orchestration engine for the cloud,” in Proceedings of the IEEE 3rd International Conference on Cloud Computing Technology
10
[10]
[11]
[12]
[13]
[14]
[15]
[16]
[17]
[18]
[19]
[20]
[21]
[22] [23]
Journal of Electrical and Computer Engineering and Science (CloudCom ’11), vol. 2, pp. 711–716, Athens, Greece, December 2011. K. Bousselmi, Z. Brahmi, and M. M. Gammoudi, “Cloud services orchestration: a comparative study of existing approaches,” in Proceedings of the 28th IEEE International Conference on Advanced Information Networking and Applications Workshops (WAINA ’14), pp. 410–416, Victoria, Canada, May 2014. A. Lombardo, A. Manzalini, V. Riccobene, and G. Schembra, “An analytical tool for performance evaluation of software defined networking services,” in Proceedings of the IEEE Network Operations and Management Symposium (NMOS ’14), pp. 1–7, Krakow, Poland, May 2014. A. Lombardo, A. Manzalini, G. Schembra, G. Faraci, C. Rametta, and V. Riccobene, “An open framework to enable NetFATE (network functions at the edge),” in Proceedings of the IEEE Workshop on Management Issues in SDN, SDI and NFV (Mission ’15), pp. 1–6, London, UK, April 2015. A. Manzalini, R. Minerva, F. Callegati, W. Cerroni, and A. Campi, “Clouds of virtual machines in edge networks,” IEEE Communications Magazine, vol. 51, no. 7, pp. 63–70, 2013. H. Moens and F. De Turck, “VNF-P: a model for efficient placement of virtualized network functions,” in Proceedings of the 10th International Conference on Network and Service Management (CNSM ’14), pp. 418–423, Rio de Janeiro, Brazil, November 2014. K. Katsalis, G. S. Paschos, Y. Viniotis, and L. Tassiulas, “CPU provisioning algorithms for service differentiation in cloudbased environments,” IEEE Transactions on Network and Service Management, vol. 12, no. 1, pp. 61–74, 2015. D. Tuncer, M. Charalambides, G. Pavlou, and N. Wang, “Towards decentralized and adaptive network resource management,” in Proceedings of the 7th International Conference on Network and Service Management (CNSM ’11), pp. 1–6, Paris, France, October 2011. D. Tuncer, M. Charalambides, G. Pavlou, and N. Wang, “DACoRM: a coordinated, decentralized and adaptive network resource management scheme,” in Proceedings of the IEEE Network Operations and Management Symposium (NOMS ’12), pp. 417–425, IEEE, Maui, Hawaii, USA, April 2012. M. Charalambides, D. Tuncer, L. Mamatas, and G. Pavlou, “Energy-aware adaptive network resource management,” in Proceedings of the IFIP/IEEE International Symposium on Integrated Network Management (IM ’13), pp. 369–377, Ghent, Belgium, May 2013. C. Mastroianni, M. Meo, and G. Papuzzo, “Probabilistic consolidation of virtual machines in self-organizing cloud data centers,” IEEE Transactions on Cloud Computing, vol. 1, no. 2, pp. 215–228, 2013. B. Guan, J. Wu, Y. Wang, and S. U. Khan, “CIVSched: a communication-aware inter-VM scheduling technique for decreased network latency between co-located VMs,” IEEE Transactions on Cloud Computing, vol. 2, no. 3, pp. 320–332, 2014. G. Faraci and G. Schembra, “An analytical model to design and manage a green SDN/NFV CPE node,” IEEE Transactions on Network and Service Management, vol. 12, no. 3, pp. 435–450, 2015. L. Kleinrock, “Time-shared systems: a theoretical treatment,” Journal of the ACM, vol. 14, no. 2, pp. 242–261, 1967. S. F. Yashkov and A. S. Yashkova, “Processor sharing: a survey of the mathematical theory,” Automation and Remote Control, vol. 68, no. 9, pp. 1662–1731, 2007.
[24] ETSI GS NFV—INF 001, v1.1.1, “Network Functions Virtualization (NFV): Infrastructure Overview”, 2015, https://www.etsi .org/deliver/etsi gs/NFV-INF/001 099/001/01.01.01 60/gs NFVINF001v010101p.pdf. [25] T. N. Subedi, K. K. Nguyen, and M. Cheriet, “OpenFlow-based in-network Layer-2 adaptive multipath aggregation in data centers,” Computer Communications, vol. 61, pp. 58–69, 2015. [26] N. McKeown, T. Anderson, H. Balakrishnan et al., “OpenFlow: enabling innovation in campus networks,” ACM SIGCOMM Computer Communication Review, vol. 38, no. 2, pp. 69–74, 2008. [27] NARR simulator, v.0.1, http://www.diit.unict.it/arti/Tools/NARR Simulator v01.zip. [28] L. Kleinrock, Queueing Systems. Volume 1: Theory, Wiley-Interscience, 1st edition, 1975. [29] R. Bruschi, P. Lago, A. Lombardo, and G. Schembra, “Modeling power management in networked devices,” Computer Communications, vol. 50, pp. 95–109, 2014. [30] W. Fischer and K. S. Meier-Hellstern, “The Markov-Modulated Poisson process (MMPP) cookbook,” Performance Evaluation, vol. 18, no. 2, pp. 149–171, 1993.
International Journal of
Rotating Machinery
Engineering Journal of
Hindawi Publishing Corporation http://www.hindawi.com
Volume 2014
The Scientific World Journal Hindawi Publishing Corporation http://www.hindawi.com
Volume 2014
International Journal of
Distributed Sensor Networks
Journal of
Sensors Hindawi Publishing Corporation http://www.hindawi.com
Volume 2014
Hindawi Publishing Corporation http://www.hindawi.com
Volume 2014
Hindawi Publishing Corporation http://www.hindawi.com
Volume 2014
Journal of
Control Science and Engineering
Advances in
Civil Engineering Hindawi Publishing Corporation http://www.hindawi.com
Hindawi Publishing Corporation http://www.hindawi.com
Volume 2014
Volume 2014
Submit your manuscripts at http://www.hindawi.com Journal of
Journal of
Electrical and Computer Engineering
Robotics Hindawi Publishing Corporation http://www.hindawi.com
Hindawi Publishing Corporation http://www.hindawi.com
Volume 2014
Volume 2014
VLSI Design Advances in OptoElectronics
International Journal of
Navigation and Observation Hindawi Publishing Corporation http://www.hindawi.com
Volume 2014
Hindawi Publishing Corporation http://www.hindawi.com
Hindawi Publishing Corporation http://www.hindawi.com
Chemical Engineering Hindawi Publishing Corporation http://www.hindawi.com
Volume 2014
Volume 2014
Active and Passive Electronic Components
Antennas and Propagation Hindawi Publishing Corporation http://www.hindawi.com
Aerospace Engineering
Hindawi Publishing Corporation http://www.hindawi.com
Volume 2014
Hindawi Publishing Corporation http://www.hindawi.com
Volume 2014
Volume 2014
International Journal of
International Journal of
International Journal of
Modelling & Simulation in Engineering
Volume 2014
Hindawi Publishing Corporation http://www.hindawi.com
Volume 2014
Shock and Vibration Hindawi Publishing Corporation http://www.hindawi.com
Volume 2014
Advances in
Acoustics and Vibration Hindawi Publishing Corporation http://www.hindawi.com
Volume 2014