product to meet and support its functional objectives. .... A software tool has been built to support the ... Support Manager (Who had overall responsibility for.
Journal of Computer Sciences 1 (4 ): 481-486, 2005 ISSN 1549-3636 © Science Publications, 2005
A Proposed Adaptable Quality Model for Software Quality Assurance Souheil Khaddaj and Gerard Horgan School of Computing and Information Systems, Kingston University, Kingston upon Thames, Surrey KT1 2EE, UK Abstract: Many of the early quality models have followed a hierarchical approach in which a set of factors that affect quality are defined, with little scope for expansion. More recent models have been developed that follow a 'Define your own' approach with locally tailored factors. The aim of this study is to present a new model to software quality assurance which addresses the problems of theses approaches and includes quality factors that represent a common set of criteria while allowing tailoring to a local environment. In addition the proposed model allows the quality factors to be determined and analysed in an integrated, adaptable fashion. Key words: Quality modelling, quality measurement, quality assurance THE ADEQUATE QUALITY MODELLING APPROACH
INTRODUCTION Quality is a multidimensional construct reflected in the quality model, where each parameter in the model defines a quality dimension. A metrics measurement-based framework, linked to a quality model, is a requirement for effective software production and quality[1]. Many of the early designs of quality models have followed a hierarchical approach in which a set of factors that affect quality are defined, with little scope for expansion. Early efforts include the Factor Criteria Metric Model[2,3] and the Hierarchical Quality Model[4]. Problems with these models include bias towards maintainability and reliability, non-independent factors and little recognition of different quality requirements for different projects[2,5,6]. In order to address these issues, models were developed that follow a Define Your Own Approach[7], in which a collective decision is made between the developers and the users, as to what attributes constitute quality. The major problem with these approaches is the lack of comprehensive guidelines to produce a consensus view of quality attributes and the inability to provide common quality criteria, due to their tailored nature. The aim of this study is to present a new approach to quality modelling which seeks to combine these modelling approaches, whilst resolving conflicts of opinions of quality, so that quality measurement can be both tailored to a local environment and potentially can be compared across projects. This approach forms the basis of the Adaptable Quality Model, or ADEQUATE for short.
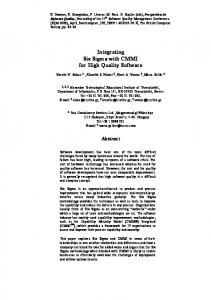
A key to successful quality measurement is to identify those opinions of individuals that are deemed the most important, since these individuals have the most control over the quality of the final product. These opinions are referred to as Essential Views and are determined by examining an individual's expected use of the product, their experiences in developing or using similar products and their overall influence on project decisions. By concentrating on removing conflicts of opinion between the Essential Views, a consensus can be reached as to what properties constitute quality and how quality should be measured. A pictorial representation of the ADEQUATE approach is shown in Fig. 1. The properties that constitute the 'explicit and/or implicit attributes' of quality form a set of Key Quality Factors and a set of Locally Defined Factors. The Key Quality Factors represent global quality criteria, ie factors that are required of all products. The Locally Defined Factors represent local quality criteria, ie additional factors identified by the Essential Views and are appropriate
Fig. 1: The ADEQUATE approach
Corresponding Author: Souheil Khaddaj, School of Computing and Information Systems, Kingston University, Kingston upon Thames, Surrey KT1 2EE, UK
481
J. Comp. Sci., 1 (4 ): 481-486, 2005 Conflict handling and the essential views: Since quality factors depend on many different views, it is necessary to derive methods for determining the Essential Views from the collection of individuals associated with a project. It is envisaged that the overall project manager, in consultation with experienced colleagues will be responsible for identifying the Essential Views. Having identified the Essential Views, any conflicts of quality opinions between these views needs to be removed. Many existing conflict resolution mechanisms[15] presuppose relationships between views and relationships between criteria and views. The conflict removal mechanism chosen in the ADEQUATE approach consists of two stages. First, the relationships between each quality criterion (Whether it be a KQF or an LDF) is identified in order to understand the quality constraints and understand what quality can and cannot be achieved in the final product. Second, the required goals for each criterion is established based on the relationships identified. Both these steps are performed by the Essential Views.
only to the current product being developed. In this way, the KQFs represent a common set of criteria that can be used for cross-project comparisons, whilst the LDFs retain the ability to allow local tailoring. The KQFs also act as a catalyst for enabling the Essential Views to identify other criteria of interest (Which form the LDFs). The key quality factors and locally defined quality factors: In total, seven KQFs are defined. These are Maintainability, Usability, Cost/Benefit, Security, Reliability, Timeliness and Correctness. Maintainability is defined as the ability of a product to be modified. It is included as a KQF primarily due to its perceived importance in other models[2,4,8-10]. Usability is defined as the ability of a product to be used for the purpose chosen. It is a factor that is also considered important in other models[2,8-10]. If a product isn't usable, then there is little point in its existence. Cost/Benefit is defined as the ability of a product to satisfy its cost/benefit specification. The Costs and Benefits involved in a product's creation, should be a major consideration[11]. If the costs are high and the benefits of its development are low, then there is little point in developing the product. Security is defined as the ability of a product to be defended against unauthorised use. Data and information are one of the most important properties to a company. Security, therefore, should always be given a high profile. Reliability is defined as the ability of a product to reproduce its function over a period of time and is also included in other approaches[2,8-10]. Timeliness is defined as the ability of a product to meet delivery deadlines. If a product is delivered late, then it may have good quality aspects, but customers may rightly consider it to be of lesser quality than products delivered on time. It is important, therefore, that there is a focus on delivery requirements 'up-front'. Finally, Correctness is defined as the ability of a product to meet and support its functional objectives. Other models also include this factor[2,4,8-10,12]. If software doesn't meet its objectives, it may be delivered on time, but no-one will use it. The factors for the KQF set were chosen for their obvious importance, people tend to resist plans with many quality factors, due to limited resources or tight schedules. In fact the ISO/IEC 9126 model at the highest level uses six factors[13]. Based on previous research[14], the number of key factors should be kept between three and eight. The LDFs are not a replacement for the KQFs. Instead, they define additional quality criteria. No LDFs are explicitly provided with the ADEQUATE model, since each project may or may not have its own set of LDFs. Their identification and inclusion is entirely the responsibility of the Essential Views.
The relationship chart: The first step of the conflict removal mechanism is implemented by use of a Relationship Chart[2]. The chart displays graphically the relationships between quality criteria as a first stage towards measuring the criteria and provides the basis for constraints on what can be achieved. In the Relationship Chart, each criterion is listed horizontally and vertically. Where one criterion crosses another, the relationship between those criteria is specified. For KQFs, the relationships are fixed; they are standard. This is because the set of KQF criteria does not change, therefore the relationships between each KQF criterion does not change. Across different projects, however, different LDFs may be used. The Relationship Chart (Fig. 2), therefore, shows the relationships between each LDF criterion and each KQF criterion and also the relationships between each LDF criterion and each other LDF criterion. Given two quality criteria, Criterion A and Criterion B, the possible relationships between these two criteria are as follows : 1) Neutral: An improvement to the quality of Criterion A is unlikely to affect the quality of Criterion B. 2) Direct: An improvement to the quality of Criterion A is likely to cause an improvement to the quality of Criterion B. 3) Inverse: An improvement to the quality of Criterion A is likely to cause a degradation to the quality of Criterion B. By considering these relationships, checks can be made as to the feasibility of requirements. For example, users may state that a reliable product is required, that is both usable and maintainable. The relationships between Reliability and Maintainability and Maintainability and Usability are set to Neutral. Therefore, it is acceptable to state a requirement for a 482
J. Comp. Sci., 1 (4 ): 481-486, 2005
Fig. 2: The relationship chart reliable product that is also maintainable. Similarly, the relationship between Reliability and Usability is set to Direct so it is also acceptable to state that a product be reliable and usable. As a result, it is an acceptable requirement for a product to be reliable, usable and maintainable. However, now suppose the requirement is for a secure product that is easy to use and which can be modified easily in the future. The relationship between Security and Usability is set to Inverse. Similarly, the relationship between Security and Maintainability is set to Inverse. As a result, this requirement cannot be completely fulfilled.
over-engineered, since its actual quality value will be further advanced along the line than its required quality value. Figure 3 shows an example Polarity Profile used in the ADEQUATE approach, it is clear the weight of each factor is set according to a particular requirement. As can be seen, both Maintainability and Security have been over-engineered, since their actual quality values exceed their required quality values (The criteria Efficiency and Portability are LDFs that have been chosen by the Essential Views). The criteria listed in the Polarity Profile are the same criteria as listed in the Relationship Chart. Each organisation will use different metrics and metric approaches to measure different quality attributes. In order to identify the required quality for each criterion in the Polarity Profile, the properties of that criterion need to be measured using metrics. The same metrics should be used to identify the actual quality for that criterion. There is a need, therefore, for Conversion Mechanisms which convert the results of metrics used to measure the quality of a criterion, into a value that lies in the range 1 to 5, for displaying in the ADEQUATE Polarity Profile. For each relationship type in the Relationship Chart (Ie, Inverse, Direct and Neutral), a set of rules exist which directly set the allowable required quality values. Consider two quality criteria, Criterion A and Criterion B. Given these two criteria, the allowable required quality values in the Polarity Profile are determined using the following rules for a given relationship type specified in the Relationship Chart:
The polarity profile: The second step in producing a consensus view of quality, is to set the required goals for each criterion, based on the relationships identified in the Relationship Chart. However, there is a need to ensure that anyone can understand the graphical format chosen quickly and easily, particularly when it is considered that some essential views may belong to individuals with little technical background. There is also a need to illustrate over-engineered criteria (Ie, criteria that has exceeded its requirements), since further improvements in these areas will have little effect on the overall quality of the product. The solution chosen, therefore, is to use a Polarity Profile[2]. For each criterion, a range of values exists. The required quality of a criterion is defined as a single value on a horizontal line. The actual quality achieved is also defined as a single value on the same line. The advantage of using a Polarity Profile is that its format can be easily understood by anyone. Further, it is easy to determine whether or not a criterion has been 483
J. Comp. Sci., 1 (4 ): 481-486, 2005
Fig. 3: An example polarity profile 1) Neutral: No rules. 2) Direct: If Criterion A is greater than, or equal to the value 2, then Criterion B must be greater or equal to the value 2. 3) Inverse: Neither Criterion A nor Criterion B can be set to the value 3. If Criterion A is set to the value 4 or the value 5, then Criterion B cannot be set to a value greater than 2. If Criterion A is set to the value 1 or the value 2, then Criterion B cannot be set to a value smaller than 4. Only the required quality values are constrained by these rules. For each criterion, the Conversion Mechanism will probably be unique to each metric used. Since different organisations may use different metrics, no single Conversion Mechanism will be suitable in all cases.
Fig. 4: Calculation of the overall quality value Mechanisms may have been used, different Essential Views may exist and the Relationship Charts and Polarity Profiles will inevitably differ. Different methodologies, processes and resources may also have been used.
The quality formulas: Having considered both the Relationship Chart and the Polarity Profile it might be useful to produce a single value of quality which may be used to indicate the overall quality of a product in terms of its required versus actual values. This single value shows the overall quality of a product in terms of the percentage of quality requirements met. Given a Polarity Profile showing both required and actual quality values, Fig. 4 shows the formulas used to produce this single quality value. Note that, where a criterion has been over-engineered, the required quality value is used in place of the actual quality value when calculating the Overall actual quality score. In this way, an over-engineered criterion is prevented from cancelling out a poorly engineered criterion. The advantage of producing a single quality value for a product, is that it simplifies quality comparisons between products. But, caution should, of course, always be exercised when making such comparisons; Different Conversion
IMPLEMENTATION AND EVALUATION A software tool has been built to support the ADEQUATE approach which allows users to create and view Relationship Charts, Polarity Profiles and Overall Quality scores for a Product, Process or Resource. The tool also provides a Definitions Database, allowing storage and retrieval of criterion definitions. A Measurements Database is also included, allowing storing and retrieval of ADEQUATE measurements. The ADEQUATE approach has also been tested on a real project at a multi-national financial institution. The company uses a mainframe system to enable 484
J. Comp. Sci., 1 (4 ): 481-486, 2005
Fig. 5: Required values and actual values for the MIS handoff file was affected after implementation by the fact that not all the changes required had been successfully achieved. This was deemed a serious problem, hence the actual quality value was only set to 2. As a result, the Correctness score was affected in that the actual quality value was set to 4, whereas the required value had been set to 5. Security, however, was seen as improved since the file was no longer being passed through another external system. The required Quality value for Security was set to 2 and the actual quality value was set to 3. This improvement, therefore, resulted in Security being over-engineered. Timeliness met the quality requirements (required quality and actual quality values of 5), since the transfer of the handoff file no longer was delayed by being transferred through another external system. Both the required quality and actual quality values for Maintainability were set to 4. Maintainability quality had been achieved by the developers consciously commenting and documenting the code changes, partly because they were aware that the changes would be examined externally to determine the actual quality value for ADEQUATE. The required quality value for Reliability was set to 5, but the actual quality value was set to 4. The required quality value was not achieved because the first time that the amendments were executed, they failed due to incorrect batch coding by the systems operations staff. Once this had been corrected, the code ran through to completion but it was deemed that this failure should be reflected in the Polarity Profile. In view of these problems, the Cost/Benefit score was 3, falling short of its required quality value of 5. The Overall Quality score achieved was 83%.
on-line entering and viewing of financial movements across different sectors of the Stock Exchange, for customer accounts. An overnight batch run is performed that, amongst other things, updates account entries and generates reports on the days activities and a handoff file which is then transferred into an SQL based Management Information System (MIS). There were three major problems with the handoff process. The first was that, due to the design of the database structure, the MIS system was unable to handle duplicate records existing in the handoff file. The second problem was that the information transferred in the handoff file was insufficient to cater for the needs of the MIS users. Finally, due to historical reasons, the handoff file was being passed to another external system first, before it was passed on to the MIS system; An unnecessary delay. Three Essential Views were identified; The Support Manager (Who had overall responsibility for changes made to both the MIS system and the mainframe), the MIS Representative (The 'User', who also had overall responsibility for code changes made to the MIS system) and the Development Team Leader (Who had the responsibility for ensuring the implementation of the necessary code changes on the mainframe). All three Essential Views agreed that there was no need for additional quality criteria, so no LDFs were added to the Relationship Chart or Polarity Profile. After the necessary code changes had been made and the changes implemented in the live environment, the actual quality values for the Polarity Profile were recorded. Figure 5 shows the updated Polarity Profile screen from the ADEQUATE tool. As in Fig. 5, the Usability factor had a required quality value of 4, but 485
J. Comp. Sci., 1 (4 ): 481-486, 2005 completeness of this set. It is possible, for example, to expand the approach to incorporate the customer's views as to what properties should constitute the KQFs, as a majority Essential Views input. Moreover, a set of formal guidelines has yet to be finalised for identifying the Essential Views, despite their importance to the approach. It is hoped that, through wider use of the technique, comprehensive guidelines for Essential Views determination can be produced.
Applying the ADEQUATE approach to this project has shown that the technique clearly captured the quality requirements and quality delivered and effectively highlighted differences between different implementations of the project. The approach allowed the building of a matrix of individual software quality factors with clear visibility and individual weighting according to project requirements. The results have also highlighted and confirmed the impact of the relationships between the various quality factors, as well as the need to balance the requirements as well as the choices that have to be made. Essential views are considered and evaluated which lead to improvement in both individual software quality factors as well as the overall quality of the project.
REFERENCES 1. 2. 3.
CONCLUSIONS
4.
This study has presented a new quality measurement and quality assurance approach, at the heart of which is a set of quality factors divided into Key Quality Factors and Local Defined Factors. Unlike existing methodologies, both global and local quality factors can be integrated, individual quality views can be combined, view conflicts can be removed and an indication of overall quality can be determined. A key feature of the approach is Consistency; the method can be applied not only to Products, but also to the Processes and Resources used to create that Product. Thus, it is possible to model a whole organisation which is defined by the Products, Processes and Resources it uses and creates. This enables the approach to form an overall quality assurance framework. The model allows the specification of benchmarks against which achieved quality levels can be measured and provides guidance for building quality into software. The feasibility of quality goals is controlled by the use of a Relationship Chart and a Polarity Profile. Moreover, the ADEQUATE approach is not static; If project personnel changes occur, or project requirements change, the Relationship Charts and Polarity Profiles can be updated to reflect these changes. Although feedback from the use of the technique has been encouraging, there are a number of areas that require further investigation. The approach has been tested, but its scalability is uncertain and can only become clear after extensive use of the technique. The KQF set currently consists of seven attributes, but again further use of the model is required to determine the
5. 6. 7. 8. 9. 10. 11. 12. 13. 14.
15.
486
Offen, R. and R. Jeffery, 1997. Establishing software measurement. IEEE Software, pp: 45-53. Gillies, A.C., 1992. Software quality: Theory and management. Chapman and Hall, pp: 1-33. Kitchenham, B. and S.L. Pfleeger, 1996. Software quality: The elusive target. IEEE, Software, pp: 12-21. Boehm, B.W., J.R Brown, H. Kaspar, M. Lipow, G. MacLeod and M.J Merritt, 1978. Characteristics of software quality. North Holland. Manns, T. and M. Coleman, 1996. Software quality assurance. MacMillan Press Ltd., pp: 1-12. Matsumoto, Y. and Y. Ohno, 1989. Japanese perspectives in software engineering. AddisonWesley, pp: 279-301. Fenton, N., 1991. Software metrics: A rigorous approach. Chapman and Hall, pp: 42-62. Dromey, R.G., 1995. A model for software product quality. IEEE Transactions on Software Eng., 21: 146-162. Plant, R.T., 1991. Factors in software quality for knowledge based systems. Information and Software Technol., 33: 527-536. Kitchenham, B., 1987. Towards a constructive quality model. Software Eng. J., pp: 105-113. Elbert, C., 1997. The road to maturity: Navigating between craft and science. IEEE Software, pp: 77-82. Lindland, O.I, G. Sindre and A. Solvberg, 1994. Understanding quality in conceptual modeling. IEEE Software, pp: 42-49. ISO/IEC TR 9126: Software Engineering-Product quality, 19-12-2000. Miyoshi, T. and M. Azuma, 1993. An empirical study of evaluating software development environment quality. IEEE Transactions on Software Eng., 19: 425-435. Boehm, B., 1996. Identifying quality-requirement conflicts. IEEE Software, pp: 25-35.