similar in conception to management use of 'leading economic indicators', are ..... One or more compliance indicators are identified that are used directly to ...
Hydrobiologia 263: l-44, 0 1993 Kluwer Academic
1993. Publishers.
Printed
1
in Belgium
A proposed framework for developing indicators of ecosystem health John Cairns, Jr.*, Paul V. McCormick & B. R. Niederlehner University Center for Environmental and Hazardous Materials Studies, Virginia Polytechnic Institute and State University, Blacksburg, Virginia 24061-0415, USA (*author for oRprint requests) Received 23 April 1992; in revised form 27 October 1992; accepted 10 November
Key words: biological
indicator,
environmental
1992
health, linkages, socioeconomic
indicator
Abstract Considerations involved in developing a suite of indicators to monitor regional environmental health, similar in conception to management use of ‘leading economic indicators’, are described. Linkages between human activities and well being and the state of the environment are considered essential to the evaluation of general environmental health. Biogeochemical and socioeconomic indicators are mutually affected by environmental degradation and examples of both categories of indicators are described. Desirable properties in indicators of environmental health vary with their specific management use. Different indicators are called for when collecting data to assess the adequacy of the environment, monitor trends over time, provide early warning of environmental degradation, or diagnose the cause of an existing problem. Tradeoffs between desirable characteristics, costs, and quality of information are inevitable when choosing indicators for management use. Decisions about what information to collect for which purpose can be made more rationally when available indicators are characterized and matched to management goals.
Introduction As the complexity of human impact on the environment increases and ecological capital shrinks, the need to manage natural resources becomes increasingly critical. The nature of environmental impact has changed radically since the beginning of the industrial revolution, as exemplified by the increasing importance of regional (e.g., acid precipitation) and global (e.g., climate change) nonpoint sources of stress relative to point source discharges, the increasing number of potential stressors, and the importance of cumulative impacts. The focus of environmental protection has broadened from the development of stressspecific water quality standards to the achievement of broad objectives of restoring self-
maintaining ecosystems and maintenance of the quality of human life. These changes and the way society wishes to restore and protect the environment will require improvements in the effectiveness of environmental management strategies. There are two approaches to the evaluation of environmental degradation at the community and ecosystem level (Norton et al., 1988; Hunsaker & Carpenter, 1990). Directly assessing changes in communities and ecosystems in the natural environment, then subsequently diagnosing problems and causative agents is a ‘top-down’ method. Literature on biological monitoring illustrates this approach (e.g., Hellawell, 1978). In contrast, ‘bottom-up’ methods use laboratory data of effects on simple systems to model changes in the more complex natural ecosystem. Hazard assess-
2 ment protocols illustrate this approach (Cairns et al., 1978). Routine bottom-up procedures for estimating hazard (e.g., laboratory testing with human or ecosystem surrogates, models of fate and transport) are limited in their ability to predict impacts on natural ecosystems for several reasons (National Research Council, 198 1; Cairns, 1983, 1986a; Ryder & Edwards, 1985; Kimball & Levin, 1985) including: difficulties involved in the use of effects observed in the laboratory to predict responses in the natural environment; (b) difficulties involved in using the response of relatively simple biological test systems (e.g., single species laboratory bioassays) to predict effects on relatively complex systems (e.g., natural ecosystems); (cl use of protocols that consider the effect of each type of stress separately even though impacts are inevitably cumulative in the environment; (4 an inability to test all possible combinations of the thousands of chemicals in common use today (although tests of effluents as a whole ameliorate this problem).
(4
Natural ecosystems are complex, multivariate systems and are being simultaneously exposed to a multitude of stresses, the mechanisms and cu-
Pristine
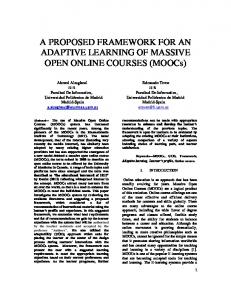
mulative effects of which are poorly understood. Thus, successful management of major ecosystems to achieve broad environmental and socioeconomic objectives is unlikely without a substantial broadening of the environmental assessment framework to encompass top-down ecosystem objectives. Periodic direct observation of the health of communities in their natural environment provides the opportunity to validate predictions of impact in the real world from bottom-up methods and provides mechanisms for implementing corrective actions into the management plan. This iterative process is described by the term biological monitoring, the ongoing assessment of environmental conditions to ensure that previously formulated objectives are being maintained (Fig. 1; Hellawell, 1978). Every measurable parameter has some value with regard to assessing environmental conditions. However, measuring every environmental variable or assimilating a large amount of information into the decision making process in an organized manner is impossible, environmental parameters or ‘indicators’ must be selected that are useful in judging the degree to which specified environmental conditions have been achieved or maintained. An indicator is ‘a characteristic of the environment that, when measured, quantities
Condition
/
Actual Recorded Condition
Maximum Achievable State
““~~~~=q5&2-: ‘\ /
Present Degraded State
Restoration N*.hpjectories -‘L Further Degradation
Chronological Fig. 1. Monitoring
Time the health of an ecosystem over time.
Minimum Acceptable State
3 the magnitude of stress, habitat characteristics, degree of exposure to the stressor, or degree of ecological response to the exposure’ (Hunsaker & Carpenter, 1990). The number of potential indicators is virtually infinite, and selection of the few ‘best’ indicators from this vast array is by no means a simple exercise. Indicator parameters serve several purposes in the context of environmental monitoring. Several disparate, and sometimes conflicting, considerations are involved in selecting the most appropriate indicators for a particular purpose. Above all, the selection process must be defensible. The importance of indicator selection cannot be overemphasized since any long-term monitoring program will only be as effective as the indicators chosen. The focus of this discussion is the development of an objective framework for selecting indicators of environmental health in the context of a longterm monitoring program. This framework is based on the ecosystem approach, first formalized by the Great Lakes Research Advisory Board (1978). This approach is conceptualized by the view of ‘man-within-the system’ as opposed to ‘the ecosystem-external-to-man.’ Since its inception, this view has evolved steadily towards a fundamental desire to promote compatibility between and sustainability of both ecological and human systems in one region (Great Lakes Water Quality Board, 1989). The proposed framework supports this emerging goal by addressing the development of both biogeochemical and socioeconomic indicators of environmental health and the linkages between them.
Relating indicator goals
development to management
Implementation of an effective monitoring program for any region is contingent upon the development of explicit, generally accepted ecosystem conditions to be achieved and maintained (i.e., ecosystem objectives). These objectives may be derived from descriptions of reference sites that represent the ‘natural’ or best attainable situation. These specified attributes are derived from policy
and management goals developed as a result of input from political, social, and scientific spheres (e.g., see Bertram & Reynoldson, 1991). Indicators are selected that are useful in judging the extent to which specific objectives have been achieved (e.g., that selected quality control parameters have remained within an acceptable range). Thus, indicators cannot be identified until goals and objectives are specified. Historically, policy and management goals relating to environmental protection have centered on reducing the level of pollution entering natural receiving systems. This ‘end-of-the-pipe’ focus is exemplified by the Great Lakes Water Quality Agreement of 1972 which established chemicalspecific objectives for reducing loadings and inlake concentrations of many known or suspected toxic substances and phosphorus, the primary eutrophying agent in the Great Lakes. Although this approach was successful at load reduction, many problems are inherent in the use of chemical and physical aspects of water quality as the sole yardstick of environmental health, perhaps the greatest of which is the inability to link changes in chemical emissions directly with changes in ecosystem health. Because the goal of environmental management efforts is to protect natural ecosystems and human health, ecosystem health must be defined in these terms as well. Recognizing the limitations of sole reliance on chemical-specific objectives, revisions of the Great Lakes Water Quality Agreement have increasingly emphasized a broader ‘ecosystem approach’ to managing the Great Lakes (e.g., Great Lakes Water Quality Agreement, 1978) one which recognizes the interrelatedness of biotic and abiotic ecosystem components (including humans) and the relationship between the Lakes and their surrounding watershed. This approach mandates the development of ecosystem as well as chemical-specific objectives, the former being clearly stated ecosystem conditions, primarily biological, that are to be attained and maintained under the revised Agreement. The principal goal of management derived from the ecosystem approach has been to restore and maintain ‘the chemical, physical, and biological
4 integrity of the Lakes and their surrounding basins so that beneficial uses are not impaired’. In keeping with this goal, objectives previously developed for Lakes Superior (Ryder & Edwards, 1985) and Erie (Edwards & Ryder, 1990) have focused on maintaining a balanced, stable oligatrophic and mesotrophic ecosystem, respectively. The development of indicators related to this objective has centered on the identification of surrogate organisms, species that integrate critical physical, chemical, and biological properties of the ecosystem and, thus, can be used to judge the relative health of the ecosystem. Key indicator species chosen for monitoring, the lake trout (Lake Superior) and the walleye (Lake Erie), were determined to be useful not only in gauging ecosystem health, due to their role as top predators in these ecosystems, but for judging potential impacts on human use as well due to their commercial importance. Management goals in the Great Lakes are currently undergoing further evolution as the ‘ecosystem approach’ to management merges with the concept of sustainable development (e.g., Great Lakes Water Quality Board, 1989; Bertram & Reynoldson, 199 1). Broadly defined, the concept of sustainable development encompasses ecological, economic, and social issues, all of which are interdependent but not necessarily compatible (Munn, 1990). The potential for conflicting goals associated with each of these aspects of sustainability demands that, from a management perspective, they be considered together. In view of the broad context of sustainable development, previous goals and objectives and, thus, the corresponding indicators developed for the Great Lakes appear to take too narrow a view of the system in at least two respects. First, little explicit recognition has been given in any of these programs to the broader social and economic issues of the region beyond those related to a few extremely important, but limited, activities (e.g., commercial fishing and human consumption of tainted fish). Second, consideration must be given to how humans view natural ecosystems beyond their use as economic and recreational resources. In particular, the development of an environmen-
tal ethic that promotes individual accountability and a realization of mankind’s common future will be critical to the achievement of sustainability. This second issue has begun to be addressed for the Great Lakes as of the adoption of ecosystem goals and objectives for Lake Ontario (Ecosystem Objectives Working Group, 1990). However, a critical step towards addressing the emerging goal of sustainable development will be adoption of a broad view of the concept of ‘manwithin-the-system’. Development of an indicator framework for supporting objectives proposed from this view is undoubtedly a critical emerging issue for managers. There are three important concepts with regard to the management of the Great Lakes region in terms of sustainable development (e.g., see Kerr, 1991; Munn, 1990): (1) Self-maintenance or self-sustainability of the ecological systems, which means that the Great Lakes ecosystems have sufficient integrity so that natural processes keep the quality conditions within an acceptable range through time, as expressed diagrammatically in Fig. 2. Self-maintenance is likely even though the ecological condition of the ecosystems is not ideal, i.e., identical to that prior to extensive human settlement. Indeed, in some respects the Lakes seem to have retained certain properties associated with selfmaintenance even in their worst state (Allen, 1990). This highlights the need to define and use the term ‘self-sustainable ecosystem’ cautiously when stating ecosystem objectives. (2) Sustained use of the ecosystem for economic or other societal purposes, which entails utilizing natural ecosystems for societal needs without degrading the resource. Sustained use is not possible if ecological capital is destroyed. Ecological capital might be the breeding stock of a commercially and recreationally valuable species such as the lake trout. Another form of ecological capital is the pool of genetic information that has evolved over many thousands of years to make the structure and function of the ecosystems what they are today or what they have been in the relatively recent past. Reduction in the ge-
5
I
Comparison to a Standard to Determine Compliance
+
+
Condition Sufficient
Condition Unacceptable 4
4
. -
I
Continue
to Monitor
Monitor
More
1
4 Problem Confirmed I 1 Diagnose
1
Causative
~~~ Monitor
Success
Intensely
Problem Transient
Agents
1
,
1
-
Fig. 2. Conceptual model of the trajectory of ecosystem condition during recent history. Several management strategies are currently in progress to restore the Great Lakes to some desirable set of conditions. While these efforts must meet some minimum acceptable set of criteria (i.e. chemical-specific and ecosystem objectives), progress towards a pre-disturbance condition is limited to some maximum achievable state by continued human impact.
netic pool through a loss of species richness may reduce the ability of the system to respond and adjust to future environmental changes, thus impairing the self-maintenance capabilities and efficient use of the resource. Sustained use may not necessarily require self-maintenance, even though the latter property is highly desirable since the subsidies necessary for sustained use may be exceedingly expensive otherwise. For example, if the natural breeding stock or habitat is lost, hatcheries may be necessary to replenish stocks of juvenile fish (and even sometimes adults) necessary for normal age recruitment and balance. (3) Sustained development to ensure human welfare, which includes not only medical issues relating to human health but to broader issues
concerning the potential for human development including the subjectively perceived quality of life. This latter group of issues is probably one of the least considered from a management perspective. The considerations given above suggest the general goals that must be envisioned in order to move towards a sustainable future for any region. A principal message in this discussion is that indicator development must proceed on a much broader scale than previously considered. Equally important is the fact that policy and management goals are not static; even if the concept of sustainable development is adopted, the basic vision of sustainability, as discussed above, will undoubtedly continue to change and be refined as society’s view of environmental management and
6 protection evolve further. In this respect, changes in management goals will require that monitoring programs and indicator development be subject to ongoing review to assess the ability of these efforts to support stated objectives. Thus, a requirement of any framework for indicator development is that it be flexible enough to accommodate such changes in policy or management goals. This includes a recognition not only of impact assessment and ecosystem rehabilitation but of impact anticipation and prevention as well.
Framework
for developing a monitoring
program
General rationale Once management goals have been specified, a framework must be developed for selecting indicators and utilizing the resulting information. Basically, everything is an indicator of something but nothing is an indicator of everything. Economic and ecological considerations limit the number of indicators that can be measured to only a fraction of those available. Given such limitations, indicators must be selected in order to maximize unique, relevant information and minimize redundant information. The purpose of an indicator framework should be to organize the process of indicator selection and development such that information is collected in a manner that is both cost-effective and best supports various management needs. The framework for indicator selection proposed here addresses three critical questions relating to ecosystem management: (1) are stated objectives being met? (2) if stated objectives are not being met, what is the cause of this noncompliance? (3) how can impending noncompliance be predicted before it is actually detected? To answer these questions, a monitoring program must fulfill multiple purposes. The first, most obvious, purpose is to provide an ongoing assessment of environmental conditions to determine if rehabilitation goals and objectives are being achieved and if, once established, these conditions are being maintained (Fig. 1; Hellawell,
1978). Previous work on indicator development has focused heavily on this aspect of ecosystem management, that is, the identification of ecosystem parameters and processes that are useful for judging compliance with general goals and specific ecosystem objectives (e.g., Ryder & Edwards, 1985; Edwards & Ryder, 1990; Bertram & Reynoldson, 1991). A second purpose of monitoring is to suggest corrective actions in the event that objectives are not being met. Demonstrating the cause of environmental impact is a much more difhcult task than merely observing that impact has occurred; in addition, no single diagnostic method is suitable in all situations. However, certain guidelines can be instructive. Gilbertson (1984) proposes a three step diagnostic process: (1) identification of environmental impact, (2) epidemiology, the process of determining the extent and nature of these effects and the formulation of causal hypotheses, (3) etiology, which involves experimentation with the suspected stressor and other stressors known to exhibit similar effects in order to reach conclusions regarding causation. These conclusions must be extensive enough to allow for formulation of rehabilitation strategies (e.g., remedial action plans) to correct the problem. Preferably, identification and diagnosis of a problem should occur early so that remedial actions can be taken before substantial damage has occurred. No single indicator fulfills all of the abovestated purposes. In order to foster a comprehensive and organized approach to management, we propose development of an indicator program based on three general types of indicators: compliance indicators, diagnostic indicators, and early warning indicators. Compliance indicators are those chosen to judge the attainment and maintenance of ecosystem objectives related to the restoration and maintenance of environmental quality. While measures of compliance with chemical-specific objectives, namely the concentrations of the regulated substances themselves, are quite clear, indicators most useful for judging the achievement of broad ecosystem objectives (e.g., self-sustaining food webs) are not nearly as obvious. The
7 most effective indicators of compliance with ecosystem objectives are those that integrate many characteristics related to the stated objective. The concept of the ‘integrator organism’ is discussed at length by Ryder & Edwards (1985); however, there are several reasons to consider other biological parameters (e.g., community and ecosystem attributes) as well for this purpose. Compliance indicators will be the most obvious part of any monitoring effort, and, thus, their significance should be readily communicable to the public and policymakers. Individual or population attributes of commercially and/or aesthetically important species (e.g., lake trout and bald eagle), for example, are useful as compliance indicators for this and other reasons. An example of a compliance indicator of economic condition might be the gross output of goods and services of a region. In many cases, those parameters most useful in judging compliance with a specified objective are not those best for determining why objectives are not being met. Causes of ecosystem deterioration are not always obvious or simple and, thus, may not be easily determined without an explicit protocol for addressing them. Diagnostic indicators, those parameters and processes that provide insight into the cause of noncompliance, should be identified to facilitate this process. To a limited extent, the number of probable causative agents can be narrowed by correlating noncompliance with trends in other ecosystem or chemicalspecific objectives. Information on changes in the quantity or quality of habitat or resources or the water column concentration of a toxic chemical, for example, may be correlated with changes in levels ofbiological indicators (e.g., changes in lake trout population dynamics). Investigation of such correlative relationships has been proposed for use in other monitoring programs including the Environmental Monitoring and Assessment Program (EMAP) currently under development by the U.S. Environmental Protection Agency (Hunsaker & Carpenter, 1990). Correlative relationships of this type are useful for hypothesis generation about potential causes, but do not alone provide strong evidence for cause-effect linkages, e.g., that which would warrant initiation of a
costly remededial action plan (RAP). The category of diagnostic indicators proposed here includes specific changes (e.g., enzyme changes induced by the bioaccumulation of a substance to toxic levels) that are capable of isolating specific stress effects on compliance indicators. Not all diagnostic information needs be gathered in situ; controlled laboratory and mesocosms testing to study etiology can be extremely useful in providing diagnostic information as well. Chemical fractionation of ambient water followed by toxicity testing often provides useful diagnostic information (e.g., Mount & Anderson-Carnahan, 1988). The use of compliance and diagnostic indicators together allows for reactive control when objectives fail to be met. Compliance indicators are used to judge that certain impacts have occurred or are continuing to hinder achievement of ecosystem objectives. An appropriate suite of diagnostic indicators is then used to isolate the cause. This type of control relies on rehabilitation of the deteriorated state and, thus, tends to be quite costly and time consuming. Furthermore, the success of such programs is often limited by a poor understanding of the functioning of ecosystems. Limitations associated with reactive management are exemplified by current problems associated with the development and implementation of RAPS for areas of concern (AOCs) in the Great Lakes (Great Lakes Water Quality Board, 1989). Persistent problems such as this have led to a call for predictive management programs within the region (Great Lakes Water Quality Board, 1989). The purpose of predictive management strategies is to identify impending problems before they exert substantial impact on the ecosystem. Compliance indicators will likely not be useful in this endeavor since these variables are chosen primarily to indicate the maintenance of some overt condition that, once lost, generally requires substantial effort to restore (e.g., lake trout population levels). It is quite conceivable that, in many instances, noncompliance with ecosystem objectives can be predicted on the basis of laboratory tests or certain subtle changes (e.g., enzyme activity in individual fish) that respond rapidly to stressful conditions and anticipate changes of so-
8 cietal interest. Identification and surveillance of these early warning indicators of ecosystem change allow for management actions to be implemented before conditions have deteriorated to the point where compliance indicators are affected. When used in conjunction with diagnostic indicators, early warning indicators allow for implementation of predictive management strategies. Given the poor understanding of how ecosystems function and, therefore, how to rehabilitate them, the additional cost of monitoring early warning indicators in addition to compliance indicators to allow for predictive management may likely be a cost-effective alternative to a sole reliance on reactive management. The overall indicator framework developed in this discussion is outlined in Figs 1 and 3. The strategy encompasses efforts both to restore conditions that have been impaired by previous stressors and prevent deterioration resulting from stressors that have yet to be identified and/or contained.
No monitoring program, no matter how comprehensive or costly, can reasonably be designed so as to be infallible. One of us (Cairns) has been involved in two efforts, the Pellston Series of Hazard Evaluation Workshops (Cairns et al., 1978) and the National Research Council Committee on Determining the Effects of Chemicals on Ecosystems (National Research Council, 1981), that attempted to work backwards from existing information to determine whether, with hindsight, it was possible to have predicted phenomena that had caused previous pollution problems of major consequence. The methyl mercury problem, for example, could have been predicted relatively easily if simple sediment-water microcosms had been included in the test protocol. Conversely, eggshell thinning in birds resulting from DDT could not have been predicted by any available test models and procedures. Of course, other illustrations can be found to support conclusions on both sides. Exercises such as this exemplify how certain ‘surprises’ in ecosystem
cioALs-h
Objective #I
Objective #2
. s l
.S
l
.
l
.
l
.
l
.
.
.
Objective
#X
Preemptive Management
Diagnostic
Indicators #l
3. General framework for indicator development. Generally acceptable goals are used to develop objectives. One or more compliance indicators are identified that are used directly to judge attainment desired condition stated in an ecosystem objective. Early warning indicators are chosen to assist condition by detecting impending deterioration before substantial impact has occurred. Diagnostic determining management required to fulfill objectives.
Fig.
a set of explicit ecosystem and maintenance of some in maintaining the desired indicators are essential for
9 management may be predicted and, thus, amenable to pre-emptive action while others may not be understood extensively enough so that preventative measures can reasonably be expected. A primary focus of any monitoring framework must be to minimize the consequences of inevitable inaccuracies and uncertainties involved in ecosystem management. These uncertainties may take two forms: (1) false negative signals, those that provide no warning of potential harm when, in fact, it is bound to occur, and (2) false positive signals, those that warn of potential harm when none in fact exists. Both are more likely to occur when too much reliance is placed on a single indicator or when the indicators selected leave large informational gaps in the overall hazard evaluation or risk analysis process. Clearly, multiple lines of evidence are more likely to protect against unpleasant surprises by allowing for the validation of presumed positives and negatives. In this regard, action levels, predetermined responses gauged to address the level of urgency given a certain indicator response, can be developed to achieve an optimal cost-benefit ratio. The basis for such a program is simple: if only one of several indicators related to a specific objective suggests impairment, then little or no action may be required, while consistent responses across several indicators may require an appropriately gauged response. The feasibility of implementing any monitoring program must realize two facts: (1) for any single indicator, the probability of detecting a false negative and false positive is inevitably opposed, and (2) even if multiple indicators are identified for all stated objectives, it is inevitable that unpleasant surprises will remain.
Criteria for indicator selection Literally thousands of indicators have been used in studying environmental quality. Sorting through all the potential indicators for the most valuable is a daunting and contentious task. Equally obvious is the fact that not everything can be measured. Instead, management decisions need to be made in a timely and cost-effective
manner even without complete information. Most assessment and monitoring projects ameliorate this problem by selecting a suite of indicators to meet specific needs. This process can be simplified and be more objective by defining the essential characteristics of an indicator for a specified purpose. Characteristics that are desirable in an indicator of environmental or water quality have been listed by various researchers (Suter, 1989; Macek et al., 1978; Hammons, 1981; Kerr 1990; Hunsaker & Carpenter, 1990). Ryder & Edwards (1985), Edwards & Ryder (1990), and Hellawell (1986) have developed similar lists specifically focusing on desirable characteristics of a species chosen as an indicator of water quality. Despite the diversity of management problems that inspired these lists, several characteristics are commonly mentioned. By paraphrasing, integrating, and supplementing previous compilations, we have arrived at the following list of ideal indicators: (1) Biologically relevant, i.e., important in maintaining a balanced community, (2) Socially relevant, i.e., of obvious value to and observable by shareholders or predictive of a measure that is, (3) Sensitive to stressors without an all or none response or extreme natural variability, (4) Broadly applicable to many stressors and sites, (5) Diagnostic of the particular stressor causing the problem, (6) Measurable, i.e., capable of being operationally defined and measured using a standard procedure with documented performance and low measurement error, (7) Interpretable, i.e., capable of distinguishing acceptable from unacceptable conditions in a scientifically and legally defensible way, (8) Cost-effective, i.e., inexpensive to measure, providing the maximum amount of information per unit effort, (9) Integrative, i.e., summarizing information from many unmeasured indicators, (10) Historical data are available to define nom-
10 inative variability, trends, and possibly acceptable and unacceptable conditions, (11) Anticipatory, i.e., capable of providing an indication of degradation before serious harm has occurred; early warning, of the ecosystem, (12) Nondestructive (13) Potential for continuity in measurement over time, (14) Of an appropriate scale to the management problem being addressed, (15) Not redundant with other measured indicators, i.e., providing unique information, (16) Timely, i.e., providing information quickly enough to initiate effective management action before unacceptable damage has occurred.
system that are valued less by the public and its representatives. Similarly, indicators that are good anticipators (indicator 11) are unlikely to be good integrators (indicator 9). A choice must be made between these characteristics. Differences in the ways indicators are used can guide the trade-offs necessary in selecting indicators along these gradients. Data are usually collected for one of five purposes:
Some of these characteristics summarize the background information necessary before an indicator is scientifically defensible, and, therefore, useful for more than exploratory research. All indicators in a designed plan of biological monitoring eventually need to be interpretable (indicator 7) and have documented sensitivity (indicator 3), standardized methods (indicator 6), minimum cost (indicator 8), and minimum disruption to the system in sampling (indicator 12). Historical data (indicator 10) are universally desirable to document natural variability or predisturbance condition. The standard by which acceptability is judged is often based on historical data. However, the mutually exclusive nature of some of the remaining characteristics is often overlooked. For example, a single indicator is quite unlikely to be both broadly applicable to many stressors (indicator 4) and able to indicate which specific stressor is causing the problem (indicator 5). Similarly, indicators that anticipate important damage and thereby provide the time to prevent that damage before the fact (indicator 11) are not going to be the most relevant and convincing indicators of environmental degradation (indicators 1 and 2). They inherently must precede the declines in important properties used to judge environmental adequacy and are typically smaller, quicker, and based on components of the
(3)
(1) Assessing (2)
(4)
(5)
current condition of the environment in order to judge its adequacy (i.e., a compliance indicator), Documenting trends in the condition over time, i.e., degradation or rehabilitation (i.e., a compliance indicator or sometimes an early warning indicator), Anticipating hazardous conditions before adverse impact in order to prevent damage before the fact (i.e., an early warning indicator), ldentifying causative agents in order to specify appropriate management action (i.e., a diagnostic indicator), and Demonstrating interdependence between indicators to make the assessment process more cost-effective and to reinforce political will to make environmentally sound management decisions (i.e., correlations between various indicators).
The interrelationships between these purposes and their sequence in time are described generally in Figs 1 and 3. The characteristics of indicators that are particularly important for each specified purpose are ranked in Table 1. Indicators for the assessment of current ecosystem condition and judgment of adequacy (compliance objectives) need high biological and social relevance in order to be effective at documenting the health of the environment in terms that are understandable to the shareholders. Readily understandable information will be most likely to encourage appropriate management action. These indicators also need to be readily interpretable so that measurement outcomes requiring management action are predetermined and scientifically justifiable. This may require that a historical data base is available to provide infor-
11 1. Desirable characteristics of indicators for different purposes. Table entries are on a scale of importance from 1 to 3, where 1 indicates lower importance and 3 indicates an essential attribute. Characteristics that are universally desirable and do not differ between purposes are marked with an asterisk. Table
Characteristic of indicator
Biologically relevant Socially relevant Sensitive Broadly applicate Diagnostic Measureable Interpretable Cost-effective Integrative Historical data Anticipatory Nondestructive Continuity Appropriate scale Lack of redundance Timeliness
Purpose of indicator Assessment
Trends
Early warning
Diagnostic
Linkages
3 3 *
3 3 *
2 2 *
2 2 *
2 2 *
2
2
2
1
1 *
1 *
1 *
3 *
3 *
3 *
2 *
2 *
2 *
1 *
1 *
1 *
3 *
2 * *
3 * *
1 * *
1 * 1 * 1 * 1 * *
1 1 * 1 *
2
2
3
3
mation on original condition and natural variability or that measurements on healthy, reference ecosystems have been made for comparison. Broad applicability to different stressors would permit standardization across areas of concern and increase the likelihood that an indicator would also reflect changes in environmental health due to new and unanticipated stressors. Indicators for the assessment of trends over time are used to document recovery in response to remedial action plans and to monitor ecosystem health over the long term. These indicators also need high biological and social relevance and broad applicability. In many cases, the same indicators are used for assessment and for trend monitoring. However, indicators for monitoring trends would ideally have additional characteristics. Lack of continuity, the ability to measure the same response over a long time period, compromises the ability to identify real changes in the ecosystem over time. For example, a lack of continuity due to changes in detection limits has complicated much of the interpretation of the levels of toxic substances. Reliance on a single species to monitor effects on lower trophic levels is also
2 * 2 *
1 * * 2
problematic in terms of continuity. If the species were replaced in the ecosystem by a functionally similar organism, the ecosystem could persist relatively unchanged, but trend monitoring would be compromised. In addition, historical information about natural variability over successional time frames may be important for indicators used in monitoring trends. Anticipation of unacceptable conditions before the fact is a special case of trend monitoring that focuses on prevention of an adverse effect. When an environmental effect is particularly undesirable, the choice should not be to wait for damage, document it, and remediate it. Instead, the damage should be avoided. When an indicator signal can precede significant damage, it is possible to preempt the damage through immediate intervention. The best indicators for early warning are usually quite different from those for assessment. While relevance is of paramount importance for assessment and continuity is important in most trend monitoring, timeliness is of paramount importance for anticipation of effects. The indicator must respond, be measured, be interpreted, and initiate management action in sufficient time to
12 head off significant damage. In demanding a quicker response to stressors and lead time before unacceptable effects, early warning indicators will be smaller, quicker, and of less immediate value to shareholders. Diagnostic indicators are used to isolate probable causative agents after a problem has been identified and prescribe appropriate management actions. Without a means of isolating the causative agent, management responses are unlikely to be efficient and cost-effective. Diagnostic indicators must single out causes rather than integrate them. They follow the general assessment of ecosystem condition and, in contrast to them, may be very site-specific and reductionist rather than broadly applicable. Linkages between the biogeochemical and socioeconomic spheres will most likely be demonstrated through correlation of appropriate indicators rather than through use of unique indicators. The establishment of strong relationships between these two areas may make a particular indicator more valuable, as its biological and social relevance will increase, as will its cost-effectiveness. The effects of human activity on ecosystems has been well documented over the years. However, the adverse effects of ecosystem degradation on human activity has been less documented and undervalued. By exploring relationships between biogeochemical indicators and socioeconomic indicators, the interconnectedness of humans within the ecosystem can be incorporated into the monitoring plan. The choice of indicators from the thousands available can proceed hierarchically. First, the indicator must be intimately related to management goals. The indicator should be logically related to the management decision (Suter, 1989) or closely related to another indicator that is. Because management goals embody current interpretations of social and biological relevance, the indicators resulting from close ties to management goals will be relevant. Second, the appropriate temporal and spatial scales of the end point will be dictated by the management goal. For example, if the goal is an early warning of human health effects, a quick response of a cellular receptor sampled on the
same scale as the drinking water supply might be called for. If, instead the goal is assessment of the state of free ranging sport fishery stock, a response integrating the entire life cycle of the receptor organism sampled across its habitat would be called for. Third, relatively few indicators are sufficiently developed to present no major methodological problems or challenges to their scientit% or legal defensibility at this time. However, some indicators are more defensible than others or more promising for future development.
Evaluating
available indicators
Indicator identification is based on the goals and objectives set for a particular ecosystem or region. This statement provides a broad interpretation of the term ‘indicator’. According to this scheme, for example, concentrations of toxic substances may be termed indicators (compliance) of the achievement of chemical-specific objectives. Indicators of ecosystem and human health are generally not so obvious, and, ultimately, selection of these will be based on the ecosystem objectives to be met. Recommendations discussed here are tentative, given that explicit ecosystem objectives are still being formulated, but they assume that future objectives will relate to broad environmental and social goals of sustainability. Physicochemical, biological, and socioeconomic (including human health) indicators are considered separately in this discussion. This categorization reflects traditional approaches to environmental monitoring. Physicochemical indicators
Changes in the concentration of both natural and xenobiotic chemicals have had a profound and, in many cases, well documented effect on ecological and human processes. Ecosystem subsidies resulting from the increased availability of nutrients (e.g., phosphorus) affect ecosystem operation by stimulating primary productivity, altering the taxonomic composition and food quality of primary consumers, and increasing community respiration
13 with concomitant reductions in oxygen levels. Loadings of toxic contaminants (e.g., PCB, PAH, and heavy metals) impair population-level processes (i.e., growth and reproduction), thereby altering community structure and ecosystem function. Chemical stressors elicit effects on humans both directly (e.g., drinking or swimming in contaminated water or breathing contaminated air) and indirectly through effects on other biota (e.g., eating contaminated fish or aesthetic problems such as noxious algal blooms). Adherence to specific chemical criteria is essential in order to improve water quality and, thus, biological conditions in an ecosystem. However, several problems limit the usefulness of this type of testing to judge compliance with ecosystem objectives (Wall & Hanmer, 1987): (1) it is impossible to monitor concentrations of all chemicals given cost and technological constraints, (2) all potentially toxic chemicals are not known, (3) knowledge of chemical concentrations in water does not always provide an accurate picture of biological availability, (4) chemicals may react synergistically and antagonistically with each other and with other environmental factors (e.g., hardness). The shift of the U.S. Environmental Protection Agency away from a sole reliance on chemical testing reflects these concerns (USEPA, 1985). In short, while a necessary part of any comprehensive monitoring program, routine chemical analyses are unreliable predictors of ecosystem health. In general, measurements of water quality conditions will only serve as useful early warning indicators in instances where a specific chemical culprit is suspected. The use of chemical parameters in this manner will be most useful at small spatial scales, such as point source discharges or, possibly, at AOCs where specific chemicals have been targeted and monitoring is being conducted with relatively high frequency. By the time toxic chemicals reach detectable concentrations at the basin wide level, substantial biological impact has probably already occurred. Measurements of water quality parameters that indicate changes in environmental conditions important to the biota (e.g., dissolved oxygen, pH,
conductivity, nutrients) will be similarly limited in their usefulness as early warning indicators of environmental change. In most cases, by the time changes in these conditions are detected, substantial insult to the ecosystem has already occurred. For example, by the time declines in oxygen concentrations occur in the hypolimnion of a lake, loading of stimulator-y substances has already occurred to the extent that several biological changes have already occurred (e.g., elevated primary productivity), and action at this point may not suffice to avert further damage (e.g., fish kills). Local changes in water quality may be useful in forecasting trends at larger spatial scales (e.g., basin wide) if sampling is properly designed and implemented. Use of data from AOCs would not be useful in this regard because changes in water quality due to site-specific remediation efforts would likely not be predictive of basin wide trends. While not always reliable in predicting biological responses, chemical measurements are essential for diagnosing the cause of changes in biological parameters. Field surveys documenting biological effects must be accompanied by evidence that a suspected chemical stress is present in the impacted location(s). Of course, such correlative information alone is inadequate for establishing a causal link; changes may be due to concomitant changes in the environment other than chemical pollution. The use of controlled testing, either laboratory or field, is required to establish such a cause-effect linkage. As with chemical indicators, changes in physical attributes of the ecosystem (e.g., water level and temperature, turbidity, sedimentation) will generally be most useful for diagnostic purposes. Habitat assessments (e.g., Plafkin et al., 1989) for example, are essential in evaluating causes for biological declines. Habitat parameters are selected that are related to overall aquatic life use. For benthic habitats, suitable measures might include bottom substrate composition and stability, presence of suitable cover or refugia, presence of spawning grounds, and degree of siltation. Assessments are compared to a ‘reference’ or ‘best attainable’ situation.
14 Because much of the change in chemistry and physical structure can be attributed to human activities, many systems have been developed to measure stress intensity by quantifying and summing classes of human activity that produce loadings to the system (Leonard & Orth, 1986; International Joint Commission [IJC], 1989; Hunsaker & Carpenter, 1990). Factors such as population density, miles of road, number of dwellings, point sources of discharge, use of pesticides, and land use changes (e.g., wetland loss, clearcutting) are included in these calculations.
Biological indicators
Biological responses tend to integrate the independent and interactive effects of many stressors, a property that makes them more robust indicators of ecosystem condition than the concentrations and loadings of individual chemicals. Indeed, only biological material can be used for indicating effects of chemical stressors in an ecosystem. Methodologies for the measurement of some chemicals discharged into surface waters are not well developed, and toxicological information is unavailable for many more. In the United States, these realities are reflected in a movement away from a sole reliance on chemicalspecific environmental monitoring to an approach that includes biological-based evaluations of hazard and environmental condition (USEPA, 1985; Wall & Hanmer, 1987; Hunsaker & Carpenter, 1990). Ecosystem objectives will undoubtedly require identification of biological parameters that can serve as key compliance indicators. Management efforts will be greatly aided by the identification of other biological parameters that can function as early warning and diagnostic indicators to complement compliance indicators for each of these objectives. Because some of the characteristics deemed desirable for different types of indicators are incompatible (see Table l), it is unlikely that any single measure will be ideal for all purposes.
Although the focus of this discussion on biological indicators is on field surveillance, the role of experimental bioassay techniques in future monitoring programs is first determined. Laboratory and field experimentation provides strong evidence for cause-effect linkages under conditions that are typically low in environmental realism. Field observation and monitoring allow for direct assessment of exposure and effects, although it is often difficult to establish cause-effect linkages. Analysis of in situ indicators of ecosystem condition is considered at two general classes of biological organization: (1) measurements performed on individuals or populations of specific target species and (2) measurements performed to assess community/ecosystem structure and function. Measurements of population, community, and ecosystem levels tend to be more appropriate compliance indicators for judging achievement of ecosystem objectives, which will likely tend to focus on issues such as the sustainability of target populations and the larger community. Conversely, measurements performed on individuals (e.g., enzyme analyses) will tend to be better diagnostic and early warning indicators. Stressors tend to impact biota at lower levels of biological organization (e.g., effects of persistent contaminants on biochemical and physiological processes of individuals), and subsequently impact parameters at higher levels (e.g., commercial fish yield) that are valued by society. Thus, a comprehensive monitoring program, for example the one proposed in Figs 1 and 3, will undoubtedly require the use of measures at several levels of biological organization. Finally, the utility of different biological measures must also involve a comparison of different taxonomic groups. In this discussion, the major taxonomic groups considered are operationally defined based on the types of databases available; for example, terms such as the zoobenthos refer to communities that encompass several taxonomitally distinct groups (e.g., annelids and arthropods) that, for the purposes of most applied research endeavors, are studied together.
15 The role of the bioassay
Several syntheses are already available that discuss the role of controlled laboratory and field experimentation in environmental assessment (Cairns, 1985, 1986b; Rand & Petrocelli, 1985; Cairns & Niederlehner, 1987; La Point et al., 1989; La Point & Perry, 1989; Cairns & Mount, 1990; C&C & Wells, 1991) and, therefore, details of their use are not repeated here. In short, a vast number of alternative experimental designs are available for conducting controlled tests, and the relative utility of specific designs varies greatly with the circumstances under which environmental assessments are made and the types of stressors being studied. Certainly, a sole reliance on bioassays for determining environmental management policies would be unwise. While bioassays vary greatly in their environmental realism (e.g., single species laboratory tests vs field mesocosms containing whole communities), any controlled study will defacto involve some departure from completely natural conditions. This reality alone dictates that experimental predictions be confirmed in the real world, although this is often not a simple proposition. Criticisms of this type have targeted the use of simple laboratory bioassays as the foundation of the ‘bottom-up’ view of environmental toxicology (e.g., National Research Council, 1981; Kimball & Levin, 1985). In the context of the present discussion, it is argued that laboratory and field bioassay can often be integral parts of diagnostic processes used to determine specific causes of observed or possible impending environmental impacts. Just as the control measures incorporated into experimental bioassay designs reduces the ability of these tests to predict potential environmental effects accurately (although conservative estimates of actual effects based on such predictions certainly aid in avoiding impact), the ability to test hypotheses directly regarding the causes and mechanisms of environmental impact enhances the utility of this element of hazard assessment and remediation. Laboratory and field bioassays are equally useful as diagnostic tools for the restoration of desirable ecosystem conditions and as predictive
tools for preventing environmental impact. Controlled experimentation is often an important element of efforts to rehabilitate sites impacted by anthropogenic stressors (Jordan et al., 1987; Cairns, 1988). Similarly, failure to achieve restoration goals and objectives will require that a diagnostic procedure be implemented to determine exactly why previous management strategies were ineffective and how future efforts should be refined. Finally, laboratory and field bioassays will continue to be the basis for predicting the potential hazard of recent or impending threats (e.g., unlicensed chemicals) to the environment. Bioassays vary greatly in their complexity, both in terms of the level of biological organization examined and the inclusion of realistic environmental conditions into their design. The single species bioassay (Rand & Petrocelli, 1985; C&e & Wells, 1991) remains the backbone of laboratory hazard evaluation procedures, despite certain inherent limitations (e.g., National Research Council, 1981; Kimball & Levin, 1985; Cairns & Niederlehner, 1987). The development of community- and ecosystem-level test procedures using controlled laboratory and field test systems (i.e., microcosms and mesocosms) offer an alternative or, in many cases, a complementary approach to single species bioassays (see compendiums such as Giesy, 1980; Cairns, 1985, 1986a). Traditional ‘bottom-up’ approaches to hazard assessment incorporate bioassays at various levels of complexity into specific tiers of testing. In contrast, ‘topdown’ approaches to diagnosis are largely ad hoc. However, while it remains difficult to describe generic protocols for such monitoring programs, the usefulness of such procedures is increasingly recognized. Measurements
on individuals and populations
The basis for measurements on individuals and populations is the selection of species that provide interpretable indications of changing environmental conditions. Measurements performed on these species may indicate exposure to a stressor (e.g., bioaccumulation) or effects resulting from exposure (e.g., increased incidence of carcinogenesis). Candidate indicators of environ-
16 mental stress considered within this broad category include:
(a)Biochemical e&c& at the cellular and lular level (e.g., enzyme induction); (b)Body burdens of chemicals in various of individuals sure;
used as an indicator
subceltissues of expo-
cc>Growth rate of individuals; (4 Carcinogenesis; (4 Teratogenesis and congenital defects; (f-9Susceptibility to disease; t!dBehavioral effects; 09Morphological changes in algal cells, etc.; (9 Feminization; ci>Abundance and biomass of individuals in the population; tk)Production or yield; (1)Natality and mortality; (m) Population age structure;
(n) Population size structure; (0) Number of breeding pairs; (p) Geographical range of population.
These parameters have been measured with different species and, obviously, not all of them are applicable to every taxonomic group. As discussed below, individual species or measures may be relatively sensitive to certain stressors and extremely insensitive to others. A suite of indicator species may be necessary to provide a comprehensive assessment of changes in ecosystem condition related to a multitude of important stressors. Species that are complementary in terms of their sensitivity to various stressors should be identified for this purpose. Changes in the biochemistry of individual organisms are the basis for many effects at higher levels of biological organization. Alterations in molecular structure (e.g., genetic effects), immunological responses, and enzymatic activity can subsequently exert significant effects on the growth and survival of individual organisms and, indirectly, on the dynamics of populations and communities. These ‘biomarkers’ are increasingly being recognized as powerful diagnostic and early warning indicators in environmental monitoring, and research in this area is proceeding at a rapid
rate (DiGiulio, 1989; McCarthy & Shugart, 1990). Stress-specific changes at this level are useful as diagnostic indicators. Generic responses to stress at the biochemical level that can be related to individual- and population-level effects can serve as useful early warning indicators of stress (i.e., named clinical indicators by Giesy et al., 1988). As stated previously, the rationale for expanding existing monitoring programs to include such early warning signals arise from the reality that it is easier (and less costly) to prevent impact than to attempt to restore after impact. Sublethal physiological and behavioral changes in individual organisms related to stress are the basis for many laboratory-based bioassay and monitoring protocols. Various attributes serve as response indicators of acute and chronic stress. Chemical burdens in tissues are frequently used as indicators of exposure. Changes in vital signs (e.g., respiratory rate) are extremely sensitive early warning indicators of stress for laboratory monitoring (e.g., on-line monitoring of effluent quality of Cairns & Gruber, 1980), but are not easily measured in the field. Although not as preemptive, outward signs of individual condition (e.g., disease or tumors) can be used for field assessments of the condition of larger organisms such as fish (Karr et al., 1986). Monitoring programs utilizing organismal responses have traditionally used selected fish and mammal species. More recently, tests using lower organisms (e.g., the Microtox assays of Dutka etal., 1983 that measure bacterial cell fluorescence) have also been shown to be useful hazard assessment and management tools. Measures of attributes of individual organisms may serve as compliance indicators (e.g., body burdens of toxic contaminants) or as diagnostic tools (e.g., teratogenic effects). Because organismal responses usually emanate from biochemical changes, the latter are generally more sensitive early warning indicators. Population-level parameters are commonly used as assessment end points in the laboratory and field setting to measure effects of stress. Measures of abundance and production may be useful compliance indicators both for commercially valuable species (e.g., maintenance of a certain
17 annual yield of lake trout) and nuisance species (e.g., maintenance of sea lamprey density below a certain level). Other measures are somewhat more diagnostic (e.g., estimates of reproduction and mortality or age structure). For species that have been extirpated from portions of the region as a result of deteriorated environmental conditions (e.g., bald eagle), the expansion of geographical distribution or changes in the number of breeding pairs may be useful as compliance indicators for gauging the success of management efforts related to certain restoration objectives. Although measurement of most indicators requires that formal monitoring programs be established, certain population-level indicators can be measured with public participation (e.g., Christmas bird counts to estimate changes in population size and geographical range of rare species). Terminal predators are the most widely supported candidate indicator species for assessing environmental conditions largely because of their susceptibility to persistent toxic contaminants, which are magnified as they move up through the biological food web and the commercial and aesthetic value placed on many such species. The three taxonomic groups that include top predators (fish, birds, and mammals) have different attributes that recommend for or against their use as indicators. For example, while wild mammals (e.g., mink) may be superior for predicting potential health consequences to humans, they are difficult to monitor because of their elusive habits. Predatory fish such as the lake trout are economically important but may be rather poor predictors of effects on humans. Using criteria similar to those proposed here, Ryder & Edwards (1985) recommended the lake trout as the optimal indicator species for measuring environmental conditions in oligotrophic (low productivity) ecosystems. Similarly, the walleye was chosen as the primary indicator for gauging the recovery of habitats that were historically mesotrophic (moderate productivity) (Edwards & Ryder, 1990). In addition to their position as top predators in the aquatic food chain, the suitability of these species is enhanced by a thorough understanding of their autecology and their abil-
ity to act as ‘integrator organisms’, one that reflects both direct and indirect effects of various environmental stressors (Ryder & Edwards, 1985). In recommending a single species for monitoring ecosystem conditions, it was recognized that no ‘ideal’ indicator organism exists. Companion indicators should be, therefore, chosen for both oligotrophic and mesotrophic conditions. The benthic amphipod Pontoporeia hoyi can be a suitable complementary oligotrophic indicator species to the lake trout; both its location within the ecosystem and its relative sensitivity to different types of stress are somewhat different from that of the lake trout (Ryder & Edwards, 1985). A second member of the zoobenthos, the insect Hexagenia limbata, can be a companion indicator to the walleye in mesotrophic habitats (Edwards & Ryder, 1990). Identification of indicator species for Lake Ontario has also focused on Hexagenia (Reynoldson et al., 1989). The above choices for indicator species appear generally sound. The selection of complementary indicators (i.e., those that integrate somewhat different aspects of environmental stress) is particularly useful. Given that individual species may differ substantially in their relative sensitivity to different types of stress (e.g., Patrick et al., 1968; Mayer & Ellersieck, 1986), additional species may be required to produce a monitoring program that is sufficiently robust to address broad ecosystem objectives, such as those currently under development for Lake Ontario (Bertram & Reynoldson, 1991). Given the environmental and toxicological complexity of conditions, it is doubtful whether one or two species will be sufficiently sensitive to all major impacts affecting complex ecosystems. For example, Friend & Rapport (1990) note that, while lake trout may be rather sensitive to the effects of toxic contaminants and eutrophication, it may not be particularly sensitive to stresses occurring primarily in nearshore areas (e.g., wetland fragmentation and loss) or in tributaries (e.g., acidification). Similarly, while Hexagenia appears to be quite responsive to changes in benthic oxygen concentration caused by eutrophication (Reynoldson et al., 1989) the
18
sensitivity of this species to other forms of environmental change is unclear. As with predatory fish such as the lake trout, a reasonably comprehensive database exists for a second set of terminal predators, fish-eating birds. The devastating effects of pollution, particularly persistent organic contaminants (e.g., organochlorine pesticides) on a number of avian species have been well documented (reviewed in Gilbertson, 1988; Peakall, 1988). Many useful measures of organismal and population stress have been proposed for species such as the herring gull. Population measures, such as geographical distribution and the number of active breeding pairs for more sensitive species (e.g., the bald eagle and the osprey) may serve as indicators of compliance with ecosystem objectives related to a ‘healthy’ ecosystem. The potential for public participation in certain monitoring activities (e.g., bird censuses) exist for this group, which generally rank well in terms of public appeal. A number of biochemical and physiological indicators of stress have been developed that serve diagnostic and early warning functions (e.g., Gilbertson, 1988; Peakah, 1988). The extent to which these species integrate the impacts of different forms of anthropogenic stress appears to be less than that purported for species such as lake trout. Indeed, while habitat fragmentation may have contributed to reductions in the abundance of certain bird species (e.g., Forster’s tern), the major stressor implicated in the decline of populations of piscivorous birds are organochlorine pesticides, which persist in several ecosystem compartments. Although this inordinant effect of one type of stressor may reduce the usefulness of piscivorous birds as general indicators of stress, it has the benefit of allowing for monitoring of the effects of one troublesome group of persistent contaminants. The herring gull has been the most intensively studied species with respect to the impact of pesticides on the Great Lakes. The usefulness of this species has been questioned for several reasons (Ryder & Edwards, 1985): (1) environmental tolerances too broad, (2) opportunistic feeding habits, (3) seasonal migration between the upper and lower Lakes, and (4) lack of standardization of
commonly used measures (e.g., reproductive success). These criticisms not withstanding, the herring gull appears to rank quite high as a candidate indicator species. The herring gull is a widely distributed terminal predator, and populations exhibit a year-round presence in the Lakes region (Gilman et al., 1979). The major reason for not fully considering the herring gull as a principal indicator appears to be related to the relatively broad tolerance of this species for various environmental factors (i.e., a eureycious species). However, while it is true that population-level parameters for this species may be somewhat insensitive to stress, a number of sensitive biomarkers and morphological effects have been developed and widely used, as described above. Unquestionably, there are advantages to using more stenoecious species, such as the bald eagle or the osprey, that engender more public concern than do gulls, and, certainly, monitoring the recovery of these two populations (e.g., number of breeding pairs, changes in geographical range) may be useful in assessing compliance with broad ecosystem objectives for maintaining indigenous populations. However, the extensive database available for the herring gull and the host of available measures of environmental effects makes this species immediately available as a monitoring tool in the Lakes region. Other candidate indicator species may exhibit selective sensitivities to other types of stresses. Fish-eating mammals such as mink, for example, appear to be particularly sensitive to polychlorinated biphenyls (PCBs), another class of toxic contaminants (e.g., Aulerich & Ringer, 1977; Harris, 1988). The phylogenetic similarity between these species and humans makes them potentially useful indicators for assessing human health as well as environmental effects. However, these species are typically rather difficult to monitor and, consequently, autecological and distributional information is somewhat sketchy as well. Sensitive indicators of PCB-induced stress (e.g., enzyme induction or other biochemical changes) are not well developed for these species (Fitchko, 1986). Thus, these species would become less useful as a monitor of PCB contamination since
19 concentrations of these substances in the environment decrease to levels where gross effects no longer occur, but biochemical effects may persist and concern should still exist. Populations of primary producers are an obvious choice for monitoring changes in the extent of eutrophication due to phosphorus loading into the Lakes since they are the biological interface between changes in phosphorus availability and ecosystem impacts. Algae are the dominant primary producers in the Great Lakes and, thus, occupy an important position in aquatic food webs. Although undoubtedly affected by toxic materials present in the Lakes, algal species have been influenced most strongly by changes in phosphorus loading in the Lakes following human settlement (Sicko-Goad & Stoermer, 1988). This makes them a particularly good set of indicators for tracking changes in phosphorus availability and nutrient limitation in the Lakes. The macroscopic chlorophyte Cladophora has been proposed as an indicator of phosphorus loading (Auer et al., 1982). The abundance of Cladophora in the Great Lakes has increased dramatically in response to increases in available phosphorus in nearshore areas, and prolific growths of this taxa can significantly impair beneficial uses in these areas (e.g., use of public beaches) (Auer et al., 1982). Species such as C. glomerata generally grow attached to the substrate, thus making them good integrators of local environmental conditions over time. Mean availability of phosphorus over long periods of time can be estimated from internal phosphorus concentrations (Auer et al., 1982). Simple measures such as area1 biomass are useful for quantifying point source phosphorus loadings, but must be performed rather frequently since substantial sloughing of algal growth may occur during storm events. Given certain methodological and specieslevel taxonomic difficulties, alternative species, such as epiphytic algae growing on Cladophora, may be more useful indicators if developed further (E. F. Stoermer, University of Michigan, personal communication). The U.S. Environmental Protection Agency has opted for a nontaxonomic measure of nutri-
ent availability and eutrophication in developing its Environmental Monitoring and Assessment Program (EMAP) (Hunsaker & Carpenter, 1990). This trophic state index (TSI) is based on measurements of chlorophyll a, water clarity (e.g., Secchi disk transparency), and total nitrogen and phosphorus in the water column. The advantage of this index as an indicator of eutrophication is that it is easy to measure. Measurements utilizing attached algal species such as Cladophora allow for more localized assessments of phosphorus availability, whereas measurements performed on the plankton are more appropriate for lakewide assessments. To some extent, therefore, these measurements may provide complementary information. Measurements such as chlorophyll a may be affected not only by bottom-up trophic effects caused by changes in phosphorus availability but by top-down (i.e., herbivory and predation intensity) effects as well. Changes in planktivorous fish abundance, for example, may affect chlorophyll a standing crop in the water column of lakes by altering the abundance and composition of herbivorous zooplankton assemblages (Carpenter et al., 1985). The introduction of the benthic exotic species, the zebra mussel, has been implicated in increased water clarity in Lake Erie (see Roberts, 1990), an influence which is unrelated to changes in phosphorus availability. In contrast, Cladophora is not used as a major food source by any organism. The relative efficacy of taxonomic and nontaxonomic indicators of eutrophication should be studied further. In addition to identifying species that provide good indications of changes in the intensity of different classes of stressors (e.g., organochlorines vs phosphorus), a second objective in selecting a suite of indicator species should be to identify species that utilize different habitats within the ecosystem and, thus, may provide habitat-specific indications of stressor exposure and effects. For example, bottom-feeding fish (e.g., the brown bullhead and the white sucker) can provide information on stressor intensity in benthic habitats (e.g., contaminated sediments) that would be complementary to information gathered from species such as lake trout that are pelagic for most
20 of their life cycle. Analysis of bottom-feeding fish may be especially important since sediments represent a sink for toxic substances (Delfino, 1979). Many other examples of habitat partitioning among species (e.g., phytoplankton vs periphytic algae) exist for commonly identified groups of indicator organisms. Diagnostic indicators have been used to implicate specific classes of chemicals and other stressors in observed environmental impacts. A suite of diagnostic indicators, including biochemical and physiological measurements, as well as field experiments (e.g., egg-swapping between impacted and unimpacted colonies) have been used to isolate the cause of observed individual- and population-level effects in fish-eating birds (e.g., Gilbertson, 1988; Peakall, 1988). Similar diagnostic tools are available for other indicator organisms; for example, measurements included in the dichotomous key for the lake trout (Ryder & Edwards, 1985) provide a degree of diagnostic capability. These tools should be developed for other indicator organisms, such as bottomfeeding fish species so that, in the event that objectives regarding the removal of stressor effects (e.g., elevated tumor incidence) are not achieved as a result of current remediation efforts, the cause can be isolated and modifications in management and restoration programs can be effected. Early warning indicators are available for measurement on several of the candidate indicator organisms discussed. Nonspecific sublethal early warning indicators of this type serve a dual purpose as sensitive companion indicators to compliance specific indicators: (1) to signal impending deterioration in environmental conditions and (2) to judge the need for continued remediation efforts after compliance indicators (e.g., population abundance) have achieved a level stated by an ecosystem objective. For example, the number of breeding pairs of bald eagles may recover to acceptable levels, but eggshell thinning may continue to be detected. Measurements on communities and ecosytems Historically, environmental monitoring efforts have focused on the identification and use of in-
dicator species to detect ecosystem deterioration. As already discussed, valuable information can be obtained through the measurement of various biochemical, physiological, organismal, and population parameters as the effects of specific (e.g., organochlorine pesticides) and more general forms of ecosystem degradation. However, several limitations occur in any monitoring program that relies solely on indicator species for monitoring environmental change.
(1) The
limited geographical and/or temporal distribution of many species limits their usefulness as environmental monitors to restricted areas, while communities of organisms are ubiquitous throughout the region and through time. Transferability of many community/ecosystem parameters across ecosystem boundaries facilitates their use as indicators that express changes at regional scales. Ecosystems typically exhibit a high degree of (2) functional redundancy such that effects observed on a few species do not necessarily translate into impacts on ecosystem operation (Hill & Wiegert, 1980). Thus, selected species previously targeted as indicator organisms serve several useful purposes in the context of a comprehensive monitoring program, but these indicators used by themselves may not be adequate for accurately assessing ecosystem integrity. performed on communities (3) Measurements and ecosystems consider the dynamics and responses of many constituent populations, facilitating more robust environmental monitoring, and should reduce the frequency of false negatives and positives, if properly applied. (4) Although societal concern over environmental degradation has traditionally focused on selected species of commercial or aesthetic importance, public concern over broader environmental issues (e.g., maintenance of biodiversity) is increasing. A community/ecosystem approach to environmental monitoring is not without drawbacks. The
21 very properties that enhance the robustness of these measures (i.e., the incorporation of many effects at the population and lower levels) inevitably reduce their diagnostic and, in some cases, early warning potential. Community and ecosystem responses to environmental stressors are complex and, in most cases, not well understood. Thus, advancement simultaneously toward specific objectives of ecosystem restoration projects in the short-term and broad goals related to a self-maintaining ecosystem in the long-term will undoubtedly involve simultaneous monitoring at many levels of biological organization to provide a clear picture of ecosystem condition. Selection of indicator populations and communities may be best viewed as complementary, rather than competing, tasks. Indicator species appear to be most effective at: (1) directly measuring progress towards the restoration and maintenance of populations that possess commercial and/or social value, and (2) tracking progress towards remediation of specific forms of environmental impact by identifying species known to be especially sensitive to individual stressors. In contrast, a community/ecosystem level approach to environmental monitoring provides a more robust assessment of ecosystem health in a region as it is impacted by the cumulative effects of many stressors ranging from persistent contaminants to the introduction of exotic species. Community structure The ecological community can be broadly defined as all the species present in a given habitat that have the potential to interact in some manner. However, the term ‘community’ is generally operationalized so as to encompass only those species of a particular taxonomic group of interest to the observer. This is not to say that taxonomically dissimilar species do not interact strongly (e.g., fish and zooplankton) but, rather, that available data are largely dictated by taxonomic considerations. Reasonably well studied ‘communities’ include fish, bird, zooplankton, zoobenthic, meiofauna, phytoplankton, and periphyton. Numerous measures of community structure
have been used as indicators of the response of natural ecosystems to anthropogenic stress, and no single measure enjoys unequivocal support as a consistently superior measure of ecosystem integrity. The seemingly vast array of available parameters used to define community structure generally encompass a limited number of structural attributes: (a) number of species, (b) relative abundance/dominance, (c) biomass, (d) guild structure, (e) size spectra, (f) foodweb (trophic) structure. The most basic parameter defining community structure is that of species diversity. This measure considers both the number of species present in a community (species richness) and their relative abundance (species evenness). Measurement of species diversity is one of the most commonly used parameters for assessing environmental condition. The ability to summarize information on species richness and evenness in a single value using a diversity index undoubtedly explains part of the appeal of these measures. Purported theoretical relationships between diversity and stability have led to a widespread belief that high species diversity is a property of healthy (i.e., stable) ecosystems and that decreases in diversity signal environmental deterioration and the loss of ecosystem integrity (Pontasch et al., 1989). In practice, several problems may limit the usefulness of routine diversity measures as indicators of ecosystem deterioration and recovery. A number of diversity indices have been proposed, and none has logical or practical primacy. Older indices (e.g., Shannon’s diversity; Margalef, 1958) continue to be used uncritically despite several recognized drawbacks (e.g., Hurlbert, 1971). A lack of clear selection criteria is problematic since different measures can be given substantially different indications of trends in diversity among communities at different locations (Hurlbert, 1971). Empirical evidence does not support a consistent relationship between diversity and environmental stress (Connell, 1978; Ward & Stanford, 1983; Stevenson, 1984). Thus, while changes in a diversity measure per se may provide an indication of changes in environmental quality, the measure provides no indication as to whether
22 conditions are improving or deteriorating. As elsewhere, diversity measures have been widely used as measures of community response to pollution. Results of laboratory and field studies (reviewed in Fitchko, 1986) repeatedly show that changes in diversity do not provide reliable indications of changes in the degree of ecosystem impact. Many alternative measures for summarizing species evenness (i.e., equitability indices) are also available, and their relative performance can differ greatly (e.g., Molinari, 1989). As with diversity indices, often no clear trend is found for this response in relation to toxic stress (Weber, 1973; Kraft & Sypniewski, 198 1). Consideration of species richness alone generally provides a more accurate assessment of stress related changes in natural communities than the use of diversity indices (Patrick, 1963; Cairns et al., 1988). Measurement of species richness is complicated for several reasons. It is inherently difficult to detect the presence of rare species for obvious reasons. Patrick and colleagues (1954), for example, estimated that a minimum of 8000 algal cells must be counted to estimate accurately the species richness of stream diatom communities; the time and taxonomic expertise required to obtain such information is, therefore, great relative to many other measures. Indeed, the taxonomy of many groups is not well known or requires laborious methods. Thus, although a potentially powerful measure of environmental stress, difficulties associated with the actual measurement of species richness make it impractical as a routinely monitored environmental indicator. Data collection requirements for the calculation of diversity or evenness indices are comparable to those needed to perform analyses of changes in the taxonomic composition of the community. Community comparisons based on taxonomic similarity, which consider the identities of species present as well their relative abundances, often provide a more powerful means of detecting patterns of community change than do measures of species diversity (Marshall & Mellinger, 1980; Pontasch etal., 1989). Because the identity of species is ignored in the calculation of
diversity indices, these measures are not sensitive to compensatory changes in the community, such as the replacement of one dominant species by another, which alter the taxonomic composition of the community but have little effect on community diversity. Such problems are corrected by the use of taxonomic similarity methods. Similarity methods are applicable both to the analysis of spatial and temporal trends in community structure. A second alternative to the diversity approach is a large class of measures that evaluate environmental conditions in terms of the relative abundance of sensitive and tolerant taxa in the community. These biotic indices require detailed information on the autecologies of individual species and, thus, are generally proposed as a result of intensive study of a particular watershed or region. The extent to which a given biotic index is transferable from one region to another will depend on several factors including the degree to which species in the community exhibit a cosmopolitan (i.e., global) distribution. This may explain the preponderance of such indices for microbial groups such as algae (e.g., Kolkwitz & Marsson, 1908; Pantle & Buck, 1955; LangeBertalot, 1979; Descy, 1979), since these organisms tend to exhibit a more widespread geographical distribution than most larger organisms. Biotic indices summarize the responses (i.e., presence or absence and, often, a semiquantitative measure of abundance) of several indicator species to stress to provide a single number that characterizes ecosystem condition. This approach, therefore, suffers from some of the same limitations inherent in the use of indicator organisms, particularly the fact that the relative tolerance of a species to stress varies with the type of stressor being applied (Cairns et al., 1972; Patrick, 1977; Sloof, 1983; Mayer & Ellersieck, 1986). Consequently, biotic indices are most feasible in areas that are impacted predominantly by one form of stress. Species have historically been classified with regard to their tolerance to organic enrichment (Kolkwitz & Marsson, 1908; Beck, 1955; Hilsenhoff, 1982). Attempts at classifying populations in a community with regard to their
23
tolerance to other types of stress have met with varying degrees of success (e.g., see review in Fitchko, 1986). Presently, no one type of index enjoys overwhelming appeal, and most groups currently used in this manner (e.g., oligochaetes) are used in reference to organic enrichment. The biomass or standing crop of a particular community is an extremely coarse indicator of community changes related to environmental stress, but may be useful in certain instances. For example, the yield of commercially valuable fish, for example, provide a good compliance indicator of success in achieving a self-sustaining fishery. Phytoplankton standing crop (e.g., chlorophyll a biomass) is used as a measure for assessing trophic conditions (e.g., Hunsaker & Carpenter, 1990). Biomass estimates alone rarely provide adequate information for assessing environmental conditions but may be useful as part of an integrated index (e.g., trophic state index). Analysis of changes in biotic size spectra has been proposed as a means of evaluating ecosystem condition (Kerr & Dickie, 1984). The basis for this measure is the observation that stable ecological assemblages exhibit a constant relationship between the size of individuals and their relative abundance in the community. Given that stressors tend to differentially impact larger organisms (Woodwell, 1967; Regier, 1979) increases in the intensity of stress should be manifested as a shift toward increasing dominance by smaller size classes within the community. Warwick (1986) found that macroinvertebrates in polluted marine systems shifted to numerical dominance by small species and less total biomass was contributed by large species. The Great Lakes fishery has seen a shift from dominance by larger, long-lived species (e.g., lake trout and walleye) to smaller, short-lived species (e.g., alewife and smelt) (Regier, 1979). Large diatoms were found to be more sensitive to PCBs than smaller planktonic algae in marine environments, resulting in a shift in community composition toward smaller size classes (Biggs et al., 1978; O’Connors et al., 1978). Such shifts may destabilize pelagic food chains by favoring shifts in zooplankton community composition (Fisher, 1975) and, possibly in
turn, the fish community. The zooplankton community in a mesotrophic lake shifted toward increasing dominance by smaller forms when exposed to the insecticide permethrin in limnocorrals (Kaushik et al., 1985). Shifts in the size spectra of a community can impact the dynamics of aquatic food webs (O’Connors et al., 1978) and, thus, may provide an important indication of ecosystem stability. Structural indicators discussed above are applicable to most commonly studied ecological communities. Available evidence does not unequivocally support the use of any one community as an indicator in all situations. As with the selection of indicator organisms, certain general principles apply when evaluating the usefulness of various communities as indicators of different aspects of ecosystem health. For example, communities that encompass populations with short generation times (e.g., microbial communities) can be expected to respond more rapidly to acute stress than those with longer generation times (e.g., fish). However, communities containing longer lived species are generally better at integrating longer term effects of certain types of stress (e.g., persistent contaminants). Communities containing species that fulfill several roles in the ecosystem (e.g., herbivores, predators, or scavengers) will likely be better integrators of different forms of stress, while those containing species performing very similar functions (e.g., phytoplankton communities) will generally be more diagnostic of a particular type of stress (e.g., phosphorus loading). Benthic (i.e., attached) communities are generally better indicators of local conditions, because of their sedentary nature, while planktonic communities may integrate conditions across larger spatial scales. Stressors vary greatly in their mode of impact on the ecosystem; for example, changes in phosphorus availability directly impact the algal and macrophyte communities, while overharvesting impacts the fish community. Although these initial impacts create several indirect effects on other organisms in the ecosystem, the timeframe for such effects to become noticeable may be much greater. These considerations illustrate certain inherent limita-
24 tions to the use of any single taxonomic or functional group of organisms for monitoring environmental conditions. Fish communities of the Great Lakes have been well studied and have been impacted by the cumulative effects of a variety of anthropogenic stressors, including the introduction of exotic species such as parasites (e.g., sea lamprey) and competitors (e.g., salmon [ Onchorhynchus spp.]), commercial exploitation, eutrophication, toxic contaminants, and loss of certain physical habitats (e.g., spawning grounds). The ecological and commercial importance of these communities enhance their usefulness as high profile compliance indicators. Many diagnostic and early warning indicators (e.g., physiological responses to stressors) are available to support assessments at the community level. As with any community, certain attributes of fish assemblages limit their usefulness in some instances. For example, the mobility of species within these communities may reduce their usefulness as indicators of change in local environmental conditions. However, this same attribute is advantageous for basin wide monitoring since it enhances the ability of these communities to integrate effects of stressors over large spatial scales. Many species utilize several different habitats within the ecosystem during the course of their life cycle, further enhancing their usefulness for basin wide monitoring. Given the ecological and social importance attached to these communities and the large amount of information available on their structure, they are certainly an essential part of a comprehensive monitoring program. Different taxonomic groups (e.g., insects) within the benthic invertebrate community, or the zoobenthos, have been proposed as useful indicators of the extent of anthropogenic impact and recovery. These communities are ubiquitous throughout the region and are an important component of benthic food webs, although their social relevance is generally rather low. These communities are typically sedentary and, thus, serve as useful indicators of local conditions, unlike far ranging taxa such as fish or plankton. Because of their location at the sediment-water interface,
these communities integrate effects of stressors in both ecosystem compartments. The life cycle of most invertebrates is such that anthropogenic impacts on community structure are integrated over reasonably long time periods (e.g., months). Standard sampling methods are available for adoption, and taxonomic delineations are reasonably stable. Attempts to compile a historical record of changes in this community have been hindered by problems including historical inconsistencies in sampling methodology and the timing of collections (Barton, 1989). Thus, while certain general trends are reasonably well documented (e.g., shifts from a Hexageniu ‘community’ to one dominated by oligochaetes), detailed patterns of spatial and temporal change are more difficult to document. Additional problems, many of which are related to the frequency, scheduling, and mode of sampling, are described in detail by Barton (1989). Benthic invertebrates have been used most successfully to evaluate impact associated with organic enrichment. In particular, many observed shifts in community structure have been attributed to the differential ability of component species to tolerate decreases in dissolved oxygen concentrations brought on by eutrophication (Jonasson, 1984). While invertebrate assemblages have been shown to be reasonably sensitive to other forms of stress (e.g., heavy metals) in the laboratory, data collected in situ in the Great Lakes and elsewhere do not provide clear evidence to document trends in these communities related to most stressors (e.g., see Fitchko, 1986). Thus, while the practice of using these communities to monitor the reversal of the process of eutrophication (e.g., Reynoldson et al., 1989) appears sound, the extent to which these communities integrate changes in other aspects of ecosystem health remains uncertain. Phytoplankton communities are arguably one of the most underutilized community-level indicators for evaluating long-term ecosystem change and the cumulative success of various restoration efforts. Some observed changes in phytoplankton community structure (e.g., species composition) are the direct result of increased inputs of phos-
2.5 phorus into ecosystems. However, other important environmental changes have been implicated as well, including a gradual increase in conservative ions (e.g., chloride) related to human activities (Stoermer, 1978) and, potentially, changes in the structure of higher trophic levels such as cascading effects (sensu Carpenter et al., 1985). Although algae exhibit acute sensitivities to toxic stress within the range of that observed for other organisms (e.g., Patrick et al., 1968), the effects of xenobiotic substances on the structure of phytoplankton communities are likely masked by other effects just described. Analysis of the remains (i.e., silica cell walls) of the siliceous phytoplankton assemblage (i.e. diatoms and chrysophytes) in sediments possibly provides the best available historical record of presettlement biological conditions and can be used to infer subsequent environmental changes. Paleoecological studies have related changes in the taxonomic composition of communities in the Great Lakes to cultural eutrophication as far back as the early 19th century (Stoermer et al., 1985a, b, 1987, 1990; Wolin et al., 1988). These investigations have identified several patterns of community change (e.g., biomass production, species composition) with increasing nutrient enrichment. The historical record may not be the ideal benchmark for gauging the success of ecosystem recovery. Total removal of human impacts on the ecosystem is rarely a feasible goal, and is often undesirable for some reason (e.g., continued harvesting of fish and other commercially important species). Theoretically, it is possible that a stable community structure quite unlike that which occurred under pristine conditions may arise as a result of reduced, albeit continuing, human impacts (May, 1977). However, since few suitable reference sites are available to serve as contemporary benchmarks of the ‘minimallyimpacted’ state of all the Lakes (with the possible exception of Lake Superior), the historical record appears to be the most feasible reference point. From a practical standpoint, monitoring of phytoplankton changes may be complicated by the relatively high taxonomic expertise required
for detailed community analyses. However, it is quite likely that certain simplifications in counting and analysis may be implemented without much loss of information. Detailed (e.g., annual) assessments of trends in phytoplankton community structure may be rather costly, given the need to control seasonal and stochastic fluctuations in community parameters in any such analysis. However, long-term (e.g., 5 year) environmental trends may be monitored in a relatively costeffective manner using phytoplankton assemblages. The potential for other communities in the Great Lakes to serve as indicators of ecosystem condition has not been as thoroughly explored as the three just discussed. The zooplankton community in the Lakes, like other communities, has undergone dramatic change in structure over the past several decades as a result of changes in phosphorus loading and the trophic composition of the fish assemblage (Kitchell et al., 1988). Introduction of the exotic cladoceran Bythotrephes is forecasted to exert potentially significant changes on this community as well (Scavia et al., 1988). These communities occupy an intermediate position in aquatic food chains and, thus, are strongly affected both by changes in nutrient loading, which alters the quantity and quality of algal resources (bottom-up control), and by changes in the intensity of fish predation (topdown control). Because these two effects, which may result from radically different management strategies (e.g., reducing phosphorus inputs vs implementing fish stocking programs), can elicit similar changes in the zooplankton community, it may be somewhat difficult to attribute shifts in zooplankton community structure to a particular management effort (Gannon & Stemberger, 1978). The effect of toxic substances on the structure of Great Lakes zooplankton communities is still poorly understood (Evans & McNaught, 1988). Nearshore periphytic (i.e., attached) algal communities may be superior to phytoplankton communities for assessing changes in local environmental conditions related to lake trophic status. Deep-water algal communities may be
26 useful for lakewide monitoring partly because of a lack of strong seasonal successional patterns (Kingston et al., 1983). The utility of using data from zooplankton, periphyton, or other communities to indicate changes in ecosystem condition should continue to be reviewed as research proceeds with a focus on the degree to which their use might surpass present monitoring efforts. Analysis of food web dynamics provides a means of integrating various observed direct and indirect impacts of stressors on different communities into a broader management perspective. Food web dynamics are the basis for most aspects of ecosystem operation and, thus, can be directly related to ecosystem integrity (e.g., selfmaintenance). The consequences of anthropogenie effects on food webs do not stop at the waterline, as evidenced by impacts on fish-eating birds (e.g., Gilbertson, 1988), effects of fish consumption on human health (Jacobson et al., 1984), and economic effects of fluctuations in commercial fish yield. Perhaps most importantly, an understanding of previous, present, and possible future trophic interactions seems necessary to help ensure that evolving management programs succeed in achieving and maintaining stable ecosystem operation. Models of food web dynamics are being increasingly used as a predictive tool for ecosystem management. These models are used to forecast the consequences of changes in one biotic compartment (e.g., piscivorous fish) on other organisms in the larger lake community. This type of analysis has several applications to environmental management, ranging from the consequences of overharvesting a particular fish species or declines in top predators resulting from contaminants to the accidental or planned introduction of a new species into the ecosystem (e.g., Cohen, 1989; Fontaine & Stewart, 1990). Continued developments in the analysis of food web dynamics facilitates the development and simulation of alternative management strategies for biota and for investigations of linkages between exposure in one ecosystem compartment and potential effects in others.
Community/ecosystem function Ecosystem functional processes (e.g., productivity, decomposition) have been widely advocated as important indicators of ecosystem stability or ‘homeostasis’ (Van Voris et al., 1980; Bormann, 1983; Odum, 1985; Rapport et al., 1985). Odum (1985), for example, predicts several functional responses to stress that signal imbalance in the ecosystem, including increased maintenance costs (elevated rate of respiration per unit biomass) and an imbalance in the ratio of production to respiration, which should be equal in a stable system. The question as to whether ecosystem structure or function is more sensitive to stress may be answered differently depending on the ecosystem under study. Studies of forest ecosystems generally concur in their conclusion that functional changes (e.g., increased loss of nutrients and decreased rates of decomposition and primary productivity) provide an early indication of the onset of ecosystem stress than do structural changes (e.g., shifts in species composition). Just the opposite may be true in aquatic ecosystems, where unicellular algae are the dominant primary producers. In his work in the Experimental Lakes Area, Schindler (1987) found changes in ecosystem structure (i.e., algal species composition) to be a much more sensitive indicator of ecosystem stress, in this case increased acidity, than comparable functional indicators (i.e., ecosystem primary productivity). Ecosystem functions mediated by microbes in particular may adapt and recover quite rapidly following the onset of stress. Recovery of algal productivity in marine mesocosms exposed to copper occurred concurrently with a shift in taxonomic composition from copper-sensitive to copper-resistant taxa (Thomas et al., 1977). Bacterial assemblages exhibit conferred resistance to certain toxic substances (Pfister et al., 1970; Szczepanik-van Leeuwen & Penrose, 1983), which may result in a recovery of functional activity following exposure. Thus, the relative performance of structural and functional indicators of stress appear dependent on the ecosystem and organisms under study. Decisions regarding the use of structural vs functional indicators of ecosystem condition must
21
also be based on the goals and objectives of ecosystem management programs. Specific structural goals (e.g., fisheries management) are obviously important. While broader objectives, such as the restoration of self-maintaining ecosystems, can generally be framed both in structural and functional terms, little empirical and historical evidence is available for specifying a level of function that indicates achievement of such a goal In practice, measurements of functional attributes tend to be costly and prone to sampling error (Cairns & Pratt, 1986; Levine, 1989). Understanding ecosystem operation is still far from complete, and it will be quite difficult to develop ecosystem objectives and indicators based on functional attributes of the ecosystem. An alternative means of monitoring ecosystem processes is to infer changes in functional processes from shifts in community structure. For example, Cairns & Pratt (1986) suggest the analysis of microbial (prokaryote and eukaryote) community composition as an alternative to functional measures since most of the mass and energy passing through an ecosystem are affected either directly or indirectly by the activity of this biological component. Landscape ecology
There is increasing interest in the discipline of landscape ecology and its application to environmental management. This science seeks to understand relationships between spatial patterns and ecosystem processes. The Great Lakes Basin is a complex ecosystem exhibiting environmental heterogeneity over several spatial as well as temporal scales, and it is likely that different processes, including various anthropogenic impacts, are important at each scale. Methodologies under development to study landscape mosaics and identify important spatial scales (i.e., patches) may increase the understanding of how systems operate and respond to anthropogenic stress (e.g., Wessman, 1990). Although the discipline of landscape ecology is still in its infancy, certain developing principles may apply to ecosystem monitoring and management. Karr (1991), for example, proposed mea-
sures of patch geometry, habitat fragmentation, and linkages among patches as candidate indicators. Changes in the size, arrangement, and isolation of ecologically important habitats (e.g., spawning grounds or wetlands) can have important effects on population and ecosystem processes. Changes in the geometry of adjacent habitats will affect the flow of organisms and material across their boundaries and alter the amount of edge habitat (i.e., ecotones) available for various species. The relationship between such analyses and policy issues such as regional and local development is obvious, Thus, while continued research will be necessary to develop this discipline for practical use, future contributions to ecosystem management seem imminent. Integrated
measures of ecosystem health
Several candidate indicators of ecosystem health exist at different levels of biological organization for gauging the recovery and maintenance of ecosystem health. Evaluation of the relative performance of different indicators shows that no single measure is consistently superior to all others. Given inevitable limitations to the use of any single indicator to monitoring ecosystem conditions, various attempts have been made to combine a suite of biological indicators into a robust index of ecosystem health or integrity. Use of an integrated measure of ecosystem condition is advantageous since deficiencies in the indicator ability of any one parameter should not invalidate the overall assessment. Development of an index that is sensitive to several different types of stressors would be beneficial given the complexity of environmental impacts. Integrated indices that reduce information from several measures into a single value are advantageous from a decision making standpoint, although assumptions involved in this approach (e.g., weighing the importance of individual measures in the index) are problematic (Friend & Rapport, 1990). Other integrated measures of ecosystem condition do not attempt data reduction but utilize the same criteria for selecting a suite of measures for simultaneous consideration. In particular, measures are generally chosen that provide complementary in-
28 formation regarding environmental effects and are not redundant in terms of information content. Indices of biotic integrity (IBI) are increasingly being used to assess and monitor ecosystem health in the United States using fish and macroinvertebrate communities (Karr et al., 1986; Davis & Lubin, 1989; Plafkin et al., 1989). Several parameters, referred to as metrics, are selected that reflect individual, population, community, and ecosystem attributes. Three basic types of metrics have generally been used to assess ecosystem health using fish communities; these include species richness and composition including indicator taxa; trophic composition (proportion of species in different feeding groups); and the overall abundance and condition (e.g., proportion diseased or with tumors). Macroinvertebrate IBIS are typically based on taxon richness of various orders, proportional abundance of various taxa, percentage of ‘tolerant’ species in the community, and the dominance of different feeding groups (e.g., shredders w filter-feeders) in the community. These categories do not encompass all classes of candidate biological indicators discussed here, and an index of this type might include additional parameters and exclude some of those just listed. Several candidate indicators may be chosen for initial analysis at selected locations based on previous information regarding their relationship to unimpaired ecosystem operation and their sensitivity and response to environmental stress. Redundancy analysis (Kaesler et al., 1974) can then be used to assess the extent to which each candidate indicator provides unique information about changes in ecosystem condition. These results can be used to reduce the number of indicators in the final index. IBIS constructed for one region usually require modification for use elsewhere as a result of differences in species composition and ecosystem functional attributes. The final suite of metrics (i.e., indicators) is used to monitor changes in ecosystem condition. Individual metrics are scored based on the degree of similarity between values measured at a site of interest and that for some nominal state. Usually, the nominal state is defined as the present day
minimally impacted condition (i.e., reference sites), although historical information or quantitative ecosystem objectives (e.g., proportional or absolute abundance of Hexagenia in the benthic assemblage) could conceivably be used. For example, a particular metric (e.g., total species richness) may be assigned a score of 1,3, or 5 points, corresponding to an increasingly ‘healthy’ condition relative to some reference measure. Metric scores are summed to provide a single number that, when compared to the desired condition, represents the degree of impact at a particular location, Indices of biotic integrity have been primarily applied to streams and rivers, although the concept is certainly applicable to other ecosystems as well. Indices of this type would have to be tailored for each unique ecosystem. The IBI approach is not without certain limitations. Steedman & Regier (1990) note that, in aggregated form, the index has little or no diagnostic value and lacks any theoretical underpinning. However, they also note that individual indicator parameters that comprise such an index do relate to important ecosystem properties and can provide insight as to the cause of ecosystem stress. In terms of the framework proposed in this discussion, measures incorporated into an IBI would be supported by more detailed diagnostic indicators to aid in identifying the cause of impact. Concern has also been raised over the lack of an objective means for weighting the various parameters used to construct an index such as the IBI (Friend & Rapport, 1990). In constructing a macroinvertebrate IBI (the Invertebrate Community Index) for the state of Ohio, Davis & Lubin (1989) used principal components analysis as a statistical means of providing weightings for individual metrics. The Ecosystem Distress Syndrome (EDS) (Rapport et al., 1985) defines ecosystem stress in terms of a host of parameters, including changes in community size-spectra, species richness, species composition to favor opportunistic or tolerant species, the incidence of disease, population stability (e.g., ‘blooms’ or outbreaks), and the degree of bioaccumulation of contaminants. Like
29
the IBI, several indicators are selected that together are capable of providing a robust assessment of ecosystem condition, again in reference to some desirable state. Unlike the IBI, the EDS makes no attempt to construct an agglomerative index from these various measures. The harmonic community concept developed by Ryder & Kerr (1978) offers an integrated approach to the use of fish communities for assessing ecosystem integrity. This approach views the fish community (and, indeed, the larger lake community) as an evolutionary entity structured by a variety of species interactions of varying complexity and strength (e.g., parasitism, niche separation). Several properties of harmonic communities have been identified (Ryder & Kerr, 1990) and operationalized in terms of measurable parameters, such as niche complementary among component species, population dynamics, particle-size density, and specific trophic interactions. These authors note, however, that, as with the EDS just discussed, component parameters have yet to be synthesized in the form of a single ‘index of ecosystem integrity’ in a manner similar to the index of biotic integrity. Ultimately, the successful development of integrated measures of ecosystem health will depend on the elucidation of measurable properties related to ecosystem integrity. Recent efforts toward such a system with respect to the Great Lakes (e.g., Edwards & Regier, 1990) are notable and should serve as a foundation for future advancements.
Socioeconomic indicators
The connections between the condition of the natural environment and human well-being have become less immediate and obvious in the past century. The people of the Great Lakes region no longer experience mass mortality from typhoid or starvation from crop or catch failures. In absence of these gross reminders that people are a part of, and dependent on, their natural environments, we are left with more subtle evidence of the connections. Local restrictions on fish consumption or
swimming; questions about long-term health effects from contaminated food, air, or water; daily frustration with appearance and odor of the local environment; and questions about the sustainability of industries harvesting natural resources all remain. From the many indicators developed to follow social and economic trends, a few are closely linked to the state of the natural environment and will be sensitive to degradation in that part of the environment. These indicators of linkage between humans and the non-human components of their environment can assess not only the effects of human activity on the environment but also the effects of environmental degradation on human well-being. They provide evidence for the social and political relevance of ecosystem objectives that lack a human face. By documenting the linkages between ecosystem health and human well-being, the societal will to protect ecosystem health despite costs can be reinforced. Socioeconomic indicators provide information useful to policymakers; for example, are we meeting specific management goals for sustainability and protection of human health and well-being, what are the risks and financial and environmental values of different human activities, and what is the contribution of the natural environment to regional wealth. Responses that link the socioeconomic health of the Great Lakes Basin to ecosystem health can be divided into three broad categories. Environmental quality must be sufficient to maintain (a) human health, (b) reasonable human uses of resources, and (c) favorable public perception of the quality of life and the environment. This discussion focuses on responses to environmental degradation (impacts) and not on documentation of the sources of that degradation (inputs) that is considered below. When any indicator used for assessment or trend monitoring, either biological or socioeconomic, suggests that conditions are unacceptable, diagnosis must follow (Fig. 1). Correlations between impact indicators, exposure indicators, and input indicators will provide the evidence for linkage between environmental degradation and impairment of socioeconomic functions.
30 Human health To the great majority of people, protection of human health is the most important possible goal of environmental management. No goal has higher social relevance. Polls have shown that people are unwilling to accept even minimal additional risks to human health as a consequence of environmental degradation from industrial activity, and the majority of people profess a willingness to pay more for products in order to reduce such risks (Gallup, 1990; Harris, 1990; Bird & Rapport, 1986). Even with this apparent commitment to the goal of preventing human health effects from environmental degradation, there are serious problems in designing an effective program to monitor human health effects. Gross effects of pollution are always much easier to detect than subtle, rare, or long-term effects. Fortunately, gross effects on human health are rare in present times. It is the subtle, rare, or long-term effects that must be monitored, and detecting these effects with certainty is difficult. Study designs and possible end points are outlined in Table 2. Study designs vary in social relevance and interpretability, with epidemiological studies being most relevant but least interpretable and studies with surrogate species most interpretable but least relevant. Categories of indicators that can be monitored in any study design cover all organ systems and all stages of disease progression. Indicators of impact range from the most relevant measures of fully developed disease to quicker, cellular or behavioral measures of stress that may be useful as early warnings. The spatial scale of the study will be dictated by the probable route of exposure. Exposure through drinking water dictates a local spatial scale. Exposure through consumption of open water fish dictates a lakewide spatial scale. Several investigators have addressed the factors contributing to uncertainty in determining human health effects of a degraded environment (IJC, 1986, 1990; Colborn, 1990). Uncertainty results from the ethical imperative that studies with humans are correlative, not experimental. Studies with humans typically encompass multiple causative agents, not all related to the envi-
Table 2. Potential indicators of the response of human health to environmental degradation.
A. Study designs - Assessment approaches with different receptor organisms 1. Epidemiological studies on exposed human populations (see Marsh & Caplan, 1987) a. Environmental studies b. Case control studies c. Cohort studies 2. Studies on sentinel species of exposed feral animals (see Gilbertson, 1988; Colburn, 1990) a. Mammals: minks, voles b. Birds: herring gulls, Foster’s terns, eagles c. Fish: spottail shiners, brown bullhead 3. Studies on surrogate species of exposed laboratory animals (see Lave et al., 1988) a. Mammals: mice, rats b. Nonmammalian systems: tissue culture, bacteria (Ames assays), planaria, hydra, water fleas, frogs, fathead minnows B. Categories of indicators 1. Neurotoxicity (see Caplan & Marsh, 1987) a. in vivo - regional incidence rates for multiple sclerosis, Parkinsons, amyotrophic lateral sclerosis - behavioral assays: infant cognitive function, speech, gait, visual disturbance, headaches, memory function - biomarkers: biopsy and histopathology, visualevoked response, electroencephalogram postron emission tomography, CAT scan, electromyography b. in vitro - cell culture excitability, synaptic potential, repetitive firing properties, nerve conduction velocity 2. Reproductive toxicity (see Caplan & Marsh, 1987) in vivo - regional
incidence rates for birth defects, infertility, miscarriage, stillbirth, birth weight - biomarkers: sister chromatid exchanges, sperm counts, motility, and morphological abnormality 3. Carcenogenicity / Mutagenicity / Genotoxicity (see Sandu & Lower, 1987; Wang et al., 1987; Colburn, 1990; Caplan & Marsh, 1987) a. in vivo - regional incidence rates - biomarkers: DNA adducts, sister chromatid exchange, DNA unwinding, histopathology b. in vitro - histopathology of tissue cultures - Ames mutagenicity tests 4. Cardiovascular disease in vivo - regional
incidence rates
31 Table 2. (Continued) 5. Immunocompetency in vivo
- blood cell counts
ronment (e.g., adults in a study population sometimes smoke cigarettes). Consequently, conclusions about causality linking environmental agents to human health effects are weakened. To address this concern, designed experiments with surrogate species can be used, but the direct applicability of animal data to human health consequences is debated (Lave et al., 1988). It is also difficult to detect the long-term effects of environmental degradation on human health in a timely manner, yet early warning in time to prevent human health consequences is clearly desirable. In order to provide information in a timely manner, it is necessary to rely on indicators that occur early in the progression of disease, before the fully developed adverse effect occurs. These indicators are usually small, quick, and relatively unimportant in and of themselves. Ames testing of drinking water, reproductive health of feral sentinel animals, and physiological biomarkers in exposed human populations are promising early warning indicators of human health effects. However, their effectiveness as assessment or compliance indicators depends on the establishment of a clear relationship between these indicators and ones with more obvious biological and social relevance. Epidemiological studies of exposed human populations provide the most convincing evidence of human health effects. These studies have very high social relevance, but they often lack interpretability, timeliness, or generality across stressors. The level of effort, cost, and conclusiveness of epidemiological studies varies with design (Marsh & Caplan, 1987). Ecological studies correlate disease incidence (from registries) with general measures of exposure on a gross scale (e.g., Page et al., 1976) and are less costly and conclusive. Retrospective case-control studies are more easily interpreted and intermediate in cost. Cohort studies (e.g., Fein et al., 1984) are more costly
and more conclusive but still fall short of establishing a cause-effect relationship. There is background data on human health effects of environmental degradation of the Great Lakes Basin, but results are equivocal (see reviews by Flint, 1991; Colborn, 1990; IJC, 1990; Fitchko, 1986). A chemical specific analysis indicates some cause for concern because chemicals that are individually toxic in laboratory tests with surrogate species are detected in the Great Lakes environment. However, there is less direct evidence for human health effects, linking observed impairments in human health to existing environmental degradation. Of the three major routes of human exposure, drinking water, fish consumption, and aerosols, fish eating is generally thought to present the greatest exposure and risk. The most direct evidence for adverse human health effects from environmental pollution is found in a series of studies linking PCB exposure through consumption of contaminated fish to human health effects. Infants of mothers consuming fish from the Great Lakes were smaller than controls (Fein et al., 1984). Such infants also had behavior deficits (Jacobsen et al., 1984) and impaired visual recognition, an indicator related to future intellectual functioning (Jacobsen & Jacobsen, 1988). However, no adverse health effects were clearly related to PCB exposure in fish eating adults (Humphrey, 1988). Replicating and continuing these types of epidemiological studies provide the most relevant and convincing evidence of the status of human health. However, to be used as a monitor of environmental condition, such studies would need to maintain a broad focus in order to include possible effects from stressors other than PCBs and new stressors. Some evidence shows that cognitive function in infants is sensitive to a range of toxic substances and may be a general indicator (Jacobsen & Jacobsen, 1988). An early warning capacity is also desirable and may be found in the use of biomarkers subclinical indications of a future adverse effect. In contrast to the paucity of direct evidence of adverse effects on human health, an abundance of evidence is available that relates health effects on feral species to environmental degradation in the
32 Great Lakes (see reviews by Colburn, 1990; Gilbertson, 1988). In addition to their intrinsic value, these species may well be effective sentinels for assessment of human health effects like the canary in the coal mine. Studies of feral populations have good biological relevance, and some social relevance. Because of differences in the ways even closely related species respond to the same chemical, uncertainty exists in predictions of human health effects from observations on sentinel species. However, because studies on sentinel species can be more manipulative than is possible when studying humans, they may be more interpretable. When the life cycle of the organism is short, they have the capacity to be anticipatory for human health effects. They are less costly than laboratory toxicity tests on similar surrogate species. They integrate the effects of simultaneous and sequential exposure to many different pollutants found in the environment. The utility of feral populations as sentinels for human health effects would be improved by studies linking exposure biomarkers (e.g., tissue concentrations or induction of relevant enzymes such as MFO) and health effects in the sentinel species (both subclinical biomarkers such as sister chromatid exchange and full blown impairments such as birth defects) to the same indicators in exposed human populations. Some of these linkages have been made. For example, tissue concentrations of PCBs in feral fish and humans have been compared (Hallett, 1986). By establishing these relationships, the social relevance and early warning capability of biomarkers would be vastly improved. Most assessments of human health effects of environmental pollution have been made using surrogate species. Commonly, a laboratory test exposes a laboratory population of a surrogate species such as mice to a single chemical. Doseresponse relationships are determined and used to establish safe concentrations and standards. Because of the many problems in extrapolating from data on response to a single chemical to response to a complex mixture of chemicals, the biological relevance of such tests is not high (Vouk et al., 1987). Ambient toxicity tests, which test the
complex mixture as it occurs in the environment directly, avoid this problem. However, problems with the high cost of tests and great uncertainty due to variability in response even across closely related species remain (Lave et al., 1988). So, despite the widespread reliance on surrogate species tests to set standards for protecting human health, the scientific community has doubts about their biological and social relevance, their cost-effectiveness, their sensitivity, and their interpretability. In studies with humans, sentinels, and surrogates, many indicators of health can be assessed (Table 2). These indicators vary across organ systems, across disease progression, and across levels of the biological hierarchy from subcellular to whole organism. The whole organism, fully developed clinical indicators (e.g., cancer mortalities), are more relevant and interpretable but less timely than the subcellular biomarkers or bacterial surrogate indicators (mutagenicity tests). It is necessary to firmly establish the relationships between biomarkers and future clinical expression of disease before biomarkers can be considered sufficient evidence for regulatory action. The monitoring of human health effects from environmental degradation is clearly one in which current scientific methods are not yet adequate to the task mandated by the public will. Because of the importance of the objective to the public, management action may be encouraged despite considerable uncertainty. However, that same uncertainty comprises the legal defensibility of the indicators and increases the likelihood of legal challenges to proposed management actions. Effort devoted to further development of promising methods is justified. Reasonable human use
In the development of economic theory, water, air, soil, feral plants, and animals of good quality have been traditionally thought of as free and inexhaustible and, as such, without value. However, the supply can be exhausted and the quality impaired despite technological advances; consequently, the conception of these elements as common environmental capital has replaced the
33 earlier notion. Attempts have been made to incorporate this common environmental capital into existing economic instruments that guide policymaking (e.g., environmental impact analysis, cost-benefit analysis, decision analysis; Jansen, 1991; Maguire, 1988; OECD, 1982; Seneca, 1987; Wise, 1988). However, because most environmental goods and services are not traded on the open market, assigning values to these elements has been difficult (Jansen, 1991; Nijkamp & Soeteman, 1988; OECD, 1989). Monetary approaches persist despite this difficulty because monetary units provide a means of weighting disparate elements of the environment and economy in order to link them. It has been suggested that bringing environmental considerations into existing economic instruments is doomed to failure because this approach retains the traditional view of man as master of the natural world, resulting in a persistent and entrenched undervaluation of ecological attributes (Stewart, 1987).This approach must be replaced with an economic model based on the premise that humans are a part of the environment and not separate from it. Integrated environmental-economic models have been developed (e.g., spatial economic-environmental models, environmental evaluation models, inputoutput models, dynamic stock-flow models, and materials balance models), but most focus on inputs rather than impacts and ignore ecological processes. In addition, practical applications on a regional scale are lacking (see review by Nijkamp & Soeteman, 1988). Progress in establishing the linkages between environmental health and economic consequences is being made on a more limited scale. Work towards a natural resources accounting system (NRA) in Canada (Friend & Rapport, 1990; Bird & Rapport, 1986) and certain methods developed for policymaking techniques such as decision analysis (Maguire, 1988) or environmental impact assessment provide examples of ways in which biological and socioeconomic data can be integrated. These examples point to several types of economic monitoring that would contribute to environmental quality control and environ-
mental policy decisions. First, because sustainability is a specified goal in and of itself, monitoring stocks, harvesting rate, and recruitment rate for environmental goods will allow evaluation of whether the goal of sustainability is being met. Sustainability would also require that environmental services, including recreation and aesthetics, be maintained. Monitoring success in achieving the goal of sustainability does not require translation into monetary terms. In addition, the interpretability of data is facilitated by the clear statement of the goal. Conditions are unacceptable if stock size is depleted, if harvesting exceeds recruitment, and if aesthetics or recreational utility decline. Second, it would be useful to document the current and future contributions of environmental goods and services to regional wealth. This represents the common environmental capital that is risked through poor stewardship. Translation of environmental goods, services, and management costs into monetary terms is necessary in this case. This background data would be useful to decision makers, but there are many methodological problems. Major categories of human use that are probable objects of protection are listed in Table 3 with examples of potential indicators. Indicators include monetary estimates: actual market values, shadow prices, and contingent valuation (willingness-to-pay or adequate compensation for loss estimates). Non-monetary estimates include: stocks and flows in terms of quality, and human preferences. The usefulness of these potential indicators vary widely. Common problems include lack of any historical data base, lack of consistency or reliability in valuation methods, lack of consistency in data collection methods by jurisdictions, problems in interpretation of changes due to large variations, and lack of logical standards of acceptability. Various categories of use may be redundant. For example, commercial and recreational fisheries are likely to improve or decline together. As the relationship between indicators is established, redundancy could be eliminated. Also probable is that certain categories of use will be relatively insensitive to changes in environ-
34 Table 3. Potential indicators of the response of human use to environmental degradation.
A. Commercial Fisheries (see Bird & Rapport, 1986) 1. Quantity - stock, harvesting, recruitment estimates 2. Quality - pretense of prefered species - restrictions on consumption - incidence of tainting, deformities 3. Valuation - shadow pricing; farm reared vs feral fish - employment and payroll 4. Management costs - stocking - lamprey control B. Drinking water (see Wentworth et al., 1. Quantity - stock, withdrawal, replenishment 2. Quality - treatment costs - chemical and bacterial standard - restrictions on consumption - reported acute illness - user satisfaction* 3. Valuation - contingent valuation; willingness pensation for damage* 4. Management costs - treatment costs
1986) estimates
violations
to pay and com-
C. Recreation (see Hunsaker & Carpenter, 1990; Lichtkopper & Hushak, 1989) 1. Quantity - visit counts: sport fishing, swimming, boating, birdwatching, bird-hunting - boat registration - marina and beach counts - marina vacancy rates 2. Quality - incidence of fish consumption restrictions - incidence of contact sport restrictions - incidence of fish deformities or tainting - catch per unit effort 3. Valuation - employment and payroll - marina sales - admission fees - shadow valuation; pool construction vs beach use 4. Management costs - stocking D. Industrial, energy, and agricultural water use 1. Quantity - stock, withdrawal, replenishment rates
Table
3. (Continued)
2. Quality - productivity, crop, livestock losses attributable water quality problems - costs of pre-use treatment; descaling, defouling 3. Valuation - compensation for loss of use - increased product cost due to degradation 4. Management costs - costs of post-use treatment
to
E. Aesthetics 1. Quantity - subjective satisfaction* - miles of shoreline in parks 2. Quality - incidence of objectionable odor * - incidence of turbidity - incidence of algal blooms 3. Valuation - shadow valuation; water-view vs interior real estate - contingent valuation; willingness to pay and compensation for loss* 4. Management costs - landscape planning F. Transportation water use 1. Quantity - water levels 2. Quality 3. Valuation - employment and payroll 4. Management costs - income lost due to restrictions on dredging - costs of disposal for contaminated dredge spoils - costs of pollution controls - costs of control of nuisance growths; macrophytes, zebra mussels G. Support of general economic well-being of region - traditional economic indicators (GNP, unemployment, income class distribution, etc.) H. Future uses (genetic pool for pharmaceuticals, genetic engineering, temperature buffer in global warming) * Subjective evaluations dependent on survey of shareholders.
mental quality. For example, water-borne transportation may not be greatly affected by small changes in environmental quality. In addition, indicators of the general economic well-being of the region will probably be largely determined by factors other than environmental health, and, as
35 such, relatively insensitive to environmental degradation until it is severe. Information on human use may be collected at several spatial scales. Drinking water monitoring must be local, as are aesthetics and most recreational uses. However, commercial fisheries use is more appropriate for monitoring a larger area. Only a few use indicators are diagnostic or anticipatory. As always, trend monitoring can provide early warning by identifying small but consistent downward trends. Initial attempts to monitor sustainability of human use may rely heavily on the best existing data bases and avoid the problems inherent in valuation of environmental assets until methods are more reliable. Information on commercial fisheries is available (Bird & Rapport, 1986). Data on lake trout and walleye populations provide direct overlap between biological and socioeconomic indicators. This data will track the utility of open-water quality. Data on recreational use are also available (U.S. Department of Interior, 1989 as cited by Hunsaker & Carpenter, 1990; Lichtkopper 8z Hushak, 1989) and will track near-shore water quality. Additional use categories will require new efforts toward quantification, but, eventually, an inclusive accounting of natural resources in all use categories is desirable. Methodological problems with valuation methods must be resolved if the overall contribution of environmental goods and services to regional wealth is to be monitored. Studies to determine correlations between different valuation methods and rankings of the acceptance of values by shareholders and decision makers would help clarify acceptable methods. Perceptions of environmental quality and quality of life It is important to distinguish between the assessment of environmental condition, which is an objective process, and the assessment of environmental quality, which is the subjective perception of an individual of the adequacy of the environment. It is the perception of environmental quality that will determine the shareholder’s satisfaction with management efforts. Bird & Rapport
(1986) point out two ways that perceptions can then affect the quality of the environment. Individuals can jointly bring pressure to bear that will change environmental policy in both public and private sectors. In addition, individual actions (recycling, car-pooling, source reduction, etc.) are an important part of environmental stewardship. To the extent that these attitudes are communicable, an ethic supporting sustainability is fostered. Periodic interviews of shareholders can provide data useful in several areas of policymaking and management. First, overall satisfaction with environmental quality can be assessed and used to provide feedback on the success of environmental management and its importance to the shareholder’s quality of life (Milbrath, 1978). Second, perceptions of importance of environmental goods and services are largely subjective. Monetary valuation of these assets for a complete natural resources accounting can be estimated from shareholder interviews to determine willingness to pay or compensate for damage (Jansen, 1991). Relative importance may change in response to perceived environmental quality and economic well-being, recent publicity about environmental disasters, etc. Similar non-monetary rankings of aesthetic and ecological values must also rely on public input (Maguire, 1988). Third, acceptance of risk from environmental degradation may vary from one impact to the next and among groups of people. Policymaking tools often ignore differences in risk aversion. Interviews can assess which categories of impacts the shareholders are willing to risk for economic benefit and which risks are unacceptable regardless of benefit. Fourth, interviews of shareholders also serve as a measure of effectiveness of communication on environmental issues. Interviews can determine shareholder awareness of environmental problems, the source of their information, and their awareness of available forums for participating in management decisions (Bird & Rapport, 1986). Fifth, level of participation in environmental protection activities can also be assessed (e.g., membership in sporting or conservation groups, attendance at policymaking forums, energy con-
36 servation, carpooling, recycling, etc.; Gallup, 1990). Although interviews of shareholders and a focus on subjective well-being have been used in social impact assessment for environmental impact analysis and in cross-cultural comparisons, they have not been used as a monitoring or assessment tool. Questions on attitudes to the environment are included in polls by Harris, Gallup, and the Centre de Recherche sur l’opinion Publique, but because there is no consistency in phrasing and order of questions, this data cannot be used to assess trends over time (Bird & Rapport, 1986). A standardized instrument is necessary for monitoring purposes. An instrument for determining perceived environmental quality and subjective well-being have been devised and tested in the Great Lakes Basin (Milbrath, 1978). This example of an instrument for measuring perceptions of environmental quality includes assessments of satisfaction and importance of both man-made and natural environmental attributes focusing particularly on water quality. It has a community-level focus, the level at which environmental concerns have the most importance (Bird & Rapport, 1986). A similar instrument specifically designed for monitoring trends over time rather than differences between populations and focusing on the environmental quality of the Great Lakes region could be devised (Eyles, 1990; Craik & Zube, 1976). Background data would be required to develop and validate the instrument and to define variability in response over time before it would be useful for monitoring trends. The social relevance of perceived environmental quality and quality of life is unquestionably high. Perceptions of the environment will be sensitive to factors other than environmental change, such as economic well-being, and may be insensitive to some types of environmental degradation. However, because sustaining shareholder satisfaction in and of itself is important, the data collected can be interpreted and used to improve management efforts. Linking subjective perceptions of environmental quality to the objective determinations of sci-
entists is an important subsequent step. When the objective and subjective assessments of environmental quality agree that environmental quality is sufficient, management techniques are vindicated. If objective and subjective assessments reach different conclusions, action is required. More effective communication of problems and risks to the general public, reformulation of goals more in line with shareholder interest, or reordering of priorities for addressing existing problems may be called for. There is a corollary benefit to the acquisition of this data. In the process of responding to the interview, shareholders become participants in the process. The act of interviewing constitutes an outreach activity and can promote education about problems and simple changes in behavior. Interviews can foster stewardship in this way.
Conclusions
and recommendations
This discussion adopts a broad perspective for developing indicators of ecosystem health that can be incorporated into developing monitoring programs. Continued evolution of monitoring programs should be anticipated for several reasons:
(4 the
relative concern over various types of human impact will change as current restoration activities succeed in their goals and new forms of impact are identified and quantified; results of continued basic research and surveillance programs will undoubtedly modify the suite of parameters deemed most useful for evaluating ecosystem health; ecosystem goals and objectives will continue to be developed and refined to meet the broad and changing demands and expectations of various shareholders.
(b)
cc>
In order to preserve continuity in the face of inevitable change, a comprehensive framework for developing and implementing ecosystem indicators, such as that proposed here, should be adopted.
31 Based on we provide mendations ronmental ment.
analyses contained in this discussion, several general and specific recomregarding future directions of envimonitoring and indicator develop-
Formulation of broadpolicy and management goals and explicit ecosystem objectives
Ecosystem monitoring is a costly, yet necessary, proposition. The effectiveness of monitoring programs based on a suite of ecosystem indicators is contingent upon the development of specific ecosystem objectives for ecosystem restoration and maintenance, or, restated, one must know what to protect before it can be protected. Identification of the most appropriate ecosystem indicators for various purposes will ultimately be determined by the types of objectives formulated. While individual ecosystem objectives must be precise in terms of the end point to be achieved, the overall policy and management goals must be broad enough to consider the interdependence between humans and the rest of the environment. Thus, regional goals must consider not only the health of ecological systems but the health, welfare, and activities (both detrimental and constructive) of humans as well. Integration protection
of environmental
restoration and
Those charged with ecosystem management currently face the principal task of implementing restoration and rehabilitation efforts at various spatial and temporal scales. Given the number of problems already identified, the necessity of framing monitoring programs around such efforts is obvious. However, other problems have undoubtedly gone unrecognized or may be impending. Therefore, monitoring programs must also be designed to identify emerging problems in a region and suggest preventative measures to avert future impacts. Long-term protection of environmental resources will be best assured by implementation of pre-emptive as well as reactive management strategies. The framework proposed here allows for the integration of reactive and predictive management
strategies into an integrated monitoring program. Three basic types of indicators are required to perform the various functions required of a comprehensive monitoring program: (a) compliance indicators, those measurements that can be used to judge whether a stated ecosystem objective has been achieved; (b) diagnostic indicators, those measurements that can be used to determine the cause of impacts that prevent achievement of stated objectives; and (c) early warning indicators, measurements that are especially sensitive to ecosystem stress and, thus, are capable of detecting the onset of deleterious conditions before significant impact has occurred. Suitable indicators of each type should be identified to support efforts not only to achieve (i.e., remediation) but, subsequently, to protect (i.e., prevention) conditions stated in each ecosystem objective. Development
of a suite of indicator species
Measurements performed on individuals and populations of indigenous species have proven their utility for indicating the nature and extent of anthropogenic stress on natural biological systems. However, no one species appears to adequately integrate the effects of all important stressors. Certain indicator species can be used most effectively to track progress toward mitigation of the impact of specific stressors on the environment. While previously proposed ‘integrator’ species, such as the lake trout and the walleye, appear suitable for use as monitoring tools, it is unlikely that these species alone will provide sufficient information to precisely track progress in all aspects of ecosystem rehabilitation. While the ‘integrator species’ approach is appealing, it is problematic for several reasons, particularly because individual species tend to be differentially sensitive to different types of environmental stressors. Previous researchers have identified other species that are known to be especially sensitive to specific classes of stressors. These species represent useful environmental monitors to augment integrator species, Recommended species include the herring gull as an indicator species for monitoring effects of persistent organic toxicants
38 and an alga such as Cladophora for monitoring changes in phosphorus availability. Other indicator species of this type would be valuable. Development of community- and ecosystem-level indicators There are inherent limitations to the indicator species approach in environmental monitoring. Most indigenous species exhibit a limited geographical distribution and, because they are selectively sensitive to one or a few stressors, may not be suitable for monitoring changes of cumulative impact. Furthermore, difficulties may exist in relating changes in population parameters to the achievement of broader objectives, such as that of a self-maintaining ecosystem. Assessments of ecosystem change in response to ongoing remediation efforts and continued impact will likely be enhanced by the identification of candidate community and ecosystem indicators. Continued basic research in this area is especially important, as are interactions between research scientists and ecosystem managers aimed at translating concepts related to ecosystem integrity into concrete measures that can be used as indicators of integrity. Community and ecosystem measurements should complement measures performed on indicator species. While the indicator species approach is suitable for monitoring target populations and the level of impact of specific forms of stress, communities and ecosystems appear more suitable for measuring changes in long-term cumulative impacts. It may be sufficient to perform community and ecosystem analyses at less frequent intervals (e.g., every few years) than those required for population measurements, given differences in the focus of these two types of monitoring. Indicators of human health and linkages to environmental degradation Ecological studies with data from registries provides the least expensive way to monitor human health effects over time. Indicators should include cause of death, tumors, and birth defects. These studies provide a broadly applicable and cost-
effective approach, but they lack sensitivity and early warning capability, and so additional monitoring approaches are necessary. Fish eating populations represent the most heavily exposed human group. Cohort studies with fish eaters should continue to confirm early indications of adverse effects, to follow-up apparently affected groups, and to monitor these worstcase human health consequences of environmental pollution. Indicators of cognitive function in infants appear sensitive and broadly applicable, but other groups of indicators should be developed. There are several linkages that can be made to improve the relevance and efficiency of assessments of the effects of environmental degradation on human health. First, physiological biomarkers in exposed human populations are promising early warning indicators of human health effects. However, their effectiveness as assessment or compliance indicators depends on the establishment of a clear relationship between these indicators and ones with more obvious biological and social relevance (subsequent full-blown disease). Second, feral animals may well be effective sentinels for assessment of human health effects like the canary in the coal mine. Studies of the utility of feral populations as sentinels for human health effects would be improved by studies linking exposure biomarkers (e.g., tissue concentrations or induction of relevant enzymes such as MFO) and health effects in the sentinel species (both subclinical biomarkers such as sister chromatid exchange and full-blown impairments such as birth defects) to the same indicators in exposed human populations. Biomarkers that can be measured in both humans and sentinel species (e.g., Herring gulls) should be developed and correlated for future use as early warning systems. Coordination between human and sentinel species researchers should provide the basis for screening biomarkers for usefulness. Indicators of reasonable human use and linkages to the environment Methods for monitoring linkages between ecological and economic spheres is an area of intense
39 current research, but few suggestions for integrated regional monitoring schemes have been put forth. The framework described by Friend & Rapport (1990) and the example of implementation found in Bird & Rapport (1986) provide a logical starting point. Stock size, rate of harvesting, and rate of recruitment for commercially important fish species is of both economic and ecological importance and avoids methodological problems involved in translating environmental goods and services into monetary terms. (However, there are occasional contradictions between economic and ecological goals for these end points, e.g., limits to maximum fish production in oligotrophic systems.) Maintenance of recreational utility is included in the concept of sustainability, and data are currently available. Eventually, a more complete accounting of human uses should be possible as reliable and standard measurement methods for other categories of use are developed and adopted by localities. Standardized units and methods for natural resources accounting would be of great value. Methodological problems with valuations must be resolved if the overall contribution of environmental goods and services to regional wealth is to be monitored. Translating these and other unmarketed attributes into monetary terms for compatibility with most economic policymaking instruments requires further research. Studies to determine correlations between different valuation methods and rankings of the acceptance of resulting values by shareholders and decision makers would help clarify acceptable methods. The concepts of value, importance, and risk aversion represent linkages between this economic sector and the subjective assessments that are a possible focus of the interviews suggested for monitoring subjective assessments of environmental quality. Perceptions of environmental quality and quality of l$e A standardized instrument should be developed to monitor trends in perceived environmental quality and quality of life for shareholders. This data will provide feedback on the success of man-
agement efforts, determine the relative importance of environmental quality to the shareholders, and assess the effectiveness of communication of management problems to the people affected. Linking subjective perceptions of environmental quality to the objective determinations of scientists is an important subsequent step. When the objective and subjective assessments of environmental quality agree that environmental quality is sufficient, management techniques are vindicated. If both types of assessments agree that environmental quality is lacking, more vigorous management is called for. If objective and subjective assessments reach different conclusions, several possible actions may be called for. More effective communication of problems and risks to the general public, reformulation of goals more in line with shareholder interest, or reordering of priorities for addressing existing problems may be called for.
Acknowledgements The authors produced this discussion originally as a draft report under contract to the International Joint Commission of the United States and Canada. The report was initiated by the Council of Great Lakes Research Managers, co-chaired by Roy Hickman (Canada) and Jon Stanley (United States) and co-sponsored with the water Quality Board, co-chaired by David Edgar (Canada) and Val Adamkus (United States) and Health Protection Branch, Health and Welfare Canada. Funding was provided through the Council and Water Quality Board by the International Joint Commission and by Health and Welfare Canada through the Health Protection Branch. We are indebted to the International Joint Commission Study Team consisting of Al Davidson, Rick Burnett, and Peter Seidl for guidance throughout the preparation of the report. The final report was edited at the International Joint Commission by Peter Seidl and Pat Murray, with graphics by Bruce Jamieson. The official report was published by the International Joint Commission in July 1991 and was 47 pages
40 under ISBN # 1-895-85-29-2. We are deeply indebted to Dr Peter Seidl of the International Joint Commission for giving permission to submit the discussion to Hydrobiologia so that a wider audience might have an opportunity to share our thoughts on these very important matters. The authors are deeply indebted to Darla Donald, Editorial Assistant in the University Center for Environmental and Hazardous Materials Studies, for editing prior to submission to Hydrobiologia.
References Allen, T. F. H., 1990. Integrity and surprise in the Great Lakes basin ecosystem: The perspective hierarchy theory. In C. J. Edwards & H. A. Regier (eds), An Ecosystem Approach to the Integrity of the Great Lakes in Turbulent Times. Great Lakes Fishery Commission Special Publication 90-4, Ann Arbor, MI: 121-130. Auer, M. T., R. P. Canale, H. C. Grundler & Y. Matsuoka, 1982. Ecological studies and mathematical modeling of C[adophoru in Lake Huron: 1. Program description and field monitoring of growth dynamics. J. Great Lakes Res. 8: 73-83. Aulerich, R. J. & R. K. Ringer, 1977. Current status of PCB toxicity to mink, and effect on their reproduction. Arch. envir. Contam. Toxicol. 6: 279-292. Barton, D. R., 1989. Some problems affecting the assessment of Great Lakes water quality using benthic invertebrates. J. Great Lakes Res. 15: 611-622. Beck, W. M., Jr., 1955. Suggested method for reporting biotic data. Sewage Ind. wastes 27:1193-1197. Bertram, P. E. & T. B. Reynoldson, 1991. Developing ecosystem objectives for the Great Lakes: Policy, progress and public participation. Hydrobiologia. Biggs, D., R. Rowland, H. O’Connors, C. Powers & C. Wurster, 1978. A comparison of the effects of chlordane and PCB on the growth, photosynthesis and cell size of estuarine phytoplankton. Envir. Pollut. 15: 253-263. Bird, P. & D. Rapport, 1986. State of the Environment Report for Canada. Minister of the Environment, Ottawa. Bormann, F. H., 1983. Factors confounding the evaluation of air pollutant stress on forests: Pollutant input and ecosystem complexity. In Symposium, Acid Deposition, a Challenge for Europe. Karlsruhe, Federal Republic of Germany: 19-23. Cairns, J., Jr., 1983. Are single species tests alone adequate for estimating environmental hazard? Hydrobiologia 100: 47-57. Cairns, J., Jr. (ed.), 1985. Multispecies toxicity testing. Pergamon Press, New York, 261 pp. Cairns, J., Jr (ed.), 1986a. Community toxicity testing. American Society for Testing and Materials, Philadelphia, PA, 350 pp. Cairns, J., Jr., 1986b. The case for direct measurement of environmental responses to hazardous materials. Wat. Resour. Bull. 22: 841-842.
Cairns, J., Jr. (ed.), 1988. Rehabilitating damaged ecosystems, Vol. 1. CRC Press, Boca Raton, FL, 192 pp. Cairns, J., Jr. & D. Gruber, 1980. A comparison of methods and instrumentation of biological early warning systems. Wat. Resour. Bull. 16: 261-266. Cairns, J., Jr. & D. I. Mount, 1990. Aquatic toxicology. Envir. Sci. Technol. 24: 154-161. Cairns, J., Jr. & B. R. Niederlehner, 1987. Problems associated with selecting the most sensitive species for toxicity testing. Hydrobiologia 153: 87-94. Cairns, J., Jr. & J. R. Pratt, 1986. On the relation between structural and functional analyses of ecosystems. Envir. Toxicol. Chem. 5: 785-786. Cairns, J., Jr., G. R. Lanza & B. C. Parker, 1972. Pollution related structural and functional changes in aquatic communities with emphasis on freshwater algae and protozoa. Proc. Acad. nat. Sci. Philad. 124: 79-127. Cairns, J., Jr., K. L. Dickson & A. Maki (eds), 1978. Estimating the hazard of chemical substances to aquatic life. American Society for Testing and Materials, Philadelphia, PA. Cairns, J., Jr., J. R. Pratt, B. R. Niederlehner & N. J. Bowers, 1988. Structural and functional responses to perturbation in aquatic ecosystems. Report to the Air Force Office of Scientific Research, AS-Al92 071/9/GAR. National Technical Information Service, Springfield, VA. Carpenter, S. S. R., J. F. Kitchell & J. R. Hodgson, 1985. Cascading trophic interactions and lake ecosystem productivity. Bioscience 35: 634-639. Cohen, J. E., 1989. Food webs and community structure. In J. Roughgarden, R. M. May & S. A. Levin (eds), Perspectives in Ecological Theory. Princeton University Press, Princeton, NJ: 18 l-202. Colbom, T., 1990. Innovative approaches for evaluating human health in the Great Lakes Basin using wildlife toxicology and ecology. International Joint Commission, Windsor, Ontario. Connell, J. H., 1978. Diversity in tropical rainforests and coral reefs. Science 199: 1302-1310. C&e, R. P. & P. G. Wells, 1991. Controlling chemical hazards: Fundamentals of the management of toxic chemicals. Unwin Hyman, London, UK, 310 pp. Craik, K. & E. Zube, 1976. Perceiving environmental quality research and applications. Plenum Press, New York, 310 pp. Davis, W. & A. Lubin, 1989. Statistical validation of Ohio EPA’s invertebrate community index. In Proceedings of the Midwest Pollution Control Biologists Meeting, W. S. Davis & T. P. Simon (eds), EPA 905/9-89-007. USEPA Region V Instream Biocriteria and Ecological Assessment Committee, Chicago, IL: 23-32. Delfino, J. J., 1979. Toxic substances in the Great Lakes. Envir. Sci. Tech. 13: 1462-1468. Descy, J. P., 1979. A new approach to water quality estimation using diatoms. Nova Hedwigia 64: 305-323. DiGiulio, R. T., 1989. Biomarkers. In Ecological Assessment of Hazardous Waste Sites: A Field and Laboratory Reference, EPA/600/3-89/013. United States Environmental Protection Agency, Cincinnati, OH: 7-l to 7-34. Dutka, B.J., N. Nyholm & J. Peterse, 1983. Comparison of several microbiological toxicity screening tests. Wat. Res. 17: 1363-1368.
41 Ecosystem Objectives Working Group, 1990. Ecosystem objectives for Lake Ontario. Prepared by the Parties to the Great Lakes Water Quality Agreement, March, 1990,14 pp. Edwards, C. J. & H. A. Regier (eds), 1990. An ecosystem approach to the integrity of the Great Lakes in turbulent times. Great Lakes Fishery Commission Special Publication 90-4, Ann Arbor, MI, 299 pp. Edwards, C. J. & R. A. Ryder, 1990. Biological surrogates of mesotrophic ecosystem health in the Laurentian Great Lakes. Report to the Great Lakes Science Advisory Board, Windsor, Ontario, 69 pp. Evans, M. S. & D. C. McNaught, 1988. The effects of toxic substances on zooplankton populations: A Great Lakes perspective. In M. S. Evans (ed.), Toxic Contaminants and Ecosystem Health: A Great Lakes Focus. John Wiley & Sons, New York: 53-76. Eyles, J., 1990. Objectifying the subjective: The measurement ofenvironmental quality. Sot. Indicators Res. 22: 139-153. Fein, G., J. Jacobson, S. Jacobson, P. Schwartz &J. Dowler, 1984. Prenatal exposure to polychorinated biphenyls: Effects on birth size and gestational age. J. Pediatr. 105: 315-320. Fisher, N. S., 1975. Chlorinated hydrocarbon pollutants and photosynthesis of marine phytoplankton: A reassessment. Science 189: 463-464. Fitchko, J., 1986. Literature review of the effects of persistent toxic substances on Great Lakes biota. International Joint Commission, Windsor, Ontario. Flint, R., 1991. Human health risks from chemical exposure: The Great Lakes ecosystem. Lewis Publishers, Boca Raton, FL. Fontaine, T. D. & D. J. Stewart, 1990. In C. J. Ewards & H. A. Regier (eds), An Ecosystem Approach to the Integrity of the Great Lakes in Turbulent Times. Great Lakes Fishery Commission Special Publication 90-4, Ann Arbor, MI: 153-168. Friend, A. & D. Rapport, 1990. The evolution of information systems for sustainable development, IREE Occasional Paper Series, No. 1. Institute for Research on Environment and Economy, University of Ottawa, Ontario. Gallup, G., Jr., 1990. The Gallup poll 1989. Scholarly Resources Inc, Wilmington, DE. Gannon, J. E. & R. S. Stemberger, 1978. Zooplankton (especially crustaceans and rotifers) as indicators of water quality. Trans. am, microsc. Sot. 97: 16-35. Giesy, J. P. (ed.), 1980. Microcosms in ecological research. Technical Information Center, Springfield, VA, 1110 pp. Giesy, J. P., D. Versteeg & R. Graney, 1988. A review of selected clinical indicators of stress-induced changes in aquatic organisms. In M. S. Evans (ed.), Toxic Contaminants and Ecosystem Health: A Great Lakes Focus, John Wiley & Sons, New York: 169-200. Gilbertson, M., 1984. Need for development epidemiology for chemically induced diseases in fish in Canada. Can. J. Fish. aquat. Sci. 41: 1534-1540. Gilbertson, M., 1988. Epidemics in birds and mammals caused by chemicals in the Great Lakes. In M. S. Evans (ed.), Toxic Contaminants and Ecosystem Health: A Great Lakes Focus. John Wiley & Sons, New York: 133-152. Gilman, A. P., D. B. Peakall, D. J. Hallett, G. A. Fox & R. J. Norstrom, 1979. Herring gulls (Lams argentatus) as monitors of contamination in the Great Lakes. In Animals
as Monitors of Environmental Pollutants. National Academy of Science Press, Washington, DC: 280-289. Great Lakes Research Advisory Board, 1978. The ecosystem approach, Special Report to the International Joint Commission. Windsor, Ontario, 49 pp. Great Lakes Water Quality Board, 1989. Report to the International Joint Commission on Great Lakes water quality. Windsor, Ontario, 128 pp. Hallett, D., 1986. Ecosystem surprises: Toxic chemical exposure and effects in the Great Lakes. In N. W. Schmidtke (ed.), Toxic Contamination in Large Lakes, Volume I: Chronic Effects of Toxic Contaminants in Large Lakes. Lewis Publishers, Inc., Chelsea, MI: 25-37. Hammons, A. (ed.), 1981. Methods for ecological toxicology. Ann Arbor Science, Ann Arbor, MI. Harris, H. J., 1988. Persistent toxic substances and birds and mammals in the Great Lakes. In M. S. Evans (ed.), Toxic Contaminants and Ecosystem Health: A Great Lakes Focus. John Wiley & Sons, New York: 557-569. Harris, L., 1990. Public mood has hardened to advocate tougher, stricter laws on air pollution. The Harris Poll 199# 13, April. Hellawell, J. M., 1978. Biological surveillance of rivers. Water Research Centre, Stevenage, England. Hellawell, J. M., 1986. Biological indicators of freshwater pollution and environmental management. Elsevier Applied Science Publishers, New York, 546 pp. Hill, J. & R. G. Wiegert, 1980. Microcosms in ecological modelling. In J. P. Giesy (ed.), Microcosms in ecological research. National Technical Information Service, Springfield, VA: 138-163. Hilsenhoff, W. L., 1982. Using a biotic index to evaluate water quality in streams, Technical Bulletin No. 132. Wisconsin Department of Natural Resources, Madison, WI, 22 pp. Humphrey, H., 1988. Chemical contaminants in Great Lakes: The human health aspect. In M. S. Evans (ed.), Toxic Contaminants and Ecosystem Health: A Great Lakes Focus. John Wiley & Sons, New York: 153-165. Hunsaker, C. T. & D. E. Carpenter (eds), 1990. Environmental monitoring and assessment program: Ecological indicators. Office of Research and Development, United States Environmental Protection Agency, Research Triangle Park, NC. Hurlbert, S. H., 1971. The nonconcept of species diversity: A critique and alternative parameters. Ecology 52: 577586. International Joint Commission, 1986. 1985 annual report: Committee on the assessment of human health effects of Great Lakes water quality. Windsor, Ontario. International Joint Commission, 1989. 1989 report on Great Lakes water quality. Windsor, Ontario, 12 pp. International Joint Commission, 1990. Proceedings of a workshop on the role of epidemiology in assessing the effects of Great Lakes water quality on human health, ISBN I-895085-05-5. Windsor, Ontario. Jacobson, J. L. & S. W. Jacobson, 1988. New methodologies for assessing the effects of prenatal toxic exposure on cognitive functioning in humans. In M. S. Evans (ed.), Toxic Contaminants and Ecosystem Health: A Great Lakes Focus. John Wiley & Sons, New York: 373-388. Jacobson, J., S. Jacobson, G. Fein, P. Schwartz &J. Dowler, 1984. Prenatal exposure to an environmental toxin: A test
42 of the multiple effects model. Dev. Psychol. 20: 523-532. Jansen, H., 1991. The economic perspective. In R. Cote & P. Wells (eds), Controlling Chemical Hazards: Fundamentals of the Management of Toxic Chemicals. Unwin Hyman, Cambridge, MA. Jonasson, P. M., 1984. Oxygen demand and long term changes of profundal zoobenthos. Hydrobiologia 115: 121126. Jordan, W. R., III, M. E. Gilpin & J. D. Aber (eds), 1987. Restoration Ecology: A Synthetic Approach to Ecological Research. Cambridge University Press, Cambridge, UK, 342 pp. Kaesler, R. L., J. Cairns & S. Crossman, 1974. Redundancy in data from stream surveys. Wat. Res. 8: 637-642. Karr, J. R., 1991. Biological integrity: A long-neglected aspect of water resource management. Ecol. Appl. 1: 66-84. Karr, J. R., K. D. Fausch, P. L. Angermeier, P. R. Yant & I. J. Schlosser, 1986. Assessing biological integrity of running waters: A method and its rationale, Special Publication 5. Illinois Natural History Survey, Champaign, IL, 28 PP. Kaushik, N. K., G. L. Stephenson, K. R. Solomon & K. E. Day, 1985. Impact of permethrin on zooplankton communities in limnocorrals. Can. J. Fish aquat. Sci. 42: 77-85. Kerr, A., 1990. Canada’s national environmental indicators project: Background report. Sustainable Development and State of the Environment Reporting Branch, Environment Canada, 12 pp. Kerr, S. R. & L. M. Dickie, 1984. Measuring the health of aquatic ecosystems. In V. W. Cairns, P. V. Hodson & J. 0. Nriagu (eds), Contaminant Effects on Fisheries. John Wiley & Sons, New York: 279-284. Kimball, K. D. & S. A. Levin, 1985. Limitations to laboratory bioassays: The need for ecosystem-level testing. Bioscience 35: 165-171. Kingston, J. C., R. L. Lowe, E. F. Stoermer & T. B. Ladewski, 1983. Spatial and temporal distribution of benthic diatoms in northern Lake Michigan. Ecology 64: 1566-1580. Kitchell, J. F., M. S. Evans, D. Scavia & L. B. Crowder, 1988. Regulation of water quality in Lake Michigan: Report of the food web workshop. J. Great Lakes Res. 14: 109114. Kolkwitz, R. & M. Marsson, 1908. dkologie der pflanzlichen Saprobien. Ber. dt. bot. Ges. 26: 505-519. Kraft, K. J. & R. H. Sypniewski, 1981. Effect of sediment copper on the distribution of benthic macroinvertebrates in the Keweenaw Waterway. J. Great Lakes Res. 7: 258263. Lange-Bertalot, H., 1979. Pollution tolerance of diatoms as a criterion for water quality estimation. Nova Hedwigia 64: 285-304. LaPoint, T. W. & J. A. Perry, 1989. Use of experimental ecosystems in regulatory decision making. Envir. Mngt. 13: 539-544. LaPoint, T. W., J. F. Fairchild, E. E. Little & S. E. Finger, 1989. Laboratory and field techniques in ecotoxicological research: Strengths and limitations. In A. Boudou & F. Ribeyre (eds), Aquatic Ecotoxicology: Fundamental Concepts and Methodologies, Vol. III. CRC Press, Boca Raton, FL. Lave, L., F. Enhever, A. Roesnkranz & G. Omenn, 1988. In-
formation value of the rodent bioassay. Nature (London) 336: 631-633. Leonard, P. & D. Orth, 1986. Application and testing of an index of biotic integrity in small, coolwater streams. Trans. am. Fish. Sot. 115: 401-414. Levine, S. N., 1989. Theoretical and methodological reasons for variability in the responses of aquatic ecosystem processes to chemical stresses. In S. A. Levine, M. A. Harwell, J. R. Kelly & K. D. Kimball (eds), Ecotoxicology: Problems and Approaches, Springer-Verlag, New York: 145-180. Lichtkopper, F. & L. Hushak, 1989. Characteristics of Ohio’s Lake Erie recreational marinas J. Great Lakes Res 15: 418-426. Macek, K., W. Birge, F. Mayer, A. Buikema, Jr. & A. Maki, 1978. Discussion session synopsis. In J. Cairns, Jr., K. Dickson & A. Maki (eds), Estimating the Hazard of Chemical Substances to Aquatic Life, STP 657. American Society for Testing and Materials, Philadelphia, PA: 2732. Maguire, L., 1988. Decision analysis: An integrated approach to ecosystem exploitation and rehabilitation. In J. Cairns, Jr. (ed.), Rehabilitating Damaged Ecosystems, CRC Press, Boca Raton, FL: 105-122. Margalef, R., 1958. Information theory in ecology. Gen. Syst. 3: 36-71. Marsh, G. & R. Caplan, 1987. Evaluating health effects of exposure at hazardous waste sites: A review of the stateof-the-art, with recommendations for future research. In J. Andelman & D. Underhill (eds), Health Effects from Hazardous Waste Sites. Lewis Publishers, Chelsea, MI: 3-80. Marshall, J. S. & D. L. Mellinger, 1980. Dynamics of cadmium stressed plankton communities. Can. J. Fish. aquat. Sci. 37: 403-414. May, R. M., 1977. Thresholds and breakpoints in ecosystems with a multiplicity of stable states. Nature 269: 471-477. Mayer, F. L., Jr. & M. R. Ellersieck, 1986. Manual of acute toxicity: Interpretation and data base for 410 chemicals and 66 species offreshwater animals, Resource Publication 160. United States Department of the Interior, Washington, DC, 505 pp. McCarthy, J. F. & L. R. Shugart, 1990. Biomarkers of environmental contamination. Lewis Publishers, Inc., Boca Raton, FL, 460 pp. Milbrath, L. W., 1978. Indicators of environmental quality. In Indicators of Environmental Quality and Quality of Life, UNESCO Reports and Papers in the Social Sciences SS/ CH/38. UNESCO, Paris: 32-56. Molinari, J., 1989. A calibrated index for the measurement of evenness. Oikos 56: 319-326. Mount, D. I. & L. Anderson-Carnahan, 1988. Methods for aquatic toxicity identification evaluation, EPA/600/3-88035. National Technical Information Service, Springfield, VA. Munn, R. E., 1990. Sustainable development: A Canadian perspective. Institute of Environmental Studies, University of Toronto, Ontario, 22 pp. National Research Council, 1981. Testing for effects of chemicals on ecosystems. National Academy Press, Washington, DC, 103 pp. Nijkamp, P. & F. Soeteman, 1988. Ecologically sustainable
43 economic development: Key issues for strategic environmental management. Int. J. Social Econ. 15: 88-102. Norton, S., M. McVey, J. Colt, J. Durda & R. Hegner, 1988. Review of ecological risk assessment methods, EPA/23010-88-041. National Technical Information Service, Springfield, VA. O’Connors, H. B., Jr., C. F. Wurster, C. D. Powers, D. C. Biggs & R. G. Rowland, 1978. Polychlorinated biphenyls may alter marine trophic pathways by reducing phytoplankton size and production. Science 201: 737739. Odum, E. P., 1985. Trends expected in stressed ecosystems. Bioscience 35: 419-422. Organisation for Economic Co-operation and Development, 1982. Economic and ecological interdependence. OECD, Paris. Organisation for Economic Co-operation and Development, 1989. Environmental policy benefits: Monetary valuation. OECD, Paris. Page, T., R. Harris & S. Epstein, 1976. Drinking water and cancer mortality in Louisiana. Science 193: 55-57. Pantle, R. & H. Buck, 1955. Die biologische Uberwachung der Gewasser und die Darstellung der Ergebnisse. Gas. Wassfach. 96-604. Patrick, R., 1963. The structure of diatom communities under varying ecological conditions. Ann. N. Y. Acad. Sci. 108: 353-358. Patrick, R., 1977. Ecology of freshwater diatoms. In D. Werner (ed.), The Biology of Diatoms. University of California Press, Berkeley, CA: 284-332. Patrick, R., M. H. Hohn & J. H. Wallace, 1954. A new method for determining the pattern of diatom flora. Notul. Nat., Acad. nat. Sci. Philad. 259, 12 pp. Patrick, R., J. Cairns, Jr. & A. Scheier, 1968. The relative sensitivity of diatoms, snails, and fish to twenty common constituents of industrial wastes. Prog. Fish-Cult. 30: 137140. Peakall, D. B., 1988. Known effects of pollutants on fisheating birds in the Great Lakes of North America. In N. W. Scmidtke (ed.), Toxic Contaminants in Large Lakes - Volume I, Chronic Effects of Toxic Contaminants in Large Lakes. Lewis Publishers, Chelsea, MI: 39-54. Pfister, R. M., J. I. Frea, P. R. Dugan, C. I. Randles, K. Zaebst, J. Duchene, T. McNair & R. Kennedy, 1970. Chlorinated hydrocarbon microparticulate effects on microorganisms isolated from Lake Erie. In Proceedings of the 13th Conference on Great Lakes Research: 82-92. Plafkin, J. L., M. T. Barbour, K. D. Porter, S. K. Gross & R. M. Hughes, 1989. Rapid bioassessment protocols for use in streams and rivers: Benthic macroinvertebrates and fish, EPA 444/4-89-001. National Technical Information Service, Springfield, VA. Pontasch, K. W., E. P. Smith & J. Cairns, Jr., 1989. Diversity indices, community comparison indices and canonical discriminant analysis: Interpreting the results of multispecies toxicity tests. Wat. Res. 23: 1229-1238. Rand, G. M. & S. R. Petrocelli, 1985. Fundamentals of aquatic toxicology: Methods and applications. McGrawHill International, Washington, DC, 666 pp. Rapport, D. J., H. A. Regier & T. C. Hutchinson, 1985. Ecosystem behavior under stress. Am. Nat. 125: 617-640. Regier, H. A., 1979. Changes in species composition of Great
Lakes fish communities caused by man. Trans. N. Am. Wildl. Nat. Resour. Conf. 44: 558-566. Reynoldson, T. B., D. W. Schloesser & B. A. Manny, 1989. Development of a benthic invertebrate objective for mesotrophic Great Lakes waters. J. Great Lakes Res. 15: 669-686. Roberts, L., 1990. Zebra mussel invasion threatens U.S. waters. Science 249: 1370-1372. Ryder, R. A. & C. J. Edwards, 1985. A conceptual approach for the application of biological indicators of ecosystem quality in the Great Lakes basin. Report to the Great Lakes Science Advisory Board, Windsor, Ontario, 169 pp. Ryder, R. A. & S. R. Kerr, 1978. The adult walleye in the percid community - a niche definition based on feeding behavior and food specificity. In R. L. Kendall (ed.), Selected Coolwater Fishes of North America. Am. Fish. Sot. Spec. Publ. No. 11: 39-51. Ryder, R. A. & S. R. Kerr, 1990. Aquatic harmonic communities: Surrogates of ecosystem integrity. In C. J. Edwards & H. A. Regier (eds), An Ecosystem Approach to the Integrity of the Great Lakes in Turbulent Times. Great Lakes Fishery Commission Special Publication 90-4, Ann Arbor, MI: 239-255. Sandhu, S. S. & W. R. Lower, 1987. In situ monitoring of environmental genotoxins. In S. S. Sandhu, D. M. DeMarini, M. J. Mass, M. M. Moore & J. L. Mumford (eds), Shortterm Bioassays in the Analysis of Complex Environmental Mixtures V. Plenum Press, New York: 145-160. Scavia, D., G. A. Lang & J. F. Kitchell, 1988. Dynamics of Lake Michigan plankton: A model evaluation of nutrient loading, competition and predation. Can. J. Fish. aquat. Sci. 45: 16-177. Schindler, D. W., 1987. Detecting ecosystem responses to anthropogenic stress. Can. J. Fish. aquat. Sci. 44 (Suppl. 1): 6-25. Seneca, J., 1987. Economic issues in protecting public health and the environment. In M. R. Greenberg (ed.), Public Health and the Environment: The United States Experience. Guilford Press, New York: 351-377. Sicko-Goad, L. & E. F. Stoermer, 1988. Effects of toxicants on phytoplankton with special reference to the Laurentian Great Lakes. In M. S. Evans (ed.), Toxic Contaminants and Ecosystem Health: A Great Lakes Focus. John Wiley & Sons, New York: 19-52. Sloof, W., 1983. Benthic macroinvertebrates and water quality assessment: Some toxicological considerations. Aquat. Toxicol. 4: 73-82. Steedman, R. J. & H. A. Regier, 1990. Ecological bases for an understanding of ecosystem integrity in the Great Lakes basin. In C. J. Edwards & H. A. Regier (eds), An Ecosystem Approach to the Integrity of the Great Lakes in Turbulent Times. Great Lakes Fishery Commission Special Publication 90-4: 257-270. Stevenson, R. J., 1984. Epilithic and epipelic diatoms in the Sandusky River, with emphasis on species diversity and water pollution. Hydrobiologia 114: 161-175. Stewart, G., 1987. The leading question: A paper related to a project on economics and environment, Hydrobiologia 149: 141-157. Stoermer, E. F., 1978. Phytoplankton assemblages as indicators of water quality in the Laurentian Great Lakes. Trans. am. Microsc. Sot. 97: 2-16.
44 Stoermer, E. F., J. P. Kociolek, C. L. Schelske & D. J. Conley, 1985a. Siliceous microfossil succession in the recent history of Lake Superior. Proc. Acad. nat. Sci. Philad. 137: 106-118. Stoermer, E. F., J. A. Wolin, C. L. Schelske & D. J. Conley, 1985b. An assessment of ecological changes during the recent history of Lake Ontario based on siliceous algal microfossils preserved in the sediments. J. Phycol. 21: 257276. Stoermer, E. F., J. P. Kociolek, C. L. Schelske & D. J. Conley, 1987. Quantitative analysis of siliceous microfossils in the sediments of Lake Erie’s central basin. Diatom Res. 2: 113-134. Stoermer, E. F., C. L. Schelske & J. A. Wolin, 1990. Siliceous microfossil succession in the sediments of McLeod Bay, Great Slave Lake, Northwest Territories. Can. J. Fish. aquat. Sci. 47: 1865-1874. Suter, G., 1989. Ecological endpoints. In W. Warren-Hicks, B. Parkhurst & S. Baker, Jr. (eds), Ecological Assessment of Hazardous Waste Sites: A Field and Laboratory Reference, EPA 600/3-89-013. National Technical Information Service, Springfield, VA: 2.1 to 2.26. Szczepanik-van Leeuwen, P. A. & W. R. Penrose, 1983. Functional properties of a microcosm of the freshwater benthic zone and the effects of 2,4-dichlorophenol. Arch. envir. Contam. Toxicol. 12: 427-437. W. H., Thomas, 0. Holm-Hansen, D. L. R. Seibert, F. Azam, R. Hodson & M. Takahashi, 1977. Effects of copper on phytoplankton standing crop and productivity: Controlled ecosystem pollution experiment. Bull. mar. Sci. 27: 34-43. United States Environmental Protection Agency, 1985. Technical support document for water-quality based toxics Control, EPA-440/4-85-032. National Technical Information Service, Springfield, VA. Van Voris, P., R. V. O’Neill, W. R. Emanuel & H. H. Shugart, Jr., 1980. Functional complexity and ecosystem stability. Ecology 61: 1352-1360. Vouk, V., G. Butler, A. Upton, D. Parke & A. Asher (eds), 1987. Methods for assessing the effects of mixtures of chemicals, SCOPE 30, SGOMSEC3. John Wiley & Sons, New York.
Wall, T. M. & R. W. Hanmer, 1987. Biological testing to control toxic water pollutants. J. Wat. Pollut. Cont. Fed. 59: 7-12. Wang, Y. Y., C. P. Flessel, L. R. Williams, K. Chang, M. J. DiBartolomeis, B. Simmons, H. Singer & S. Sun, 1987. Evaluation of guidelines for preparing wastewater samples for Ames testing. In S. S. Sandhu, D. M. DeMarini, M. J. Mass, M. M. Moore & J. L. Mumford (eds), Short-term Bioassays in the Analysis of Complex Environmental Mixtures V. Plenum Press, New York: 67-87. Ward, J. V. & J. A. Stanford, 1983. The intermediatedisturbance hypothesis: An explanation for biotic diversity patterns in lotic ecosystems. In T. D. Fontaine & S. M. Bartell (eds), Dynamics of Lotic Ecosystems, Ann Arbor Science Publishers, Ann Arbor, MI: 347-356. Warwick, R. M., 1986. A new method for detecting pollution effects on marine benthic communities. Mar. Biol. 92: 557562. Weber, C. I. (ed.), 1973. Biological field and laboratory methods for measuring the quality of surface waters and effluents, EPA-670/4-73-001. U.S. Environmental Protection Agency, Cincinnati, OH. Wentworth, N., J. Westrick & K. Wang, 1986. Drinking water quality data bases. In F. Kopfler & G. Graun (eds), Environmental Epidemiology. Lewis Publishers Inc., Chelsea, MI: 131-140. Wessman, C. A., 1990. Landscape ecology: Analytical approaches to pattern and process. In C. J. Edwards & H. A. Regier (eds), An Ecosystem Approach to the Integrity of the Great Lakes in Turbulent Times. Great Lakes Fishery Commission Special Publication 90-4, Ann Arbor, MI: 285-299. Wise, D. W., 1988. An economic view of the Great Lakes. In N. W. Schmidtke (ed.), Toxic Contamination in Large Lakes; Volume IV: Prevention of Toxic Contamination in Large Lakes. Lewis Publishers, Inc., Chelsea, MI: 1929. Wolin, J. A., E. F. Stoermer, C. L. Schelske & D. J. Conley, 1988. Siliceous microfossil succession in recent Lake Huron sediments. Arch. Hydrobiol. 114: 175- 198. Woodwell, G. W., 1967. Radiation and the patterns of nature. Science 156: 461-470.