Chapter
1
A Protocol for Parameterization and Calibration of RZWQM2 in Field Research L. Ma L.R. Ahuja S.A. Saseendran R.W. Malone T.R. Green B.T. Nolan P.N.S. Bartling G.N. Flerchinger K.J. Boote G. Hoogenboom
Abstract Use of agricultural system models in field research requires a full understanding of both the model and the system it simulates. This chapter provides a protocol on how to parameterize the USDA-ARS, Root Zone Water Quality Model (RZWQM2), which contains the DSSAT (Decision Support System for Agrotechnology Transfer) version 4.0 plant growth modules and the SHAW (Simultaneous Heat and Water) energy balance modules. It summarizes input data requirements of soil, weather, and plants, as well as the minimum data needed to calibrate the model. Calibration of each component or process is illustrated, along with possible adjustable parameters. An iterative procedure for model calibration is emphasized. Difficulties in model application are presented, along with possible solutions. However, the steps for model calibration are still in the trial-and-error stage and can vary from application to application. Model users should benefit from the materials in this chapter by combining them with those in the RZWQM2 user manual released with the model.
L. Ma (
[email protected]), L.R. Ahuja, S.A. Saseendran, T.R. Green, and P.N.S. Bartling, USDA-ARS, Agricultural Systems Research Unit, Fort Collins, CO 80526; R.W. Malone, USDA-ARS, Natl. Lab. for Agric. and the Environment, Ames, IA 50011; B.T. Nolan, USGS, 413 National Center, Reston, VA 20192; G.N. Flerchinger, USDA-ARS, Northwest Watershed Research Center, Boise, ID 83712; K.J. Boote, Agronomy Dep., Univ. of Florida, Gainesville, FL 32611; G. Hoogenboom, Agricultural and Biological Engineering, Washington State Univ., Prosser, WA 99350. doi: Copyright © 2011. ASA, CSSA, SSSA, 5585 Guilford Rd., Madison, WI 53711-5801, USA. Methods of introducing system models into agricultural research. L. Ahuja and L. Ma (ed.) Advances in Agricultural Systems Modeling Series 2.
1
S
ince the 1960s, agricultural system models have increased tremendously in their complexity due to greater understanding of
the processes simulated, their application to real world problems,
and acceleration of modern computing power. As a result, the parameterization of a system model is now more complex, requiring more input variables
and providing more outputs to verify. Some of the physical or biological parameters are measurable, but difficult and time-consuming to obtain. Furthermore, these parameters when measured vary spatially and temporally due to soil and microclimate heterogeneity and management effects. Many model parameters in agricultural system models do not need calibration and are assumed correct. However, in most cases, one has to calibrate a few parameters (usually by trialand-error) to obtain the desired results under different conditions. Because of interactions among system components, it is not a simple or sequential step-bystep procedure, and the calibration has to be iterative (Cameira et al., 2005; Hanson et al., 1999). The accuracy of such a calibration procedure depends primarily on the type and quality of measured data, but also on the interactions of the system components in the model and the experience of the user. An issue with automated calibration of agricultural system models is the lack of criteria and schemes for an objective optimization of all different parameters. A system model simulates a wide range of biotic and abiotic processes that vary greatly in magnitude and are highly interdependent, which makes optimization nearly impossible. Some of the best guidance documents for calibration were provided for the CROPGRO model by Boote (1999) and Boote et al. (1998), who detailed how to parameterize the growth of legumes using CROPGRO. Hunt et al. (1993) described an optimization program for the DSSAT crop growth models called GENCALC. It can optimize the cultivar parameters given measured crop phenology, biomass, and yield data. However, their suggested procedure was only for crop parameters, Ahuja and Ma (2002) provided a status of model parameterization and guidelines on how to parameterize system components, but they did not detail step-by-step instructions on calibrating a particular model. The majority of agricultural system models are calibrated manually (Saseendran et al., 2010). Such a manual calibration procedure may not be transferable to another model or model user (Boyle et al., 2000). Automated parameter optimization software such as LHS (Latin Hypercubic Sampling) and PEST (Parameter Estimation Soft-
3
4
Ma et al.
ware; Doherty, 2010) are available with limited applications (Nolan et al., 2010). However, the automatic methods may not be transferable to other users because of personal preferences in selecting an objective function to optimize, and the optimized parameters may have no physical or biological meanings (Boyle et al., 2000). Several automatic methods for parameterizing crop models are discussed in the book by Wallach et al. (2006). On the other hand, data quantity and quality are important for a rigorous model calibration (Gan et al., 1997). Because of the cost of collecting data, crop scientists tend to focus efforts on plant related data collection and pay less attention to soil mineralization and soil water related data, whereas soil scientists may do just the opposite. Unless there is a group of scientists with broad expertise, it is difficult to collect data for all the system components with the same resolution. As a practical matter, collecting data on every aspect of the system is not possible either. Therefore, when data are not collected for a system component, there is a need to provide a typical range for the simulated process under a particular experimental condition for the users. The suggested minimum measured data requirements to calibrate a complete system model are soil moisture, soil nutrient, soil chemicals of interest, and plant growth (e.g., phenology, leaf area index, biomass, yield) (Ahuja and Ma, 2002). In this chapter, we outline an iterative step-by-step procedure on how to manually calibrate a system model, using RZWQM2 as an example. Automated optimization methods of system models are discussed in other chapters in this volume (Nolan et al., 2011; Jones et al., 2011; Wallace et al., 2011??? There is no Wallace; do you mean Malone). We first give a summary of the model, followed by agricultural system characterization and guidelines and procedures for calibrating key parameters.
Overview of RZWQM RZWQM (Root Zone Water Quality Model) was initially developed in the early 1990s, followed by improvement over two decades (Ahuja et al., 2000b). The most recent version was released in September 2010 as Version 2.0 at http://ars.usda. gov/Main/docs.htm?docid=17740 or http://arsagsoftware.ars.usda.gov/agsoftware/ (verified 10 Mar. 2011). It is a research-level model containing physical, chemical, and biological processes for simulating agricultural management effects on soil processes, crop production, and water quality. The first DOS version of the model was released in 1992 and evaluated in collaboration with the Management Systems Evaluation Areas (MSEA) project in the U.S. Midwest (Watts et al., 1999). A Windows user interface was developed in 1998, and a book docu-
A Protocol for Parameterization and Calibration of RZWQM2 in Field Research
5
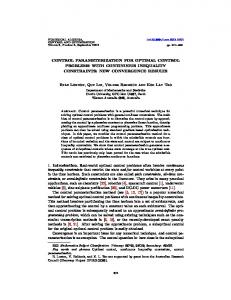
Fig. 1–1. A diagram to show the processes and execution time steps in RZWQM2 (adapted from Ahuja et al., 2000a).
menting the science in RZWQM was published in 2000 (Ahuja et al., 2000b). The recently released RZWQM2 model (Ma et al., 2009) now includes the DSSAT4.0 crop growth models (Jones et al., 2003; Hoogenboom et al., 1994) and the SHAW (Simultaneous Heat and Water) energy balance model (Kozak et al., 2007) with soil depth extended from 3 to 30 m (Nolan et al., 2010). RZWQM2 consists of seven main components: water balance, heat and chemical transport, nutrient processes (carbon and nitrogen), plant growth processes, soil chemical processes, evapotranspiration processes, pesticide processes, and management (Fig. 1–1). The soil water module calculates the water balance using the Green–Ampt equation during infiltration and the Richards equation during redistribution (between rainfall or irrigation events) (Ahuja et al., 2000a). Plant water uptake is treated as a sink term in the Richards equation. If rainfall or irrigation intensity is greater than soil infiltration capacity, surface water ponding is generated, which is first diverted to macropore flow (if macropores exist) to meet the macropore flow rate estimated by Poiseuille’s equation. The remainder is off-site runoff. A portion of water flowing through macropores is absorbed laterally by the soil. Surface retention storage of water is not currently considered in RZWQM2. The model also uses the steady-state Hoogenhout equation (Ahuja et al., 2000a) for subsurface tile drainage. A modified Shuttleworth–Wallace equation (Farahani and DeCoursey, 2000) is used to estimate daily or hourly potential evapotranspiration. The soil temperature and surface energy balance modules are interrelated. Soil temperature is updated during infiltration according to heat movement with water infiltration and is calculated by solving the heat equation during redistribution. RZWQM2 can estimate a surface heat flux and surface temperature using either SHAW (Kozak et al., 2007; Yu et al., 2007) or the PENFLUX module (Aiken et al., 1997). Otherwise, soil surface temperature is set equal to air temperature. The soil nutrient module is characterized by its flexibility in simulating soil carbon and nitrogen dynamics in conjunction with soil microbial growth (Shaf-
6
Ma et al.
fer et al., 2000). There are two surface residue pools, three soil humus pools, and three soil microbial pools. Harvested crop residue and applied manure are partitioned between the two surface residue pools based on the C/N ratio. First-order decomposition rates for each organic C pool are assumed, with rate coefficients as functions of soil temperature, soil oxygen concentration, soil C substrate amount, soil pH, and soil moisture. Urea hydrolysis, nitrification, denitrification, and ammonia volatilization are also simulated. RZWQM2 assumes no movement of ammonium unless it is nitrified to nitrate. There is no simulation of mobile organic carbon in the model either. Plants take up both ammonium and nitrate in proportion to their concentrations present in each soil layer. RZWQM2 has a generic plant growth module that can be calibrated for any annual crop, although it has been used mostly for corn (Zea mays L.), soybean (Glycine max L.), and wheat (Triticum aestivum L.). The generic plant growth model has also been calibrated for cotton (Gossypium hirsutum L.) (Abrahamson et al., 2005, 2006). The model also contains the DSSAT4.0 crop growth modules that were calibrated for 22 crops (Ma et al., 2009). When the DSSAT 4.0 is used, RZWQM2 feeds daily soil moisture, soil N, and daily potential evapotranspiration (ET) to the plant modules and then retrieves daily plant N uptake and plant transpiration for its water and N balance calculation (Ma et al., 2005, 2006, 2009). RZWQM2 also has simple algorithms that simulate crop effects on water quality, but not biomass (i.e., Quick Plant, Quick Tree, and Quick Turf). The pesticide module simulates pesticide movement in the soil, as well as pesticide uptake by the plant. The model accounts for both equilibrium and kinetic adsorption as specified by users. Daily degradation half-life of pesticides can also be specified by users and can be modified based on soil pH and soil moisture with depth. At a given soil pH, a pesticide may have a positive, negative, or neutral charge. Plant uptake of pesticide is based on its octanol–water coefficient. Volatilization of pesticide is also simulated (Wauchope et al., 2000, 2004a). The management practices module modifies the soil status and controls the application of irrigation, fertilization, and pesticides; planting and harvest of plants; and crop rotation. Tillage affects soil porosity and bulk density, which in turn changes soil hydraulic properties. It also destroys macropore continuity. A tilled soil will restore to its original bulk density by reconsolidation with subsequent rainstorms and macropore continuity is regenerated. Plant management, such as planting, harvest, irrigation and fertilization, modifies the soil water and C/N status (Rojas et al., 2000). It should be noticed that RZWQM2 cannot do intercropping, only one crop at a given time. The soil chemistry module, rarely used, calculates long-term effects of management on chemical equilibrium of ions and soil pH.
A Protocol for Parameterization and Calibration of RZWQM2 in Field Research
7
Table 1–1. Minimum data required to run RZWQM2. Date type
Minimum data required
Rainfall Daily or hourly weather data Site description Soil properties
Amount and intensity Daily meteorology data (minimum and maximum air temperature, wind run, solar radiation, and relative humidity) Latitude, elevation, longitude, slope Soil horizon delineation, soil texture, and bulk density. Optional soil hydraulic properties: 330- or 100 cm‑suction water content and saturated hydraulic conductivity. General pesticide data such as common name, half‑life , Kd, dissipation pathway Specifying a crop cultivar from supplied database with regional parameters Estimate of dry mass and age of residue on the surface, tillage, irrigation, planting/harvest, fertilization Initial soil moisture contents/water table, temperatures, pH, cation exchange capacity values; initial nutrient model inputs, including soil residue, humus, microbial populations, mineral NO3–N, NH4–N
Pesticide properties Plant Management practices Initial soil conditions
Characterizing the System: Input Data Requirements RZWQM2 needs quantitative information on each part of the system and the interactions among its components. Depending on scientific approaches used in the model, a model like RZWQM2 generally requires (i) weather information, including air temperature, solar radiation, wind speed, relative humidity, rainfall and rainfall intensity; (ii) site description, including slope, elevation, latitude, and longitude; (iii) soil information, including soil bulk density, texture, horizons, hydraulic properties, thermal properties, and chemical properties; (iv) plant information, including plant cultivar characteristics, sensitivity to daylength, phenology, especially thermal units to anthesis and physiological maturity; and (v) management information, including tillage, plant management, irrigation, fertilization, and pesticide applications. Table 1–1 lists the minimum basic information needed to define a system in RZWQM2. Although RZWQM2, like other models, has built-in default databases for soil, plant, and pesticide parameters, it is not possible to use the database alone to simulate a specific experiment or condition with confidence.
Weather Information RZWQM2 has options for either daily or hourly weather inputs. For the daily option, the model needs daily minimum and maximum air temperature (°C), solar radiation (MJ m−2 d−1), daily wind run (km d−1), average daily relative humidity (%, if available), daily total rainfall (mm), and rainfall duration (h). If the
8
Ma et al.
weather station is too far away from the experimental site, measured weather may not reflect local conditions, especially rainfall amount and intensity. If the experimental site is on a sloping surface, aspect of the slope should be provided to calculate solar energy on the surface. For the hourly option, the model needs hourly air temperature (°C), solar radiation (W m−2), wind run (m s−1), relative humidity (%, if available), and rainfall (mm h−1). Rainfall intensity is calculated if hourly or subhourly rainfall is provided or by assuming daily storms of a uniform duration specified by the user. The RZWQM2 user interface also provides a tool to convert daily or hourly rainfall into breakpoint format. The model can also estimate solar radiation if not given based on latitude.??? The weather generator, CLIGEN, is also provided in RZWQM2 for the United States. Performing quality control (QC) procedures for weather input should help improve agricultural system model simulations. Weather QC is often reported for ET research but not for agricultural system model research. Table 1–2 shows changes in yield and biomass in a wheat–corn–millet rotation system with 10% variation in rainfall, radiation, and humidity in a semiarid Colorado conditions. Similar simulation results were obtained with RZWQM2 by Malone et al. (2010) under Iowa conditions. When there is doubt on weather data, it is recommended to check with a nearby weather station or a weather generator (e.g., CLIGEN).
Soil Information Characterizing several physical and chemical properties of the soil component of the system is essential because it is where many of the processes are taking place. Spatial and temporal variability is the main obstacle in characterizing the soil for field-scale modeling. When the field is nonuniform, it should be subdivided into smaller plots and the model run for each plot, instead of using soil parameters measured at one location. However, effective average soil properties may be used (Ahuja et al., 2010). Soil parameters include soil hydraulic properties, soil heat properties, and soil chemical properties. A USDA-NRCS Pedon Soil Properties Database is available for users who do not have any soil information for the study sites. Besides the parameters described below, initial values of soil water content, soil temperature, soil carbon pools, and concentrations of soil chemicals are needed to start the simulation process.
Soil Matrix Hydraulic Properties In RZWQM2, suction head is used to track soil water movement during both infiltration (Green–Ampt equation) and redistribution (Richards’ equation). Thus, there is a need to specify the relationship of soil moisture and soil hydraulic conductivity with suction head. In RZWQM2, slightly modified Brooks–Corey
A Protocol for Parameterization and Calibration of RZWQM2 in Field Research
9
Table 1–2. Change in RZWQM2-CERES simulated grain yield and biomass in a wheat–corn–millet rotation with 10% changes in weather data in Akron, CO.† % Change in weather variables
Yield
Biomass
Rain
Radiation Humidity Wheat
Corn
Millet
Wheat
Corn
Millet
−10 −10 −10 −10 −10 −10 −10 −10 −10 0 0 0 0 0 0 0 0 0 10 10 10 10 10 10 10 10 10
−10 −10 −10 0 0 0 10 10 10 −10 −10 −10 0 0 0 10 10 10 −10 −10 −10 −10 0 0 0 10 10
−11.3 −5.6 1.5 −11.0 −6.5 -−2.9 −12.7 −9.1 −5.8 −3.4 4.4 10.7 −4.9 0.0 5.0 −7.1 −3.3 1.0 5.7 11.9 9.1 20.6 2.0 6.8 13.3 −1.1 3.3
−30.0 −23.6 −16.4 −22.9 −15.1 −6.4 −21.6 −12.9 −3.8 −19.7 −12.0 −4.5 −9.8 0.0 9.7 −5.8 4.1 14.4 −8.9 −1.2 32.7 7.1 4.7 13.6 24.0 10.0 20.1
−37.9 −28.5 −19.4 −32.3 −23.4 −13.1 −31.2 −22.7 −13.0 −17.4 −5.1 5.6 −11.3 0.0 11.8 −10.6 −0.1 11.3 3.9 16.7 34.2 32.4 9.8 22.0 36.2 11.7 22.7
−8.6 −4.1 1.2 −11.5 −7.2 −3.3 −14.5 −11.4 −7.9 −1.5 4.0 8.9 −4.5 0.0 5.0 −8.0 −4.3 −0.5 5.8 10.5 7.3 16.7 2.9 7.1 11.8 −1.8 2.5
−28.0 −22.8 −17.2 −18.5 −12.2 −5.5 −13.4 −5.9 2.2 −19.2 −13.2 −7.4 −7.5 0.0 7.5 1.4 9.8 18.0 −10.2 −4.7 32.2 1.3 4.3 11.1 18.8 15.1 22.9
−10 0 10 −10 0 10 −10 0 10 −10 0 10 −10 0 10 −10 0 10 −10 0 10 10 −10 0 10 −10 0
−38.8 −29.6 −20.5 −32.9 −24.0 −13.7 −31.8 −23.2 −13.6 −18.2 −5.7 4.6 −11.5 0.0 11.6 −10.8 −0.3 11.0 3.7 16.0 33.8 31.7 10.0 21.8 35.8 11.5 22.3
† Simulation was based on Saseendran et al. (2010).
equations are used to relate volumetric soil water content (q) and soil suction head (h) according to Ahuja et al. (2000a) q = qs - l1 h q - qr = B h
-l2
when h < hb when h ³ hb
[1]
where q s and q r are saturated and residual soil water contents (cm3 cm−3), l1 is a constant, hb is the air-entry water suction for the q–h curve (cm), and l 2 is the slope of the log(q)–log(h) curve (dimensionless). By imposing continuity at hb, b
10
Ma et al.
= (q s − q r − l1hb)hbl2. The unsaturated hydraulic conductivity versus suction head [K(h)] is related as K( h) = Ksat h K ( h) = C 2 h
- N1
- N2
when h < hbk when h ³ hbk
[2]
where Ksat is the saturated hydraulic conductivity (h = 0) (cm h−1) and hbk is the air-entry water suction for the K–h curve (cm). N1 and N2 are the slopes of the two segments of the log(K)–log(h) curve divided at hbk. C2 is a constant which can obtained by imposing continuity at hbk, C2 becomes C 2 = Ksat hbk N2- N1
[3]
N2 in RZWQM2 is obtained as N2 = 2 + 3l 2
[4]
The parameters hb and hbk are usually assumed to be equal. Based on soil texture, the RZWQM2 user interface provides a set of default parameters for eleven soil texture classes based on Rawls et al. (1982) (Table 1–3). However, if 1/3 bar soil water content (q 1/3) of a specific soil is known, the default (reference) soil water retention curve will be scaled to the given q 1/3 value (Ahuja et al., 2000a). Users may also choose the option in the interface to use the one-parameter model to derive the Brooks–Corey parameters from the q 1/3 value (Ahuja and Williams, 1991; Kozak and Ahuja, 2005). Whenever possible, independent measured processes should be used to derive these model parameters, such as water infiltration and redistribution data for soil hydraulic properties (Cameira et al., 2005). The RZWQM2 User Interface can also calculate the Brooks–Corey parameters from soil water contents at 1/3 bar (q 1/3) and 15 bar suction (q 15). Default saturated soil hydraulic conductivity (Ksat) is invoked when a soil texture is chosen (Rawls et al., 1982), but the users may enter their own estimated Ksat. Users may have the interface calculate a Ksat from effective porosity using either of the following equations (Ahuja et al., 1989, 2010): Ksat = 764.5(q s − q 1/3)3.29
[5]
Ksat = 509.4(q s − q 1/3)3.633
[6]
where there is subsurface flow (tile flow), lateral Ksat needs to be defined. Users may set it equal to Ksat as initial values.
A Protocol for Parameterization and Calibration of RZWQM2 in Field Research
11
Table 1–3. Soil hydraulic parameter default values based on soil texture (Rawls et al., 1982) Soil texture class
qs
qr
hb
l2
——— cm3 cm−3 ——— cm Sand Loamy sand Sandy loam Loam Silty loam Silt Sandy clay loam Clay loam Silty clay loam Sandy clay Silty clay Clay
0.437 0.437 0.453 0.463 0.501 0.501 0.398 0.464 0.471 0.43 0.479 0.475
0.020 0.035 0.041 0.027 0.015 0.015 0.068 0.075 0.040 0.109 0.056 0.090
7.26 8.69 14.66 11.15 20.76 20.76 28.08 25.89 32.56 29.17 34.19 37.30
q1/3
q15
Ksat
——— cm3 cm−3 ——— cm h−1 0.592 0.474 0.322 0.220 0.211 0.211 0.250 0.194 0.151 0.168 0.127 0.131
0.0632 0.1063 0.1916 0.2334 0.2855 0.2855 0.2457 0.3119 0.3433 0.3221 0.3727 0.3789
0.0245 0.0467 0.0852 0.1163 0.1361 0.1361 0.1366 0.1882 0.2107 0.2214 0.2513 0.2655
21.00 6.11 2.59 1.32 0.68 0.68 0.43 0.23 0.15 0.12 0.09 0.06
Soil Macropore Properties Macropores are large noncapillary soil pores, such as root channels, earthworm holes, and structural cracks. Macroporosity may be measured with a tension infiltrometer at 3 cm water tension or other water tension (Cameira et al., 2000; Malone et al., 2001b) or counting the number of macropores and their diameters directly (Malone et al., 2003) or other methods listed by Ma and Selim (1997). However, there is a possibility that not all the macropores are active during water movement (Malone et al., 2003). The top soil horizons are generally assumed to have cylindrical macropores and the subsoil lateral cracks, although just one type can be accommodated. RZWQM2 requires the following macropore properties for each soil horizon: ·· total macroporosity as volume fraction of soil (cm3 cm−3); ·· dead-end macroporosity as fraction of the total macroporosityaverage radius
of cylindrical macropores (cm) and average width of cracks (cm);
·· a sorptivity-flow correction factor for reducing lateral absorption of water
from macropores to surrounding soil caused by compaction of macropore walls, SFCT (0–1);
·· the number of macropores per unit area and average radius of soil around
a macropore are calculated from the above information inside the model.
It has been observed that not all apparently continuous macropores produce percolate, and some macropores produce only a very small amount (e.g., Quisenberry et al., 1994). Malone et al. (2001b) concluded that percolate-producing continuous macroporosity was an important RZWQM2 parameter for
12
Ma et al.
long-term no-till corn and recommended using one-half of the apparently continuous macroporosity to the 30-cm soil depth. The number of macropores per unit area affects both the maximum flow rate into the macropores at the surface (Poiseuille’s law), lateral water absorption into the soil, and chemical sorption to macropore walls. The radius mostly affects maximum flow rate through macropores and to a lesser extent chemical sorption to macropore walls. Water and chemicals vertically moving through macropores mix and react with a user-defined radial width of the macropore wall. Ahuja et al. (2000a) found this to be about 1 mm for Br exchange. Malone et al. (2001b) called this the effective soil radius (ESR) and found that 0.6 cm produced good simulations for pesticide movement in a silt loam soil in a long-term no-till maize field. The ESR of 0.6 cm was attributable to (i) greater partitioning of pesticide from macropores to macropore walls, partially because of organic lining inside the macropores; (ii) blockage and tortuosity of natural macropores; and (iii) lateral water movement through soil into macropores, rather than just ponded surface water moving into macropores as simulated by RZWQM2 (Malone et al., 2001b; Stehouwer et al., 1993, 1994).
Chemical Partitioning, Degradation, and Chemical Transfer to Overland Flow Chemical sorption to soil may be instantaneous (linear adsorption) or kinetic (instantaneous plus a time-dependent adsorption). The model also simulates pesticide degradation and irreversible adsorption (Wauchope et al., 2004a). For the instantaneous adsorption, the amount adsorbed to soil (S, mg g−1) is expressed as S = KdCs, where Kd (mL g−1) is the partition coefficient, and Cs (mg mL−1) is the chemical concentration in solution. The partition coefficient for various chemicals and soils may be obtained from the literature (e.g., Wauchope et al., 1992) and are supplied with default values in the model. Another way is to directly measure Kd using batch-type procedures (e.g., Roy et al., 1992). Batch procedures combine water, chemical, and soil; then the chemical in water and chemical adsorbed to soil after 24 h of continuous mixing is measured. The Kd is often expressed relative to organic carbon (Koc = Kd/oc), where oc is the mass of organic carbon per mass of soil (g g−1). The kinetic and irreversible adsorptions and pesticide degradation are first order with respect to pesticide concentration in the soil solution. Chemical transferred from soil surface to overland flow and macropore flow by rainfall impact is assumed to occur within the top 2 cm of soil, and contribution decreases exponentially within this depth increment (0–2 cm). This can be expressed as the nonuniform mixing model (Ahuja, 1986) Mavg = e−Bz
[7]
A Protocol for Parameterization and Calibration of RZWQM2 in Field Research
13
where Mavg is the average degree of mixing between rainfall and soil solution at the 1-cm depth increment, B is a nonuniform mixing factor (defaulted to 4.4 cm−1), and z is the center of depth increment (0.5 or 1.5 cm). The chemical is transferred to runoff water at each time increment and may be determined using a mass balance approach (Heathman et al., 1986).
Potential Evapotranspiration and Soil Heat Properties The Suttleworth–Wallace approach is used to calculate potential evapotranspiration (PET) in RZWQM; this is an extension of the Penman–Monteith to partial canopy (Farahani and DeCoursey, 2000). The parameters needed to calculate the PET from the weather data described above are the daily leaf area index (LAI), canopy height, minimum stomatal resistance, and the albedo (reflectance of total solar energy) values of soil, crop residue, plant canopy, and snow. A guideline for soil albedo is provided by Farahani and DeCoursey (2000). Soil albedo varies from 0.05 to 0.45, depending on soil type, surface roughness, organic matter content, soil moisture content, and color (Farahani and DeCoursey, 2000). Usually soil albedo is between 0.1 and 0.3 (Monteith and Unsworth, 2008). High organic matter content and soil moisture decrease albedo. Surface roughness also reduces albedo. In RZWQM2, users may enter albedo at dry (15 bar) and wet (1/3 bar) soil conditions, and the model linearly interpolates albedo between these two extremes. Ranges of albedo for dry soils suggested by Farahani and DeCoursey (2000) are: light sand (0.25–0.45), clay or gray soil (0.25–0.30), dark clay (0.14–0.2), and general dark soil (0.05–0.15). Albedo for crop residue depends on residue type, water content, geometry, and age, ranging from 0.6 for a fresh bright and flat residue to 0.2 as residue ages (Farahani and DeCoursey, 2000). Albedo for plant canopy is around 0.3, ranging from 0.15 to 0.34 and decreases as plant height increases (Monteith and Unsworth, 2008). Range of Albedo for wheat, barley (Hordeum vulgare L.), oats (Avena sativa L.), and corn was listed from 0.20 to 0.26 by Farahani and DeCoursey (2000). Albedo of snow is not a user-defined parameter in RZWQM2 and is calculated based on the density and age of the snow as in the PRMS model (Precipitation-Runoff Modeling System), and it ranges between 0.4 and 0.95 (Gray and Male, 1981). Soil heat properties from de Vries (1963) were used as default values in RZWQM2 with volumetric heat capacity of 0.002 J mm−3 K−1 for sand, silt, and clay, and 0.0025 J mm−3 K−1 for organic matter; and thermal conductivity of 31.7 J mm−1 h−1 K−1 for sand, 10.4 J mm−1 h−1 K−1 for silt and clay, and 0.9 J mm−1 h−1 K−1 for organic matter. For agricultural soils, the contribution of soil organic matter is negligible. Users generally do not need to calibrate these parameters.
14
Ma et al.
Fig. 1–2. A diagram to show the soil C pools in RZWQM2. R14, R23, R34, and R45 are inter-pool transfer coefficients. BM is biomass (from Ma et al., 1998a).
Soil Chemical Properties If salinity and soil pH simulation are not a focus of the study, the equilibrium chemistry module should be disabled. Thus, the only soil chemical properties needed are soil pH, initial soil nitrate and ammonium, and initial soil pesticide concentration. Otherwise, users need to input initial soil anion and cation concentrations, addition of these ions from irrigation and rain water, and soil cation-exchange capacity.
Soil Nutrient Properties Soil N is the only nutrient currently considered in RZWQM2. Since soil organic N (or C) is heterogeneous in nature, RZWQM2 partitions soil organic N into eight pools based on state and C/N ratio of the components: two surface residue pools, three soil humus pools, and three soil microbial pools (Fig. 1–2). Generally, we only know the total soil organic C (or N) content or organic matter (OM), which is the sum of the three humus pools. There is a need to partition the known soil C into the three pools. The user interface provides guidance to do this. In general, a rough partitioning of the total soil organic C among fast, intermediate, and slow humus pools is assumed based on soil type and soil management history. The soil microbial populations are generally initialized by running the model for multiple years (10–12 yr) (Ma et al., 1998a). Where there are less than 10 yr of
A Protocol for Parameterization and Calibration of RZWQM2 in Field Research
15
weather and management information, it is suggested to run the model multiple times with initial conditions reset from the previous run. An option is provided in RZWQM to run the model with constant microbial populations (Ma et al., 2009). When this option is chosen, users should check for annual mineralization rate according to local conditions. If it is too high, more C should be partitioned to the slow pools. If it is too low, more C should be partitioned to the fast or intermediate pools. The RZWQM2 user interface provides a wizard to partition the pools. It is generally suggested not to modify the C/N ratios of the carbon pools. However, if extremely low C/N ratio of manure is used, the interface will automatically lower the C/N ratio of the slow residue pool to that value so that manure will be partitioned correctly between the fast and slow residue pools. Other soil N dynamics parameters should be kept as they are unless there are strong reasons to change them, except for the interpool transfer coefficients that determine the fraction of degraded C transferred to the next less degradable pool. Parameters to delay nitrification due to nitrification inhibitor and anhydrous application may be adjusted for local conditions.
Crop Information Users may choose three types of crop modules: (i) a simple known growth curve approach that may be used to extract water and nutrients from the soil with time, without simulating plant growth (i.e., Quick Plant, Quick Turf, and Quick Tree Modules); (ii) a generic plant growth module that can be used to simulate any annual crop; and (iii) the DSSAT crop growth modules that simulate specific crops. Users are encouraged to select the cultivar characteristics that are most similar to the one they are using and then calibrate the individual cultivar coefficients using observed data. When the crop parameters are calibrated, it is important to use the least stressed treatment, so that the cultivar parameters only reflect the genetic variability, not genotypic by environment (G ´ E) interactions (Boote, 1999). The CSM-CROPGRO model simulates soybean, drybean (Phaseolus vulgaris L.), fababean (Vicia faba L.), velvetbean (Mucuna pruriens L.), cabbage (Brassica oleracea L.), chickpea (Cicer arietinum L.), cowpea [Vigna unguiculata (L.) Walp.], peanut (Arachis hypogaea L.), pepper (Capsicum annuum L.), tomato (Lycopersicon esculentum Mill.), bahiagrass (Paspalum notatum Flügge), brachiaria spp., cotton, and canola (Brassica napus L.). CSM-CERES simulates triticale (´ Triticosecale Wittm.), wheat, corn, sorghum [Sorghum bicolor (L.) Moench], barley, proso millet (Panicum miliaceum L.), pearl millet (Pennisetum glaucum L.), and foxtail millet [Setaria italica (L.) Beauv.]. Simulations of these crops are achieved by specifying the species, ecotype, and cultivar-specific developmental and growth traits. Coefficients of
16
Ma et al.
base and optimum temperatures for developmental processes (rate of emergence, rate of leaf appearance, and rate of progress toward flowering and maturity) and growth processes (e.g., photosynthesis, tissue composition, growth and maintenance respiration, nodule growth, N fixation, leaf expansion, pod addition, seed growth, N mobilization) are provided through the species file. The species parameters are not recommended to be changed when developing the coefficients for a new cultivar (Boote, 1999). Within a given species, there may be a group of cultivars that share similar characteristics. Parameters related to each group of cultivars are included in the ecotype files of each crop. The most critical parameters that define the unique characteristics of a cultivar are included in the cultivar file and can be modified through calibration. These parameters determine the vegetative and reproductive stages, yield components, and leaf appearance rate (Jones et al., 2003). The DSSAT model provides a database of cultivar parameters for the crops and cultivars determined in previous modeling studies. The user should select parameters of a cultivar closest to his/her crop cultivar for the starting value of each parameter. Depending on the crop module selected in RZWQM2, observed plant data required for calibration might be different. If the simple plant growth curve approach is used, the user should provide maximum LAI, maximum rooting depth, amount of crop residue and root returned to the soil and their C/N ratios, and seasonal N uptake. When the generic plant growth model is chosen, final crop yield and biomass, anthesis and maturity dates, LAI, and plant height are needed. For parameterizing cultivars for the DSSAT model, more detailed plant information, such as flowering date, maturity date, number of leaves, yield, and yield components, is needed (Table 1–4). Of course, additional measurements of biomass and LAI during the growing seasons are helpful.
Management Information Agricultural management practices are the interface between humans and nature. Users need to specify exactly what has been done to the field, in terms of tillage, irrigation, fertilization, planting, harvest, and pesticide application. Rule-based management practices include auto-irrigation based on soil moisture depletion ET requirement, or fixed dates, autofertilization based on leaf chlorophyll content and soil N test, and autoharvest based on maturity date. The RZWQM2 user interface facilitates inputs of these managements. In RZWQM2, implemented management practices are recorded in a file (MANAGE.OUT) and users should check this file to make sure all management practices are implemented as intended. Some exceptions to management inputs
A Protocol for Parameterization and Calibration of RZWQM2 in Field Research
17
Table 1–4. Data required to calculate crop genotype coefficients (from Hunt and Pararajasingham, 1994). Crop
Required data
Grain legumes (e.g, soybean, peanut)
flowering date maturity date seed yield pod yield biomass at maturity seed number/m2 number of seeds per pod seed size
Maize
silking date maturity date grain yield biomass at maturity grain number/m2 grain number per ear grain/kernel size
Wheat
anthesis date maturity date grain yield (dry) biomass at maturity grain number/m2 grain number per spike grain dry weight
are default tillage and irrigation during fertilization. For example, when NH3 anhydrous injection is prescribed, the model will automatically add a tillage event for NH3 application on that day. When fertigation is prescribed but without irrigation on that day, the model will add a 1-cm irrigation event. When fertilizer is incorporated without a tillage event, the model will assume that it is field cultivator. When auto-irrigation is used, the model also records when and how much water is applied each day, to meet the prescribed rules of irrigation according to time interval, soil water depletion, or reference ET. Scheduled management practices may be delayed when the soil surface moisture is above the management soil moisture threshold. Plant management includes planting density (seeds ha−1), row spacing (cm), planting depth (cm), method of planting (seeds, transplant, and pregerminated), time of harvest, harvest efficiency, type of harvest (seeds, biomass, or root). Irrigation management includes type of irrigation (sprinkler, flood, and
18
Ma et al.
drip), application rate (cm h−1), and amount (cm). Fertilizer management includes methods of application (surface broadcast, surface incorporated, injection, fertigation, and best management practices), and NO3 –N, NH4 –N, and urea-N amounts. Information on organic waste and bedding materials are needed in terms of amount and C/N ratios for manure management. Tillage is defined by commonly used names, but users may modify the tillage depth and intensity. Pesticides can be applied based on crop stage as preplanting, pre-emergence, post-emergence, after harvest, and on a specific date, and by the way of surface broadcast, surface incorporated, foliar application, with irrigation water, and in slow-release forms. There is a pesticide database available in RZWQM (Wauchope et al., 1992). Users may modify or calibrate these parameters, including washoff fraction from plant canopy or crop residue, adsorption constant (Koc), half-lives for kinetic desorption, degradation, and irreversible bound adsorption. Fraction of kinetic adsorption is another parameter needing to be specified. In preparing experimental data for model calibration, users may organize their data for convenient automatic comparison with simulation results. This can be done by entering experimental data in the A and T files (e.g., *.MZA and *.MZT) if DSSAT crop growth modules are used or the EXPDATA.DAT file in RZWQM2. Users are also encouraged to develop an easy way to post-process the simulation results for quick comparison using Microsoft Excel or an equivalent for graphing and statistical analysis. Consult the user’s manual released with RZWQM2 or DSSAT4.0 on how to use these files.
Model Calibration
General Considerations
After a system is characterized with the best available information, the next step is to run the model and check if the results are in reasonable agreements with the observed data for different parts of the system. Field-measured data are needed to verify model outputs at this stage. Basic field measurements are soil moisture, evapotranspiration, leaf area index (LAI), phenology at main growth stages, and soil inorganic N, crop biomass, yield at harvest, and total N uptake at harvest. Surface runoff is desirable when runoff may affect soil water balance. When there is subsurface tile flow, measurements should be available along with water table depth. Yield components are important for calibrating the DSSAT4.0 crop models (Table 1–4). Where there is damage due to pests, flood, or hail, users should not use these data for model calibration because RZWQM2 does not account for these effects.
A Protocol for Parameterization and Calibration of RZWQM2 in Field Research
19
Users should first select a dataset for model calibration and the rest for model evaluation. A calibration dataset could be a treatment in one or multiple years (Hu et al., 2006; Saseendran et al., 2010; Fang et al., 2010b) or one or multiple treatments in single year (Ma et al., 2003; Saseendran et al., 2004, 2005a; Sophocleous et al., 2009). When multiple years of data are used for calibration, the data should include wet, average, and dry years (Moriasi et al., 2007). Calibration should also start with a sensitivity analysis followed by manual or automated adjustment of parameters (Moriasi et al., 2007; Sophocleous et al., 2009). Our experience with RZWQM2 has shown that the calibration should be in the order: soil water, soil nutrients, plant growth, and pesticide, and then iterated a couple of times (Hanson et al., 1999), although Cameira et al. (2007) iterated parameterization in the sequence: soil water, plant growth, evapotranspiration, soil nutrient, and pesticide. Before adjusting any parameters, a thorough examination of the inputs and outputs is essential, including mass balance of water, N, and other chemicals (e.g., MASSBAL.OUT, MBLNIT.OUT, MBLWAT.OUT, MBLP*.OUT), soil water and N processes, and plant growth. The RZWQM2 user interface can also facilitate summarizing model output at various temporal resolutions. When there are multiple treatments, it is a good practice to run all the treatments and examine the results before parameter calibration. This will provide users possible clues to which parameters need adjustment. Questions to be asked at this stage are: ·· Are total rainfall and irrigation amounts correct in the water mass balance? ·· Are fertilizer/manure inputs correct in the N balance file? ·· Are pesticide amount correct in the pesticide balance file? ·· Are all the management practices implemented correctly? ·· Are initial soil water, soil nutrients, and soil chemical status correct? ·· Are all soil water components reasonable even if there are no measurements? ·· Are all soil N components reasonable even if there are no measurements? ·· Are crop phenology, yield, and biomass reasonable even if there are no
measurements?
·· Are soil chemicals (e.g., pesticides) reasonable?
Table 1–5 lists the processes or variables that users should look at before calibration so that the appropriate process or parameters can be identified and calibrated. It is desirable to complete the table for all simulation runs. It is common for users to focus on one or a few system components and ignore the rest, which can contribute to inappropriate parameterization and result in “good results” for “the wrong reasons.” Model users should be more sensitive to any irregularity in simulation results in all components, not only those with field measurements. Once the modeler is satisfied with the general simulation of all
20
Ma et al.
Table 1–5. Processes and variables that should be checked in system model outputs. Annual or total soil N balance Initial soil N (organic and inorganic) End of simulation soil N (organic and inorganic) N loss to runoff/erosion N loss to leaching N loss to denitrification N Inputs (crop residue, fertilizer, and manure) Annual N mineralization Annual or total plant N balance Total N uptake N in root N in grain N in biomass N returned to soil at harvest N fixation Annual or total water balance Initial Soil water End Soil water Runoff Seepage Evapotranspiration Subsurface drainage (tile flow) Water Inputs (rain, irrigation, water table) Annual or total soil chemical balance Initial amount End amount Chemical loss to runoff Chemical loss to leaching Chemical loss to air Chemical loss to tile flow Chemical Input
system components, he or she can then focus on the processes or variables that have measured values available for comparison. Table 1–6 lists the choice of parameters and variables for calibration of the major processes and outcomes in an agricultural system. Usually, the weather data are inputs and by default should be correct, although they can contain errors as well (Malone et al., 2010). Generally, no adjustment to the weather files is needed unless there are questions, such as rainfall intensity and solar radiation. When rainfall duration needs to be adjusted to match runoff, it should be noted that extended rainfall duration may affect plant growth because water uptake is not simulated during rainfall events in RZWQM2. Management practices also should be fixed inputs and should be known before running the model. If crop management information is not available or incomplete, such as the dates and amount of irrigation, one should not
A Protocol for Parameterization and Calibration of RZWQM2 in Field Research
21
Table 1–6. Choice of parameters and variables to be considered for calibration for various processes or outcomes. Processes or outcomes to calibrate
Related parameters or variables
Soil water dynamics
Brooks–Corey parameters, especially q1/3 and q15, pore size distribution (l2), bubbling pressure, N2, and Ksat, bulk density or porosity, water inputs to the soil and losses from the soil including plant water uptake Ksat at surface layer, rainfall intensity, presence of macropore flow, and surface crusting Ksat and lateral Ksat, tile spacing and depth, lateral flow below tile controlled by a lateral hydraulic gradient, drainable porosity (porosity q1/3) and water table leakage rate Ksat at lower soil layers, tile flow amount, lateral flow below the tile lines, and leakage rate Albedos, residue cover, LAI simulation, stomatal resistance, rooting depth
Runoff Tile flow
Water table fluctuation Evapotranspiration Water uptake N uptake
Annual N mineralization
Soil inorganic N (NO3 and NH4) dynamics Plant development Plant biomass accumulation Plant yield formation
Rooting distribution
Pesticide processes
PET, rooting depth, soil moisture, q1/3 and q15, Ksat by layers, soil root growth factor (SRGF) N supply from soil, N demand from daily plant growth as defined by N concentrations in each tissue, passive uptake through transpiration and active uptake parameters Soil C pool partitioning, interpool transfer coefficients, crop residue returned to the soil, decomposition rates of each pool if needed, and tillage to mix crop residues Plant N uptake, N leaching, denitrification, volatilization, nitrification, and hydrolysis rate constants, and N applications and methods Thermal or minimum days between growth stages Daily photosynthesis, length of vegetative growth, plant water/N stresses, and rooting depth Parameters related to yield formation, such as maximum kernel number, kernel weight, daily partitioning of biomass to yield (generic growth model), grain filling duration and rate, length of reproductive growth, plant water/N stresses. Maximum rooting depth, relative SRGF in each layer, and partitioning of photosynthate to root (generic growth model) Adsorption constant, kinetic adsorption, macropore flow, volatilization, runoff loss, leaching loss, and plant uptake
proceed with model calibration unless the dates are obtained with reasonable confidence. Practical issues such as spatial and temporal variability in the field (e.g., soil heterogeneity, uneven irrigation and fertilization, planting density) need to be dealt with separatelyModel calibration usually starts with unknown or less certain parameters for the experiment. For example, soil hydraulic conductivity is usually not measured in field research. Thus, it is reasonable to calibrate Ksat within a certain range. It is better not to change the non-site-specific default
22
Ma et al. Fig. 1–3. Procedures for calibrating the N submodel of RZWQM (Hanson et al., 1999)
parameters suggested by model developers unless there is a strong reason to do so. When there are multiple measurements of an input parameter, users may need to develop an average value or run the model multiple times and then average the model outputs. If the users do not know the implications of changing a parameter, a sensitivity analysis of the parameter may help (Boote et al., 2008; Ma et al., 1998a). Sensitivity analysis works best when there are multiple treatments. Longer term simulations may also be needed to check system stability for some outcomes such as soil C/N changes (Fig. 1–3). Soil water should be calibrated first, followed by soil nutrient and plant growth. Since pesticide is only affected by water and does not affect soil nutrient and plant growth in RZWQM2, it should be calibrated after the soil water–soil nutrients–plant growth calibration. However, because of the interaction among the model components, an iterative procedure should be used. Both the automated calibration procedure of PEST (Parameter Estimation Software; Doherty, 2010) and use of Latin Hypercubic Sampling (LHS) to identify realistic parameter sets for RZWQM2 have shown promise, but more research in this area is needed (Nolan et al., 2010; Fang et al., 2010a). These procedures face challenges from the difficulty in defining an objective function that optimizes interdependent processes. High intercorrelation can cause “nonuniqueness” issues, where different combinations of parameters result in the same objective function minimum. However, inverse modeling with PEST is an efficient and effective means of identifying highly correlated and insensitive parameters, which can be handled appropriately during the calibration process. For example, singular value decomposition in PEST can mitigate effects from highly correlated and insensitive parameters (Nolan et al., 2010). In addition, optimized parameters should be constrained to have physical and biological meanings, and a combined manual and automatic method may be more effective (Boyle et al., 2000). One important, but less discussed, issue in model calibration is how to quantify the goodness of a calibration. In most cases, a model is considered well
A Protocol for Parameterization and Calibration of RZWQM2 in Field Research
23
calibrated if it responds to management practices with reasonable accuracy in terms of root mean squared error (RMSE), relative biases, model efficiency, coefficient of determination (r2), and the D index (Ahuja and Ma, 2002). For a data set with M measured points, RMSE is defined as N
RMSE =
å wi (Pi - Oi )2 i=1
N
[8]
where wi is the weight factor often set equal to 1.0, and Pi and Oi are the model predicted and experimental measured points, respectively. The N observed data points may be from one treatment or multiple treatments (Ma and Selim, 1997). The RMSE reflects a magnitude of the mean difference between experimental and simulation results. A normalized objective function (NOF) or relative RMSE (RRMSE) may be calculated from RMSE as (Ma et al., 1998b) RMSE Oavg
NOF =
[9]
where Oavg is the averaged observed value. NOF = 0 indicates a perfect match between experimental and modeling results. NOF < 1 may be interpreted as simulation error of less than one standard deviation around the experimental mean. A similar measure is the mean absolute error (MAE): N
MAE =
å i=1 Oi - Pi N
[10]
Another index is the mean bias error (ME) (Shen et al., 1998): N
ME =
å ( Pi - Oi ) i=1
N
[11]
The value of ME indicates whether there is a systematic bias in the prediction. A positive value means an overprediction, and a negative value indicates an overall underprediction. Another commonly used approach is to conduct regression analysis between measured and predicted outputs. A coefficient of determination (r2) is then calculated as
2
r =
é N ê ê å Oi - Oavg ëê i=1
(
N
)(
2 N
ù2 Pi - Pavg úú ûú
)
å ( Oi - Oavg ) å ( Pi - Pavg ) i=1
i=1
2
[12]
24
Ma et al.
The r2 value ranges from 0 to 1. r2 = 1 indicates a perfect correlation between experimental and simulation results, and r2 = 0 means no correlation between the two results. The r2 approach alone can be misleading, as it does not account for a systematic bias. Some model users simply use the percentage difference between simulated and measured results as a criterion for goodness of model parameterization (Hanson et al., 1999). Wu et al. (1996, 1999) used three other statistical indices to compare RZWQM simulation results with measured ones. They are the maximum difference (MD), the Nash–Sutcliffe modeling efficiency (EF) (Nash and Sutcliffe, 1970), and the D index (Willmott, 1981), which are defined by: MD = max Pi - Oi
N i=1
N
EF = 1.0 -
å ( Oi - Pi )
[13] 2
i=1 N
å ( Oi - Oavg )
2
[14]
i=1
N
D = 1.0 -
å ( Oi - Pi ) N
i=1
å( i=1
2
Pi - Oavg + Oi - Oavg
)
2
[15]
EF is a measure of the deviation between model predictions and measurements in relationship to the scattering of the observed data. EF = 1 indicates a perfect match between simulation and observed results. The D index is similar to EF but more sensitive to systematic model bias. It also has values ranging from 0 to 1, where D = 1 means perfect simulation. A slightly different version of MD is to add all the absolute differences between the simulated and observed results (Johnsen et al., 1995). Loague and Green (1991) used a coefficient of residual mass (CRM):
CRM =
N æ N ö ççç å Oi - å Pi ÷÷÷ çè ÷÷ø i=1 i=1 N
[16]
å Oi i=1
The coefficient of residual mass (CRM) tests more integrated values. It may be used for chemical load to groundwater. Malone et al. (2010) used two other statistics in evaluating RZWQM. One is the percent bias (PBIAS) and the other is the ratio of RMSE to the standard deviation of measured data (RSR):
A Protocol for Parameterization and Calibration of RZWQM2 in Field Research N
PBIAS =
25
1
å N ( Oi - Pi ) 100 i=1
N
å Oi
[17]
[18]
i=1
N
RSR =
1
å N ( Oi - Pi )
2
i=1
N
1 O - Oavg N i
å ( i=1
)
2
Multiple statistics should be used in model calibration to avoid biases (Moriasi et al., 2007). Another issue with agricultural system models is balancing the goodness of simulation among various components of the system, such as soil water, soil N, and plant growth. Efforts to improve one component may worsen the simulation of others, which is mainly due to the interdependence of calibrated model parameters. Given that all field experiments have uncertainty in the data collected, a model should not be overcalibrated for one component; rather, model users should strive for balanced simulation of all the components. The goodness of model parameterization is quantified by some statistical indices (e.g., root mean squared deviation) and further judged by model prediction for other experimental conditions, including different soils, weather, and treatments (Ahuja and Ma, 2002). When a composite statistical index is used for optimization (e.g., PEST), users should pay more attention to the weight factor assigned to the statistics of each variable (Nolan et al., 2010). What is considered “acceptable” for a model calibration may vary with the objective of the study and experimental errors in the field. It is certainly acceptable when simulation error is within the experimental error of the replicates (Cameira et al., 2007). When treatment effects are the main objective, a model may be considered acceptable when it responds correctly to the differences among treatments (Cameira et al., 2007; Ma et al., 2007b). Moriasi et al. (2007) rated model performance as acceptable when r2 > 0.5, EF > 0.5, −25 < PBIAS < 25, and RSR < 0.7 for watershed models. However, the rating may vary with output variables and time and space resolution, and it should vary according to the uncertainty in measured data (Moriasi et al., 2007). For a point model like RZWMQ2, it is preferred to use a more stringent rating, such as r2 > 0.8, EF > 0.7, −15 < PBIAS < 15, and RSR < 0.5. Based on simulation data from Saseendran et al. (2010), the D index should be greater than 0.7 for an “acceptable” calibration. Qi et al. (2011) recommended both r2 and D of 0.65 as “satisfactory,” 0.8 as “good,” and 0.9 as “very
26
Ma et al.
good.” For pesticide simulation, a PBIAS of 100 may be considered “acceptable” due to large experimental errors (Malone et al., 2004b). Graphical presentation of the simulated and observed results should also be used for visual comparison and is essential for model calibration (Loague and Green, 1991; Legates and McCabe, 1999; Moriasi et al., 2007). Among the above-mentioned statistics, RMSE (or MAE) is the most unbiased model comparison, whereas r 2 and the D index tend to make mediocre models look good because of their high values (Legates and McCabe, 1999). If RMSE or MAE is within 10% of the measured mean values for all measurements, it is a “very good” calibration. A value of 15% is considered “good” and 20% is “satisfactory” for agricultural models. Hanson et al. (1999) recommended 15% error for biomass, yield, and leaf area index (Cameira et al., 2005). The following two modified, but more conservative statistics proposed by Legates and McCabe (1999) have not been used much in the literature, however. N
EF1 = 1.0 -
å
i=1 N
å
i=1
Oi - Pi
[19]
Oi - Oavg
and N
D1 = 1.0 -
å N
å( i=1
i=1
Oi - Pi
Pi - Oavg + Oi - Oavg
)
[20]
Calibrating Soil Water Parameters Accurate simulation of the soil water balance is critical for any agricultural system model. Obtaining average effective soil hydraulic properties for a site is often more difficult due to spatial and temporal variability and uncertainty in soil horizons (Ahuja et al., 2010). In addition, it is rare for an experimentalist to measure representative soil hydraulic properties for a given field with confidence. Due to spatial variability, laboratory measured soil hydraulic properties from a few samples may not be representative of the entire field, not to mention the hysteresis behavior in the field. While we suggest the use of locally field measured soil hydraulic properties if available, the soil hydraulic properties based on soil texture class (Table 1–3) may be sufficient in many general applications (e.g., Saseendran et al., 2009). However, some calibration may be needed for specific situations.
A Protocol for Parameterization and Calibration of RZWQM2 in Field Research
27
Fig. 1–4. Recommended calibration steps for soil water in an agricultural system.
The variables to calibrate for soil water balance are soil moisture content, ET, runoff, deep seepage, water table if present within the simulated soil profile, and subsurface flow (tile flow) if measured (Fig. 1–4). Even though there are no measured data for some of the water components, it is still a good practice to review them to make sure that they are reasonable for the soil and climate. Depending on the purpose and data availability, users may aggregate temporal simulated
28
Ma et al.
results to daily, monthly, or yearly values, and soil depth results to soil horizon or whole soil profile.
Soil Moisture Distribution If there are soil moisture measurements in the experiment, they should be compared first. If not well simulated, users should check water inputs (rainfall and irrigation) first to make sure the inputs are correct. Then, review water outputs from the system (ET, runoff, drainage). 1.
If measured soil hydraulic property is not available, calibrate the soil water contents at 1/3 bar and 15 bar suction (also known as the drained upper limit and lower limit of plant available water). The model can then calculate the Brooks–Corey parameters from these values. These two soil moisture contents also affect plant water uptake when DSSAT crop growth modules are selected.
2.
For experienced users, adjusting l 2 and Ksat of appropriate layers should also help water distribution. l 2 can be adjusted through q 1/3 based on the one-parameter model (Ahuja and Williams, 1991). However, if l 2 is adjusted, make sure the continuity of the Brooks–Corey equation is maintained at the bubbling pressure head (hb) in Eq. [1] (RZWQM2 user interface can help check the continuity). In RZWQM2, the slopes for both soil water retention curve and hydraulic conductivity curve are related by Eq. [4], which is commonly assumed, but may not be the case for some soils (Malone et al., 2004b) (Fig. 1–5). The RZWQM2 user interface provides four different methods of calibrating soil hydraulic properties.
3.
Surface soil moisture can be affected by ET and surface runoff. Check ET and runoff simulations. If needed, adjust soil albedo or add surface crusting for better simulation. Leaf area index contributes to ET simulation as well. When runoff is too high or too low, adjust rainfall intensity if not measured or Ksat of surface layer.
4.
Soil moisture at lower horizons is affected by root distribution and depth. However, soil hydraulic conductivity and soil water retention curves (the Brooks–Corey parameters) are definitely the most important parameters controlling the soil water distribution.
5.
If there is macropore flow, macropore flow should be activated and macropore parameters need to be looked at.
6.
Fraction of field saturation may be used when full saturation in the field is not obtained.
7.
Heterogeneity of field soil moisture measurement should also be taken into account (including row vs. interrow). It is reasonable to vary the soil properties within the experimental error or spatial variability (e.g., soil bulk density). Temporal variability can also contribute to the accuracy of measured hydraulic properties, depending on when the samples are taken (e.g., before or after tillage, before or after rainfall).
A Protocol for Parameterization and Calibration of RZWQM2 in Field Research
29
Fig. 1–5. Comparing soil water content simulations using Eq. [4], N2 = 2 + 3l2 and N2 = 2 + l2 (Malone et al., 2004a).
8.
Another important aspect is soil horizonation. A poor simulation may reflect an error in the definition of soil horizons in terms of soil bulk density and soil texture. If simulated soil moisture in a particular layer is too high, more roots should be grown in that layer. This can be accomplished by adjusting the root distribution parameters in the model (maximum rooting depth in the generic model and SRGF in the DSSAT crop models).
Evapotranspiration In RZWQM2, potential evapotranspiration (PET) is estimated using the Shuttleworth–Wallace method, and actual root water uptake is either from the Nimah–Hanks equation when the generic plant growth module is invoked or from an empirical equation when the DSSAT crop growth modules are used. 1.
When actual ET is not simulated correctly, PET should be checked first to make sure that weather inputs (radiation, wind speed, relative humidity) and soil albedo and the minimum stomatal resistance are correct. Table 1–7 shows reference PET for different weather regions, which should be the upper boundary for the PET calculated in RZWQM2.
2.
Examine the water balance output files to see each component of soil water balance, including runoff and soil water storage in the soil profile. If one of them is not reasonable, correct that component.
30
Ma et al.
Table 1–7. Average reference evapotranspiration for different agroclimate regions (Allen et al., 1998). Mean daily temperature (oC) Region
Cool 10 oC
Moderate 20 oC Warm 30 oC
—————————————— mm d−1 ———————————— Tropic and subtropics Temperate region
humid and subhumid arid and semiarid humid and subhumid arid and semiarid
2–3 2–4 1–2 1–3
3–5 4–6 2–4 4–7
5–7 6–8 4–7 6–9
3.
Since LAI and canopy height enter into the calculation of PET, plant growth needs to be checked as well, including rooting depth. Soil moisture content and root length density distribution are important to check when actual simulated ET is not adequate.
4.
Hydraulic conductivity is used in the Nimah–Hanks water uptake equation, and the lower limit of plant available water (15 bar soil moisture content) is used for water uptake in DSSAT. These two parameters should be reviewed along with their roles in other simulations in the system (e.g., soil water distribution and plant growth).
5.
Surface crop residue cover should be included if it exists.
Surface Water Runoff In RZWQM2, runoff occurs when rainfall or irrigation intensity exceeds the infiltration capacity. Therefore, rainfall or irrigation intensity should be accurate if runoff is an objective of model simulation. Surface water detention (surface roughness) is not simulated. 1.
Increasing Ksat of the surface horizon will reduce runoff. Adding surface crusting and reducing Ksat in crusting soil layer will increase runoff.
2.
Tillage temporarily changes soil hydraulic properties and can affect runoff for a short time until the surface layer reconsolidates.
3.
Macropores, if present, can greatly increase infiltration and decrease runoff. Macroporosity and the macropore dimension determine the flow capacity by Poiseuille’s law, so users need to pay attention to these when macropore flow is invoked and runoff is simulated poorly.
4.
Currently, the soil slope does not affect surface runoff in RZWQM2.
Deep Seepage Deep seepage is obviously affected by Ksat and soil water retention (especially the l 2 and q 1/3). Plant root water uptake will reduce deep seepage. 1.
Reducing Ksat, a smaller l 2, and higher q 1/3 also reduce deep seepage.
A Protocol for Parameterization and Calibration of RZWQM2 in Field Research
31
2.
Rainfall or irrigation intensity and runoff should also be estimated reasonably when their actual value is unknown for better simulation of deep seepage.
3.
Reduction of field saturation during infiltration caused by air entrapment in the soil also affects deep seepage, as it reduces Ksat (Ahuja et al., 2000a).
4.
Macropore flow helps direct more water into the soil and reduce runoff loss.
5.
Increased plant water use and evaporation reduces deep seepage.
Subsurface Drainage Subsurface drainage (i.e., tile flow) is affected by water table simulation and LKsat (lateral Ksat). Drainage spacing and depth are important parameters for estimating subsurface drainage in the Hooghoudt’s steady state equation in RZWQM (Ahuja et al., 2000a). 1.
First, water table simulation should be evaluated.
2.
Field capacity (or q 1/3) and the l 2 (slope of the log-log soil water retention curve) are also important in determining tile flow amount (Bakhsh et al., 1999) because they control how fast water moves through the restricting layer to refill the saturated soil zone.
3.
The leakage rate of water table and lateral hydraulic gradient have a major effect on maintaining the water table and partitioning water between tile flow and groundwater lateral flow.
4.
Calibrating lateral K sat for each soil layer may be needed for correct tile flow simulation.
5.
Check on ET and runoff to verify the correct amount of water entering the water table.
6.
Reducing deep seepage and lateral flow below the tiles helps maintain a water table and consequently increasing tile flow if needed.
7.
Calibrating Ksat may help refill water table, but should be done in context with other water components.
Water Table Hydraulic conductivities at the bottom of the soil profile and water leakage rate through the restricting layer, if present, are important for building a water table. Subsurface groundwater flow also affects water table fluctuation. RZWQM2 simulates quasi-steady-state lateral flow to account for groundwater flow beneath the tile lines. 1.
Make sure a constant flux boundary condition is used at the bottom of the soil profile, and field saturation fraction is set to 1.0. Otherwise, the model may not simulate soil water saturation correctly.
32
Ma et al.
2.
Increasing the lateral flow component by increasing lateral hydraulic gradient reduces both the water table level and tile flow amount. However, the lateral flow component only directs excess water out of the system, not water from adjacent plots flowing into the system.
3.
Increasing Ksat directs more water into the soil profile and increases the water table.
4.
Make sure the water table is within the defined soil profile at all times during simulation.
5.
Reducing the leakage rate helps build up a water table too.
Calibrating Water and Chemical Movement through Macropores if Present In heavy-textured soils, there may be a need to activate and parameterize the macropore flow. The first step is to use parameters that are reasonably estimated from the literature. These include the reduction factor (SFCT = 0.1), effective soil radius (ESR = 0.6), and nonuniform mixing factor (B = 4.4 for tilled and 6.0 for no-till) (Malone et al., 2003). The number of percolate-producing continuous macropores may increase with increasing initial soil water, but the number of macropores between 0.01 and 0.04 cm−2 has been used for several soils without a clear difference among tillage methods (Malone et al., 2003). 1.
Since rainfall intensity determines the amount of water available for macropore flow, check rainfall intensity and Ksat.
2.
Macroporosity, fraction of dead macropores, dimension of macropores, and lateral sorptivity reduction factor should be calibrated for the soil first in the order for obtaining correct water flow through macropores.
3.
The ESR value of 0.6 by Malone et al. (2001b) was reasonable for several subsequent macropore simulations (Malone et al., 2003, 2004b), but can be calibrated if needed. The ESR affects only the chemical transport through the macropores.
4.
Individually adjusting macropore radius (rp), Ksat, and surface crust hydraulic conductivity by about 50% resulted in metribuzin transport in percolate (macropore and matrix flow) to vary by 100% or more (Malone et al., 2004b).
5.
Pesticide transport through macropores is very sensitive to soil parameter changes, such as surface crust hydraulic conductivity, Ksat, and l 2.
6.
The nonuniform mixing factor (4.4) may be adjusted when chemical extraction from the soil is thought to be a contributing factor. However, chemical concentration in the top soil layer should be checked before the mixing factor is adjusted.
7.
Absorption of chemicals to the macropore walls may be reduced and chemical in tile flow increased by allowing a fraction of the chemical entering to tiles directly without any exchange with the maropore walls.
A Protocol for Parameterization and Calibration of RZWQM2 in Field Research
33
Calibrating Soil Temperature and Surface Energy Balance Surface temperature is determined by water movement, solar energy, partitioning of the surface energy, soil heat capacity, and soil thermal conductivity. RZWQM2 calculates soil heat capacity and thermal conductivity based on soil texture and soil moisture content. The effect of soil organic matter on soil heat transfer is not considered in the model. Therefore, it is important to know the soil texture in each soil horizon and have correct soil moisture simulations. 1.
Since soil thermal property is determined by soil texture, make sure soil texture for each layer is correct.
2.
Check on soil moisture simulation and soil water balance before adjusting soil thermal properties. Low surface soil moisture simulation tends to result in high surface temperature.
3.
When transpiring plants are present, soil water content within the root zone becomes important, with inaccurate water contents having similar effects as in the bare soil situation.
4.
Albedo of the soil surface, residue, and canopy cover should be checked to make sure that they are within reasonable ranges, especially when there is residue and canopy covering the soil surface.
5.
If needed, the PENFLUX or SHAW option may be used to calculate the top boundary condition for surface temperature via soil surface heat flux calculation, rather than assuming it equals air temperature.
6.
When hourly air temperature is available as input, it should be used in soil temperature and surface energy balance calculations. The model can also convert daily weather inputs to hourly if desired.
7.
The amplitude of the diurnal soil temperature variation will be influenced not only by soil water content, but by residue and plant cover. Insufficient plant and residue cover will cause simulated midday soil temperatures to be lower than when there is plant and residue cover to shade and insulate the soil surface in the winter; the reverse trend will be simulated in the summer.
8.
When there is a problem in partitioning net shortwave and longwave radiation among latent heat (associated with ET), sensible heat, and soil heat flux, then the ET calculation and albedo should be re-evaluated. When the SHAW option for energy balance is invoked, energy components
should be checked and calibrated. The latent heat is determined by ET and is affected by LAI, soil moisture, plant height, albedo, rooting depth, and net radiation (Rn). Latent heat and sensible heat should be calibrated together. Net radiation may be calibrated by albedo and LAI. Surface soil heat flux (G 0) is affected by surface residue, canopy cover, and soil albedo.
34
Ma et al.
Calibrating Soil Nutrient Parameters Nitrogen Distribution in the Soil Profile Soil N contents and distribution are affected not only by soil water movement, but also by the soil C/N dynamics and plant N uptake. Plant N uptake from each layer is an important factor. Therefore, it is very difficult to simulate N distribution in the soil profile correctly. 1.
Soil water balance should be checked first when N distribution in the soil profile is not adequate.
2.
Overall soil N balance in the soil should be evaluated at this point to identify any unreasonable components, such as NH3 volatilization, N leaching, or denitrification. If volatilization is too high, the volatilization constant may be reduced. Changing fertilization application method from broadcast to injection or surface incorporation also reduces volatilization, so the appropriate method should be specified. Fertigation (fertilizer application with irrigation water) will leave NH4 on the soil surface because NH4 is assumed to be immobile in the soil.
3.
Nitrogen supply from fertilizer and soil organic N mineralization should be checked, followed by plant N uptake (Fig. 1–6). If all three are simulated reasonably well, but N distribution in the soil profile is still not good enough, the user should try to adjust the nitrification rate or activation energy to reduce or increase nitrification. When urea is applied, urea hydrolysis rate constant may need to be modified for the condition. These parameters are in the detailed soil C/N parameters screen in RZWQM2 user interface. It is also essential to run the model for 10 yr to initialize the soil organic pools for a reasonable mineralization rate for the system of study.
4.
Denitrification may be calibrated by modifying the denitrification constant or the activation energy for temperature response.
5.
Adjusting rooting depth or root length distribution may not improve N distribution in the soil profile if soil water is simulated well because roots are also responsible for plant water uptake. In RZWQM2, soil N is assumed to be in equilibrium between soil micropores (immobile) and mesopores (mobile). However, soil N in the micropores does not exchange with the mobile water during infiltration. Therefore, adjusting the microporosity in each soil layer may improve the N distribution in the soil profile to a certain extent.
6.
For a short simulation period, the correct partitioning of soil organic pools and checking all fates of soil N are essential for a reasonable N distribution in the soil profile.
Soil Organic C/N Soil organic C/N dynamics are controlled by C/N ratios of each pool, microbial populations, rate constants, soil temperature, soil moisture, and activation energy. Increasing or decreasing activation energy controls sensitivity of the process to
A Protocol for Parameterization and Calibration of RZWQM2 in Field Research
35
Fig. 1–6. Recommended calibration steps for soil N in an agricultural system.
soil temperature. It is generally recommended not to modify the rate constants or activation energies. Instead, the C/N pool sizes and fraction of mass transfer from one soil organic pool to another (interpool transfer coefficients) should be calibrated. Partitioning of the soil C/N pools, including microbial pools, significantly affects mineralization rate. Since the soil pool sizes and microbial populations
36
Ma et al.
are generally unknown, the user interface provides a wizard to partition total organic C into various pools. The users can refine the pools as follows: 1.
When microbial population is simulated, it is recommended to pre-run the model for 10 to 12 yr using previous or current management, soil type, and weather data. Then initialize the pool structure for your simulation from the results of the pre-run (Ma et al., 1998a).
2.
When constant microbial populations are used, the user should manually partition the pools using the wizard and then compare annual mineralization rate with field-estimated N supply under the soil and weather conditions of interest. Partition more of the total soil C to the fast pool or intermediate pool if simulated annual mineralization rate is too low and to the slower pool if the rate is too high (Ma et al., 2008). A rule of thumb is that for every 1% OM in the top 0.3 m of soil, annual mineralization is ?20 kg ha−1 (Schepers and Mosier, 1991). Where there is manure application, it is expected that 50% of the organic N in manure will be released in the first year (Karlen et al., 2004???NOT IN LIST???). Steps to calibrate soil organic C/N are as follows:
1.
Set the initial soil organic C pools based on measured soil organic matter content at each soil depth using the wizard provided in RZWQM2. Initial amount, type, height, age, and C/N ratio of crop residue may be needed as well on the surface and in the soil (root biomass, if any).
2.
Initialize the C pools as shown above with or without soil microbial population simulation. Failure to initialize the pools will result in unrealistic N mineralization and N supply to the soil.
3.
Return of crop residue to the soil surface and tillage will also affect soil C/N dynamics. Check soil C and N balance files to make sure crop residue return is correct, including surface residue and root biomass.
4.
Calibrate soil C pool dynamics by primarily adjusting the interpool transfer coefficients. Experienced users may also want to modify the rate constants and activation energy for each process.
5.
When soil microbial growth is simulated, make initialization runs for 10 to 12 yr before real time simulation for the experiment and then load the initialized values to the user interface to replace the original guesses.
6.
The C/N ratio of each organic C pool should not be modified.
Nitrification, Denitrification, and Ammonia Volatilization Nitrification and denitrification rate constants may be adjusted if NH4 and NO3 concentrations in the soil differ from the measured values when soil moisture contents, N leaching, and plant N uptake appear to be predicted adequately. Usually there are no measurements for these processes, especially nitrification.
A Protocol for Parameterization and Calibration of RZWQM2 in Field Research
37
Table 1–8. Approximate N denitrification loss for various soils (Meisinger and Randall, 1991). Soil organic matter content % 5%
Soil drainage classification Excessively well-drained
Well-drained
Moderately well-drained
Somewhat poorly drained
Poorly drained
———————————————————% inorganic N denitrified —————————————————— 2–4 3–9 4–14 6–20 10–30 3–9 4–16 6–20 10–25 15–45 4–12 6–20 10–25 15–35 25–55
Denitrification occurs only under saturated water conditions. Guidelines on denitrification loss are shown in Table 1–8. When there is surface application of manure or NH3, NH3 volatilization loss is expected. Injection of liquid manure or NH3 will considerably reduce volatilization. When urea is applied on the surface, volatilization is higher than when it is incorporated because of high concentration of NH4 from urea hydrolysis. Table 1–9 provides some guidelines on ammonia losses in soils.
Nitrogen Leaching and Nitrogen in Runoff Nitrogen leaching is driven by soil water movement. Timing and amount of leaching are highly dependent on water input to the system via rainfall and irrigation, in addition to soil horizon texture affecting soil hydraulic properties. 1.
Check deep seepage and runoff amount before working on soil N parameters.
2.
Nitrogen-producing processes should be scrutinized. Annual soil organic N mineralization and fertilizer and/or manure application should be checked along with plant N uptake. Nitrification affects the conversion from NH4 (immobile) to NO3 (mobile).
3.
Nitrogen-consumption processes, such as N uptake, volatilization, and denitrification should be checked. When soil is saturated, denitrification can be high enough to affect the leaching result.
4.
Nitrogen in runoff is controlled by the soil N concentration in the top 2 cm and runoff water. Therefore, the ability of top 2 cm to hold NO3 and the degree of mixing are important in determining runoff N. Factors affecting NO3 in the top soil layer are extent of leaching to deeper soil horizons and volatilization if NH3 is present.
5.
Macropore flow may reduce runoff and subsequently N loss to runoff.
Nitrogen Loss in Tile Flow and in Subsurface Flow 1.
Check on the amount of tile flow or subsurface flow below the tile first.
38
Ma et al.
Table 1–9. Approximate ammonia losses from fertilizer N for various fertilizers, application methods, soils, and climate scenarios (Meisinger and Randall, 1991).† Likely precipitation after application Fertilizer N source
Ferilizer application method
Humid climate, 0.5 Subhumid, 0-0.25 Dry climate, little in. or more rain in. of rain within or no rain likely within 2 d 7d within 7 d —————————————% of fertilizer N lost —————————————
Soil pH > 7 Urea or UAN
Surface broadcast Surface dribble
0–20 0–15
2–30 2–20
2–40 2–30
Incorporated
0–10
0–10
0–10
Ammonium sulfate
Surface broadcast Incorporated
0–40 0–10
2–50 0–20
5–60 0–30
Ammonium nitrate
Surface broadcast Incorporated
0–20 0–10
2–25 0–15
5–30 0–20
Anhydrous ammonia
Injected
0–2
0–3
0–5
Surface broadcast Surface dribble
0–5 0–5
5–30 2–20
5–40 2–30
Incorporated
0
0–2
0–2
Surface broadcast Surface dribble
0–5 0–5
2–15 2–10
2–20 2–15
Incorporated
0
0–2
0–2
Any method
0
0–2
0–2
Soil pH < 7 Urea
UAN
All other N sources
† Adjust for soil texture and surface residue as follows: for low CEC soils ( 25 meq/100 g) use lower end of range; for > 50% surface residue cover (notillage, etc.) use upper end of range; for paddy conditions use values in no precipitation column for surface broadcast application.
2.
Check on N supply from fertilizer and soil organic N (mineralization).
3.
Soil N concentrations in the soil profile should be calibrated if necessary, especially around the tile location.
4.
Plant N uptake and rooting depth also affect the amount and where soil N is taken out of the soil and is not available for leaching.
A Protocol for Parameterization and Calibration of RZWQM2 in Field Research
39
Calibrating Plant Parameters It is recommended to calibrate plant parameters under the unstressed conditions so that soil water deficit and N availability do not affect the calibration (Boote, 1999). It is hoped that calibrated plant parameters under these conditions are only determined by the cultivar species and can be carried over from location to location. Phenology should be calibrated first because it affects not only crop production (yield and biomass), but also plant responses to water, N, and temperature stresses as plant’s sensitivity to stresses varies with growth stage (phenology) (Fig. 1–7).
The Quick Plant Parameters Quick Plant. Quick Plant is a module that mimics plant growth through extraction of water and nutrients from the soil. It does not simulate actual plant growth per se. Users need to define maximum plant height, maximum rooting depth, maximum leaf area index, and total plant N uptake (both aboveground and belowground) during a growing season. The module will grow a plant based on a user-defined growing period. It also provides a simple way for vernalization such that the plant will enter dormancy when the 5-d average temperature is below zero and out of dormancy when the 10-d average temperature is above zero. The module also allows user-specified stover and dead roots to be returned to the soil at harvest. If users do not specify root biomass, roots are assumed to be 25% of aboveground biomass. The user must specify: ··
Length of growing season (days)
··
Total N uptake during the growing season (kg N ha−1)
··
Maximum plant height (cm)
··
Maximum leaf area index
·· An estimate of the amount and C/N ratio of leftover crop residue at harvest
(kg ha−1)
·· An estimate of when winter dormancy ends (day of the year) ··
Maximum rooting depth (cm)
··
Root biomass and C/N ratio at harvest (kg ha−1)
Quick Turf. The Quick Turf module is designed for perennial grass and has a constant rooting depth that the user provides. The LAI and height at each cut should also be defined. The module assumes a uniform cut to a given LAI and height. LAI and height will increase from one cutting to another. However, the cutting intervals can vary. Cutting dates are specified as day of the year and are applicable to every year of the simulation. The interval between last cutting of 1 yr and the first cutting of the following year is defined as the growing period for the first
40
Ma et al.
Fig. 1–7. Recommended calibration steps for plant growth in an agricultural system.
cutting of the following year. Grass can experience a period of dormancy at beginning of the year only. Users may define when grass has completed its dormancy, otherwise, the module will bring the plants out of dormancy when the average 10-d temperature is above 0°C. The module also allows user-specified stover and
A Protocol for Parameterization and Calibration of RZWQM2 in Field Research
41
dead roots to be returned to the soil at harvest. Dead roots are assumed to be zero if not specified. User-defined plant N uptake is total uptake between cuttings. If user-defined initial plant height is greater than height at cutting, the module will automatically cut it to the height after cutting. The user must specify: ··
Grass height (cm) and LAI after each cutting
··
Initial height at simulation (cm)
·· An estimate of when winter dormancy ends (day of the year) ··
Total N uptake between cuttings (kg N ha−1)
··
Grass height (cm) and LAI when the grass needs to be cut
·· Amount and C/N ratio of the grass cut as stover ··
Maximum rooting depth (cm)
··
Root biomass and C/N ratio at cutting (kg ha−1)
Quick Tree. The Quick Tree module provides a way to simulate shrubs and trees where LAI may be the only variable during a simulation year. The user needs to provide a constant plant height and a constant rooting depth. The LAI will change during the growing season. Users still need to “plant” and “harvest” a tree or shrub every year to start and end leaf growth. The module allows users to specify dead leaves (stover) and dead roots returned to the soil at harvest. Dead roots will be zero if not specified. Plant N uptake has to be provided and is defined as the total amount during the growing season. The user must specify: ··
Length of growing season (days)
··
Total N uptake during the growing season (kg N ha−1)
··
Tree height (cm)
··
Maximum leaf area index
·· An estimate of the amount and C/N ratio of dead leaves at the end of grow-
ing season (kg ha−1)
·· An estimate of when winter dormancy ends (day of the year) ··
Maximum rooting depth (cm)
··
Dead root biomass and C/N ratio at end of growing season (kg ha−1)
The Generic Plant Growth Parameters The generic plant growth module can be calibrated for any annual crop. However, it only simulates the growth of roots, stems, leaves, and grains. There is no simulation of leaf number or yield components. Crop parameters are in a text file called PLGEN.DAT with a few variables allowed to be calibrated by users in the Window interface. Table 1–10 shows the 10 parameters recommended for calibrating at a site. However, calibrating only these 10 parameters does not
42
Ma et al.
Table 10. Crop growth-related model parameters in RZWQM.DAT for users to calibrate RZWQM2. Parameter name
Definition
CNUP1
Maximum daily N uptake (g plant−1 d−1) used in the Michaelis–Menten equation. Increasing this parameter causes an increase in active uptake, which will result in an increase in yield. Proportion of photosynthate used for maintenance respiration. Increasing this parameter results in a decrease in biomass.
ALPHA CONVLA CLBASE SLA3 SLA4 RDX
RST SUFNDX EFFLUX
Conversion factor from biomass to leaf area index (g LAI−1). Increasing this parameter causes a decrease in total plant production. Plant density on which CONVLA is based (no. plants ha−1) Factor to reduce photosynthetic rate at end of reproductive stage. This parameters along with SLA3 will adjust harvest index. Factor to reduce photosynthetic rate at seed production stage (0–1). Same as SL3 used to adjust harvest index. Maximum rooting depth under optimal conditions (cm). Increasing rooting depth will promote early penetration of roots and generally increase total plant production. Minimum leaf stomatal resistance (s m−1). Increasing this parameter decreases potential evapotranspiration. Nitrogen sufficiency index threshold below which automatic fertilization is triggered (0–1). Plant luxurious nitrogen uptake efficiency factor (0–1).
always result an adequate calibration unless some additional parameters in PLGEN.DAT are also modified using a text editor provided in the user interface. The CO2 effect on photosynthesis is not explicitly simulated in the generic plant model (Hanson, 2000).
Phenology The generic plant growth module defines five growth stages: germination, emergence, 4-leaf stage, end of vegetative growth, and end of reproductive growth. Phenology is determined by the minimum days or thermal time (growing degree days) between the five stages in PLGEN.DAT. Calibrating these parameters will also affect yield and crop growth because many processes are phenology dependent. Phenology is also affected by water and N stresses. Germination parameters should also be provided in the file.
Leaf Area Index Maximum leaf area index (LAI) is specified in PLGEN.DAT. Experienced users can also adjust root/shoot and leaf/shoot ratios to calibrate LAI for a crop. Of course, duration of vegetative growth also affects LAI. The most sensitive parameter is the specific leaf weight in Table 1–10. Increasing this parameter will decrease LAI.
A Protocol for Parameterization and Calibration of RZWQM2 in Field Research
43
Biomass After phenology is correct, users can calibrate biomass by adjusting some of the parameters in Table 1–10. More maintenance respiration will reduce biomass production, so does a shallow rooting depth under water or N stress conditions. Less growing days in the vegetative stage will also reduce total biomass. Parameters related to photosynthesis (light extinction coefficient, maximum photosynthetic rate, and light use efficiency) can greatly affect biomass production. It is always a good idea to check for N and water stress factors before adjusting the growth parameters (PLANT2.PLT). When adjusting growth parameters is inevitable, calibrate only those in doubt and use values from literature as much as possible.
Crop Grain Yield The generic model partitions photosynthate to grain using an aging factor (Table 1–10). Another two parameters in PLGEN.DAT related to yield formation are “proportion of photosynthate to propagule” and “proportion of propagule to seed” in PLGEN.DAT. When there is inaccuracy in predicting yield, biomass should be checked first along with water and N stresses.
Plant Height An exponential function is used to scale plant height from shoot biomass (leaf and stem) (Eq. [21]). Therefore, correct shoot biomass simulation is the key for accurate simulation of plant height. a SH bio æ çç 2 H max ç Height = H max ç 1- e ççç è
ö÷ ÷÷ ÷÷÷ ÷÷ ø
[21]
where SH bio is shoot biomass simulated in the model, Height is canopy height (cm), and Hmax is the maximum plant height (Hmax) at maturity, and a is a constant that may be estimated from the shoot biomass at one-half Hmax, which is listed in PGLEN.DAT.
Water Uptake (Transpiration) Water uptake is determined by several factors. Users should be careful in identifying the real reasons for poor simulation of transpiration. The suggested steps would be to check (i) PET calculation, (ii) soil water balance, and (iii) rooting depth. The Generic plant model has a parameter for maximum rooting depth (Table 1–10). When transpiration is low, possible reasons are low LAI, low soil moisture supply, low Ksat, and too shallow rooting depth. The model assumes the lower limit of plant available water is at 15 bar (q 15). Plant water uptake can only
44
Ma et al.
take place during redistribution period after infiltration. Soils having high water holding capacity above q 15 should have higher available water for plant extraction. Surface energy balance may also need to be improved using the SHAW or PENFLUX modules.
Nitrogen Uptake RZWQM2 has two N uptake mechanisms: a primary passive uptake based on N concentration in transpiration water and if not sufficient and a secondary active uptake based on soil N concentration via the Michaelis–Menton equation (Hanson, 2000). Water uptake plays a major role in N uptake. When there is a problem with N uptake, one should check (i) actual transpiration, (ii) soil N availability in the root zone, (iii) plant growth, (iv) rooting depth, and (v) maximum daily N uptake rate (Table 1–10). If users have no measured plant N uptake, they should find an approximate N uptake for the produced biomass to compare with modeling results. The ratios of N in grain to total aboveground N uptake for several crops are listed in Table 1–11, and N fixation is shown in Table 1–12. Plant N demand is critical for N uptake as well (Ma et al., 2008). The generic plant growth module has parameters to quantify minimum and maximum N concentrations in each plant tissue, root/shoot ratio, and leaf/shoot ratio. Calibrating these ratios in the PLGEN.DAT file affects N uptake as well as plant growth. The DSSAT model also has plant N concentrations in the species file.
Calibrating DSSAT-CSM Models in RZWQM2 The DSSAT-CSM incorporated into RZWQM2 has enhanced the application of RZWQM2 over the last few years. The most common method for calibrating cultivar parameters of the CSM-DSSAT crop models is through manual adjustment (trial and error) of the parameters to match the simulated outputs closely with the field-measured data (Boote et al., 1997, 1998). A more objective and systematic procedure for parameter estimation is to use optimization techniques (Mavromatis et al., 2002; Hunt et al., 1993; Anothai et al., 2008; Jones et al., 2011), which is not available in RZWQM2. Notwithstanding the methods used for parameter estimation, a minimum dataset is needed to obtain cultivar-specific parameters that are stable (Boote et al., 1998). Records of phenological observations and yield and yield components from variety trials are well suited for determination of cultivar coefficients (Mavromatis et al., 2002). However, growth analysis data from crop trials or other experiments conducted under well-watered conditions (with minimum constraints due to water deficit) are ideal for calibration of the cultivar parameters (Table 1–4). The timings of anthesis and maturity are essential minimum data needed to calibrate the phenological component of the model, and the final yield and
A Protocol for Parameterization and Calibration of RZWQM2 in Field Research
45
Table 1–11. Ratio of grain N to total aboveground N uptake (Schepers and Mosier, 1991). Crop Winter wheat Grain sorghum Corn Soybean
Mean
Range
0.80 0.58 0.71 0.70
0.74–0.86 0.52–0.64 0.64–0.78 0.55–0.85
Table 1–12. Rate of biological N2 fixation for various legumes (Schepers and Mosier, 1991). Legume crop
N2 fixed kg−1 ha−1 yr−1
Soybean Midwestern conditions Southeastern conditions Cowpea Clover (Trifolium) Alfalfa (Medicago sativa L.) Lupin (Lupinus angustifolius L.)
57–94 73–218 84 104–160 128–336+ 150–169
yield components at harvest are essential for calibrating the biomass growth and yield components. The CERES and CROPGRO crop models supported in RZWQM2 have different numbers of cultivar coefficients. These parameters broadly fall under two categories: phenological and growth parameters. The first step in calibration of all CSM-DSSAT crop models in RZWQM2 is to select a cultivar in the “cultivar file” that in general is similar to the cultivar of your experiment or predicts anthesis and maturity close to the observed data, as well as yield and yield components (Boote, 1999). When calibration is needed, it is suggested to vary the value within the range given in the cultivar database that is distributed with DSSAT for each crop. Correct simulation of LAI is critical for light interception, ET, and photosynthesis. The soil fertility factor (SLPF) and soil root growth distribution (SRGF) may also need to be adjusted to further improve simulations (Malone et al., 2010). After calibrating for unstressed conditions, a sensitivity analysis of the calibrated model to management practices is recommended, especially to water and N treatments. Users may also want to check upper drain limit (DUL) and lower limit of plant available water (LL), which are assumed to be soil water content at 1/3 and 15 bar suction. The amount of available soil water (DUL-LL) is often underestimated by pedotransfer functions proposed in the literature and also used in DSSAT, possibly because there is considerable “usable” water in soil above 1/3 bar (Boote, 2010, personal observation).
46
Ma et al.
Table 1–13. Genetic coefficients used in the CSM-CROPGRO model for the simulations of soybean, drybean, fababean, velvetbean, cabbage, chickpea, cowpea, peanut, pepper, tomato, canola, bahiagrass, brachiaria, and cotton. (Example values are representative of soybean.) Acronyms used and definitions of traits
Units
Range
CSDL
h
11–15
h−1
0.129–0.349
ptd†
15–29
ptd ptd ptd ptd mg CO2 m−2 s−1
5-10 11–16 27–38 15–35 0.9–1.4
cm2 g−1
300–400
cm2
140–230 1.0
g ptd
0.153–0.195 17–26
PPSEN EM-FL FL-SH FL-SD SD-PM FL-LF LFMAX SLAVR SIZELF XFRT WTPSD SFDUR SDPDV PODUR
Critical short day length below which reproductive development progresses with no daylength effect (for short day plants) Slope of the relative response of development to photoperiod with time (positive for short day plants) Time between plant emergence and flower appearance (R1) Time between first flower and first pod (R3) Time between first flower and first seed (R5) Time between first seed (R5) and physiological maturity (R7) Time between first flower (R1) and end of leaf expansion Maximum leaf photosynthesis rate at 30°C, 350 ppm CO2, and high light Specific leaf area of cultivar under standard growth conditions Maximum size of full leaf (three leaflets) Maximum fraction of daily growth that is partitioned to seed shell Maximum weight per seed Seed filling duration for pod cohort at standard growth conditions Average seed per pod under standard growing conditions Time required for cultivar to reach peak pod number under optimal conditions
no. seed pod−1 1.9–2.4 ptd
8–12
† ptd, photothermal days.
Calibration of Cultivar Parameters for CROPGRO Models The CROPGRO model was originally developed to simulate legume crops, but it has also been parameterized for nonlegume crops. In general, seven cultivar parameters (CSDL, PPSEN, EM-FL, FL-SH, FL-SD, SD-PM, and FL-LF) define the crop life cycles, and eight parameters (LFMAX, SLAVR, SIZELF, XFRT, WTPSD, SFDUR, SDPDV, and PODUR) define the growth traits (biomass assimilation and partitioning) of the crops (Table 1–13). Calibration of CROPGRO is conducted in the order of phenology, LAI and biomass growth, and yield and yield components (Boote, 1999).
Phenology 1.
Select a maturity group based on the cultivar in the experiment, and compare simulated and measured flowering and maturity dates.
A Protocol for Parameterization and Calibration of RZWQM2 in Field Research
47
2.
Adjust the EM-FL to match the date of flowering with that measured. If the value of the parameter fails to stay within the range of values for all the cultivars in the database, you may also have to adjust the CSDL and PPSEN parameters, depending on the photoperiod sensitivity of the crop and/or cultivar. An increase in EM-FL delays flowering.
3.
Adjust the SD-PM to match simulated and measured date of maturity. If the value of the parameter fails to stay within the range of values for all the cultivars in the database, one may also adjust the CSDL and PPSEN parameters for daylength-sensitive crops. However, note that this will also affect the time from EM-FL. An increase in SDM-PM delays maturity.
4.
If CSDL and PPSEN were adjusted, recheck the simulation of the anthesis date and make adjustments in EM-FL if needed.
Growth—Leaf Expansion and Biomass 1.
If the slope of the simulated biomass progression with time is too rapid or slow, as in Fig. 1–8, adjust SLPF in the specific DSSAT soil profile if you think that poor soil fertility has contributed to the observed mismatch in simulated and observed biomass. Please note that SLPF is defined as a soil profile input parameter and is site specific.
2.
If there are two cultivars that show different rates of dry matter accumulation when grown on the same soil, and the slope of the simulated biomass progression with time is too rapid or slow, then you can adjust LFMAX, the cultivar-specific light-saturated leaf photosynthesis rate. If you have only one cultivar, adjust SLPF.
3.
To match the simulated and measured LAI, increase the SLAVR parameter if the simulated SLA is too high or decrease SLAVR if the simulated SLA is too low. If the peak in the simulated LAI growth with time does not match the measured LAI, increase or decrease FL-LF to delay or accelerate the time of maximum LAI, respectively. The SIZELF parameter can be used to increase or decrease leaf area expansion during early vegetative stage of development of the plant when leaf area expansion is “sink-limited.” If the cultivar is a dwarf type, the RWDTH (relative width) and RHGHT (relative height) parameters in the “ecotype” might need adjustment.
4.
At this stage, go back and readjust SLPF (or LFMAX) if necessary for better simulation of biomass.
Yield Correct information for WTPSD and SDPDV is needed for matching final seed size and seeds per pod. If measured information for these parameters is not available, try to obtain approximate data from the literature or from the seed companies and refine to match simulation with measured data for final seed size and seeds per pod. (The model is intentionally not very sensitive to WTPSD or
48
Ma et al. Fig. 1–8. Comparison between simulated and measured peanut biomass and pod yield progression with time (a) at two values of SLPF, and for a delay of 5 d in (b) both FL-SH and FL-SD (middle), and (c) soybean seed size for two different values of SFDUR (Boote, 1999).
SDPDV.) Also, provide a first approximation for the SFDUR, which should be about 70 to 80% of the SD-PM. 1.
To match the pod and seed dry weights and their growth pattern with the measured data, adjust PODUR, FL-SH, and FL-SD. Decrease FL-SH and FL-SD to start pod and seed growth sooner, and increase to delay (Fig. 1–8). In general, both parameters need to be changed in the same direction because the duration FL-SH to FL-SD sets the lag from start of first pod to start of seeds for all cohorts of pods, and as such, decreasing FL-SH for early pod and increasing FL-SD to delay the start of seed for one cohort would slow down the process for all of them. Reducing PODUR will cause the number of pods and seeds to be set more rapidly, as in a more determinate manner.
A Protocol for Parameterization and Calibration of RZWQM2 in Field Research
49
2.
Re-adjust SD-PM if necessary to match simulated and measured physiological maturity periods.
3.
At this stage, go back and re-adjust parameters for seed size and shelling percentage. In the CROPGRO model, seed growth becomes limited as cohorts reach their maximum shelling percentage (THRESH in “eco” file). Make sure that the simulated shelling percentage does not exceed the value for THRESH. If simulated shelling percentage is too high, increase SFDUR until the shelling percentage comes down. The WTSPD may be adjusted to obtain the correct final seed size. If simulated shelling percentage and seed size through time are too high and reach a maximum long before maturity, increase SFDUR, which will decrease the slope of dry matter increase per seed and, in fact, sets single seed growth rate (Fig. 1–8).
4.
If the simulation for phenology, seed size, shelling percentage, biomass, LAI, and grain yield match the observed data, the calibration of the cultivar parameters is complete. If there are still inaccuracies, make adjustments based on the procedures described previously. Nitrogen uptake is the minimum of soil N supply based on soil NH4 and NO3
concentrations and N demand based on daily crop growth. Soil N supply from each soil layer is a function of soil water contents (DUL, LL, and q s), RLV, and concentrations of NH4 and NO3. Crop N demand is based on given N or protein concentrations in each plant tissue, which is specified in the species file. When there is a discrepancy between measured and simulated N uptake, users should check for soil N supply first before working on any of the parameters in the species file. Nitrogen fixation parameters are in the species file, and users should be reluctant to modify these parameters, as the model is very robust at fixing N needed to make up the deficit of soil mineral N not taken up by roots. Table 1–12 lists some estimated N fixation values. Experienced users may calibrate the parameters in the species and ecotype files when there is strong evidence to do so. These parameters are used to simulate photosynthesis, respiration, partitioning of assimilates among plant tissues and yield components, leaf growth and senescence, seed and shell growth, N fixation, and root growth.
Calibration of Cultivar Parameters for CERES Models CERES has slightly different cultivar parameters for different crops. Growth and development of crops in the CERES-Maize (corn) model is specified with six cultivar parameters, i.e., P1, P2, P5, G2, G3, and PHINT, as defined in Table 1–14. The sorghum model includes proso millet and foxtail millet as well as sorghum, while there is a separate model for pearl millet. Growth and development
50
Ma et al.
Table 1–14. Cultivar coefficients used in the CSM-CERES-Maize model for simulations of corn. Acronyms used and definitions of traits.
Units
Range
P1
Degree days (base temperature of 8°C) from seedling emergence to end of juvenile phase. Daylength sensitivity coefficient [the extent (days) that development is delayed for each hour increase in photoperiod above the longest photoperiod (12.5 h) at which development proceeds at maximum rate].
ptd†
100–450
Degree days (base temperature of 8°C) from silking to physiological maturity Potential kernel number Potential kernel growth rate Degree days required for a leaf tip to emerge (phyllochron interval)
ptd
P2
P5 G2 G3 PHINT
0–2
600–1000
kernel no. plant−1 440–1000 mg/(kernel d) 5–16 ptd 38–55
† ptd, photothermal days.
for these crops are specified with seven cultivar parameters, including P1, P2O, P2R, P5, G1, G2/G4, and PHINT, as defined in Table 1–15. Five parameters, including P1, P2O, P2R, P5, and PHINT, affect phenological development, while the remaining parameters, including G1 and G2/G4 define the growth traits, including biomass assimilation and partitioning. CERES-Wheat also includes barley and triticale. Growth and development of these crops in the CSM-CERES models are specified with seven cultivar parameters P1D, P1V, P5, G1, G2, G3, and PHINT. The parameters P1D, P1V, P5, and PHINT define the crop life cycles, while the parameters G1, G2, and G3 define the growth traits (biomass assimilation and partitioning) (Table 1–16). When calibrating the CERES models, like CROPGRO, phenology should be calibrated first followed by biomass, LAI, and yield. Calibration of these models is generalized as follows:
Phenology 1.
Select a cultivar closest to the variety used, and compare simulated versus measured flowering and maturity dates.
2.
Get a reasonable match between simulated versus measured anthesis and physiological maturity dates by adjusting P1, P2, and P5 within the range available in the cultivar parameter database (cultivar file) or elsewhere in the literature. An increase in P1 and P5 in general will delay flowering and maturity.
3.
For maize, adjust the daylength sensitivity for those cultivars where P2 > 0.
4.
For sorghum and millet models, adjust the photoperiod coefficients P2R and P2O.
A Protocol for Parameterization and Calibration of RZWQM2 in Field Research
51
Table 1–15. Cultivar coefficients used in the CSM-CERES model for simulations of pearl millet, proso millet, foxtail millet and sorghum. Acronyms used and definitions of traits.
Units
Range
P1
ptd†
100–500
P2O
P2R
P5 G1 G2 G4 PHINT
Degree days from seedling emergence to the end of the juvenile phase (base temperature of 10 ºC) during which the plant is not responsive to changes in photoperiod. Critical photoperiod or the longest day length (in hours) at which development occurs at a maximum rate. At values greater than P2O, the rate of development is reduced. Extent to which phasic development leading to panicle initiation (expressed in degree days) is delayed for each hour increase in photoperiod above P2O. Degree days ( base temperature of 10 ºC) from beginning of grain filling (3-4 days after flowering) to physiological maturity. Scaler for relative leaf size.
12.5–16.0
1–300
ptd
300–650 0–20
Scaler for partitioning of assimilates to the panicle (head) (for proso millet, foxtail millet and sorghum). Scaler for partitioning of assimilates to the panicle (head) (for pearl millet) Degree days required for a leaf tip to emerge (phyllochron interval) ptd
1–8 0–1.0 38–55
† ptd, photothermal days.
Table 1–16. Cultivar coefficients used in the CSM-CERES model for simulations of wheat, barley and triticale. Acronyms used and definitions of traits. P1D P1V P5 G1 G2 G3 PHINT
Percentage reduction in development rate when photoperiod is shorter than the threshold of 20 h (% reduction/h near threshold). Days at optimum vernalizing temperature required to complete vernalization. Grain filling (excluding lag) phase duration Kernel number per unit stem + spike weight at anthesis Standard kernel size under optimum conditions Standard, nonstressed dry weight (total, including grain) of a single tiller at maturity Thermal time between the appearance of leaf tips (8°C d).
Units
Range 1–100
d
0–60
ptd† no. g−1 mg g
170–600 15–30 20–60 1.0–2.5
ptd
60–100
† ptd, photothermal days.
5.
For wheat, adjust the coefficients P1D for daylength sensitivity and P1V for vernalization.
6.
Recheck the predicted flowering and maturity dates, and adjust the cultivar parameters if needed.
Growth—Leaf Expansion and Biomass 1.
Plant biomass can now be calibrated in the CERES models by adjusting the SLPF value in the soil file as described above for the CROPGRO crops. The
52
Ma et al.
RUE (radiation use efficiency) value is now available in the ecotype file, but is a stable parameter that is not recommended for calibration except in the case of reducing RUE for inbreeds or open-pollinated maize. Be sure that LAI is simulated correctly, as this influences light capture and dry matter gain. PHINT has some impact on LAI, but also impacts time of anthesis. 2.
Adjust RUE in the ecotype file for maize or PARUV and PARVR in the ecotype file for wheat, but only where you know hybrids or cultivars differ in dry matter accumulation when grown on the same soil.
Yield 1.
Define the potential kernel growth rate (mg d−1) by setting G3 to match the final observed kernel size, as it is critical for the correct simulation of yield and yield components. An increase in G3 will increase grain yield and vice versa.
2.
For maize, the last step in calibrating grain yield is to adjust maximum potential kernel number per plant G2. An increase in G2 will increase grain yield, and a decrease will reduce yield. Note that adjusting SLPF will also influence grain yield, mostly through kernel number.
3.
For sorghum and millet, grain yield can be calibrated by adjusting the “scaler for partitioning assimilates to panicle” (G2 for pearl millet, and G4 for proso millet, foxtail millet, and sorghum).
4.
For wheat G1 and G2 should be calibrated with further improvement by adjusting G3. Plant height is not simulated in CERES-Maize and CERES-Sorghum models. In
RZWQM2, an empirical equation was developed based on biomass from the studies in the Central Great Plains by Dr. David Nielsen (personal communication???) from Eq. [21]. Hmax is 246 cm for maize and 93 cm for sorghum and millet. The a values are 0.0636 for maize; 0.222 for sorghum, foxtail millet, and proso millet; and 0.042 for pearl millet. In CERES-Wheat, daily plant height increment is calculated from a user-provided standard height (in the ecotype file) and growth stage. However, it should be noted that calibrated plant parameters may not transferrable to other locations because (i) there are many parameters sets that can provide acceptable simulation for a calibration dataset, (ii) the calibrated parameters may reflect the interaction between N and water stresses, and (iii) inputs of other plant and soil parameters may affect the calibrated parameters. Unless the plant parameters are well evaluated under other experimental conditions (water and N treatments) and in multiple years, one should not expect to transfer the calibrated plant parameters to other locations. In addition, methods of estimating Ksat, PET, and other soil parameters should be the same among locations for the plant parameters to be transferrable (Ma et al., 2011).
A Protocol for Parameterization and Calibration of RZWQM2 in Field Research
53
Table 1–17. Pesticide washoff parameters (Wauchope et al., 2000) Pesticide solubility range
Washoff power
Examples
105
0.002 0.005 0.013 0.033 0.085 0.2
pyrethroid, organochlorine organophosphorus – carbamate,organophosphorus organophosphorus organophosphorus
Calibrating Pesticide Parameters Pesticide parameters are provided in RZWQM2 from a database compiled by Wauchope et al. (1992), which defines washoff from leaves and crop residue, soil degradation, soil adsorption, and irreversible binding. Washoff is defined by the following equation: P = P0 Fe- w * R
[22]
where P0 is the total amount (mg/g) and F is washable fraction of pesticide on leaves or crop residue (100% as default), w is a washoff factor (see Table 1–17), and R is rainfall (mm) for each storm event. Due to washoff and spatial variability, initial pesticide amount applied onto the soil surface may be unknown. Therefore, measuring or calibrating initial pesticide amount at time = 0 should be provided. Degradation may occur at plant canopy, surface residue, and in soil layers. Degradation rate in each soil layer is generally proportional to the amount present (first order) and determined by the half-life of the pesticide. Pesticide degradation rate in soil can be adjusted for soil moisture and soil depth. Degradation pathways (e.g., anaerobic, aerobic) in each component (e.g., soil, canopy, and residue) are lumped together to give an overall degradation constant. When the pesticide molecules are electrically charged, users may supply an adsorption constant for the anion or cation. The model calculates an overall equilibrium adsorption constant for the pesticide. The model also has an option for using kinetics of adsorption–desorption, in addition to the equilibrium assumption. Users may also provide a diffusion coefficient to control mass flux between immobile micropores and mobile water. For those who are interested in pesticide uptake, an octanol–water partition coefficient (Kow) is needed. Calibration of the pesticide component should be done after soil water, soil N, and plant growth were calibrated satisfactorily (Fig. 1–9). 1.
Select a pesticide name from the pesticide database or define your own name. A default set of pesticide parameters is then loaded into the model.
54
Ma et al.
Fig. 1–9. Recommended calibration steps for pesticide in an agricultural system.
2.
Define parent or daughter or granddaughter products if necessary. When daughter or granddaughter is defined, a pathway from parent to daughter or granddaughter should be defined along with a percentage of degradation products that is the daughter or granddaughter.
A Protocol for Parameterization and Calibration of RZWQM2 in Field Research
55
3.
Define half-lives for degradation processes for each component (foliar, surface residue, soil surface, and soil subsurface).
4.
Define the conditions (soil pH, soil temperature, soil water content) where the above degradation half-lives are measured. Also, provide the Walker constant to adjust the degradation half-lives with soil moisture.
5.
Define the octanol carbon partition constant (Koc) values for each species of the pesticide (neutral, cationic, or anionic), half-life of absorbed pesticide for irreversible pesticide degradation, kinetic absorption–desorption constants, diffusion rate between micropores and mesopores, and octanol– water partitioning coefficient for plant pesticide uptake.
6.
When a slow release form of a pesticide is applied, a proportion of daily pesticide release should be provided.
7.
When a pesticide is applied to a plant canopy or on surface residue, washoff coefficient should be defined.
8.
Henry’s law constant is needed for volatile pesticide.
Soil Pesticide Distribution It is generally difficult to know exactly how much pesticide is applied to a soil due to canopy interception, drifting, spatial variability, and quick volatilization from the air and soil surface. It is good to put filter papers on the soil surface to measure the amount applied to the soil. Otherwise, comparing the patterns of measured and simulated relative amounts and pesticide distributions in the soil are more appropriate than matching the exact amount in each soil layer. Parameters that affect pesticide movement in soils are adsorption–desorption constants (Kd values) and degradation half-lives. The soil surface has other pesticide dissipation mechanisms such as volatilization (from Henry’s law constant or user defined) and photodegradation. Soil water movement and plant pesticide uptake are also important mechanisms in defining a pesticide distribution in the soil profile. Including kinetics in pesticide adsorption may improve simulation results as well (Fig. 1–10). 1.
Check pesticide input to make sure that drifting is not an issue during application.
2.
Check soil water movement before adjusting pesticide parameters.
3.
Calibrate Koc value first, and then add kinetics if necessary.
4.
Depending on recovery of pesticide from the soil, degradation and irreversible adsorption may be needed to provide correct pesticide soil simulation.
5.
The Walker constant may need to be modified to adjust for soil moisture difference.
6.
Check if it is necessary to modify degradation constants with soil depth.
56
Ma et al. Fig. 1–10. Effects of kinetic adsorption on metribuzin disappearance in soils (Malone et al. 2004a).
7.
If plant uptake is simulated, check the octanol–water partitioning coefficient (Kow) and root distribution (by adjusting SRGF).
8.
It is important to match the first measurement of soil pesticide concentration, preferably immediately after application so that drifting or application efficiency can be calculated.
Pesticide Leaching and Runoff The total amount of pesticide leaching from the soil profile is affected primarily by soil water movement, degradation, and adsorption. The irreversible binding of pesticides is also a major sink term in pesticide balance. Generally there are many parameters that can be calibrated for a given experiment. However, users should refer more to literature values to make the calibration credible. Absorption kinetics should also be considered if pesticide leaching is too fast. The pesticide runoff amount is determined by runoff water and pesticide concentration in the top 2 cm of the soil profile, and adjusting the nonuniform mixing factor (B) may help simulate pesticide concentrations in runoff simulation. Degradation, volatilization, adsorption, and leaching of pesticide affect pesticide concentration in the top soil layer.
Model Responses to Water, Nitrogen, and Temperature Variations Table 1–18 provides examples of model parameters that have been calibrated for various model outputs to be compared with experimental measurements. Malone et al. (2001a, 2004a) also reviewed parameterization of RZWQM for various processes and associated parameters. However, these calibrations are highly dependent on experience of the users and data availability. This calibration process is not complete either until the model is evaluated for its performance against some additional experimental data and for its responses to water, N, and
A Protocol for Parameterization and Calibration of RZWQM2 in Field Research
57
Table 1–18. Examples of calibration in RZWQM applications Parameters calibrated
Measurements to match
Authors
Ksat, qs, macroporosity, fraction of dead macropores Stomatal and soil resistance, maximum rooting depth Soil C pool size, nitrification and urea hydrolysis rate coefficients Interpool transfer coefficients among soil C pools (R14, R23, R34, R45) Lateral hydraulic gradients and lateral Ksat, N2, l2
Water redistribution and infiltration
Cameira et al. (2000, 2005) Kumar et al. (1998)
Evapotranspiration
Cameira et al. (2005) Ma et al. (2003) Cameira et al. (2007)
Total soil C, Soil nitrate distribution and plant N uptake N loss in tile flow, soil N Malone et al., (2011 distribution Ma et al. (1998)???a, b, c??? Tile flow Malone et al. (2010) Ma et al. (2007b) Percolate from soil block, Malone et al. (2003) Ksat, l2, bulk density Soil moisture distribution Sophocleous et al. (2009) Ksat for crusted soil surface Surface runoff Ma et al. (1995, 2004) Soil moisture Ma et al. (2003) q1/3 or field capacity Hu et al. (2006) q15 or wilting point Fang et al. (2010b) Porosity and field capacity Subsurface drainage Kumar et al. (1998) Bakhsh et al. (2004) Koc and pesticide half live Pesticide loss in tile drainage Bakhsh et al. (2004) Macroporosity Till and no-till effects on Malone et al. (2004a) pesticide leaching Soil root growth factor (SRGF) Plant growth, soil moisture Malone et al. (2010) distribution Fang et al. (2010b) Lateral sorptivity factor Pesticide leaching into tile flow Kumar et al. (1998) Malone et al. (2001a) Nonuniform mixing factor (B) Chemical in runoff Ghidey et al. (1999) Malone et al. (2001a) Soil horizon depth Soil moisture and N Martin and Watts (1999) Albedo Soil moisture Nokes et al. (1996) Initial soil moisture if not measured Pesticide soil distribution Azevedo et al. (1997) Tile flow Singh et al. (1996) Washoff factor and macropore Pesticide leaching Malone et al. (2001a) radius
temperature stresses. This can be done by simulating different water, N, and temperature treatments in the study or by a sensitivity analysis. Such a sensitivity analysis should reduce the degree of freedom in model parameterization because there could be many sets of parameters that produce similar accuracy in simulating one treatment. A long-term simulation with generated or recorded weather is also needed to test the stability of the model and simulation results (e.g., soil organic C). Since there are many sets of model parameters that can provide acceptable calibration for a dataset, evaluating the calibrated model for other treatments or under other conditions is essential (Ma et al., 2011).
58
Ma et al.
When the model is not responsive to additional water and N management, users should check if the phenology is simulated correctly under different treatments and then look at simulated water and N stresses in output files to make sure the stresses are simulated correctly for the treatments. Variables to look for are potential and actual transpiration. The generic plant growth model also has a water stress index (WSI) that can be used to adjust plant responses to water stresses. RZWQM2 has the capability to modify management practices to conduct sensitivity analysis of the model to fertilization and irrigation and to modify weather driving variables such as air temperature, solar radiation, rainfall, relative humidity, and atmosphere CO2. These features facilitate sensitivity analysis but are not automated.
No Convergence and Mass Balance Issues As the Richards equation is used during water redistribution, no convergence can happen when unusual soil hydraulic properties are used in the model or when there is too much difference between soil hydraulic properties of adjacent soil layers. This problem may be solved by inserting an intermediate soil layer between the two distinct layers. Another known cause of mass balance is due to too high or too low rainfall intensity. When there is a very small amount of rain in a few minutes, the rainfall intensity is unreasonably high. On the contrary, when there is a small rainfall event over many hours, the rainfall intensity can be unreasonably low. Both cases can cause mass balance problems. Users may adjust the rainfall duration to avoid mass balance problems for those days. It is also known that these problems occur more often when there are water table and tile flow simulations. If that is the case, users may want to pay attention to water table leakage rate and lateral hydraulic gradient for simulating pseudolateral flow below the tile. Also, field saturation should be set to 1.0.
Conclusions It is a constant challenge for experimental scientists to use and incorporate system models in their research. This step-by-step procedure was developed for RZWQM2 to assist and encourage more users of agricultural system models. The effort to apply a system model to a given field site can be great, as are the potential benefits. Keeping these principles in mind will make model application less frustrating: ·· Modeling is a scientific discipline by itself and requires education and training. ·· A successful modeling study requires accurate characterization of the agri-
cultural system.
A Protocol for Parameterization and Calibration of RZWQM2 in Field Research
59
·· Calibration is an iterative process, and all simulated system components
should be critically reviewed.
·· There will be uncertainty in model inputs and model parameters due to
experimental error, lack of understanding in our current knowledge, spatial– temporal variability, and unknown history of crop and soil management prior to the experiment.
There will be errors in simulation results, but hopefully within the experimental error tolerance. It should be kept in mind that models are simplifications of the real complex agricultural system and cannot be perfect. There may always be factors that cannot be represented in the model, and the complex interactions may never be fully understood. Despite these shortcomings, a model that is calibrated and evaluated for an experimental site with good field data can greatly enhance and extend agricultural research, education, and extension. The benefits of using a modeling tool are (i) to quantify the interactions among system components, (ii) to help design better and well-balanced field experiments and data collection, (iii) to extend limited field results beyond the experimental period and site and to project system behavior under future weather and management conditions, (iv) to conduct virtual experiments for new hypotheses before conducting costly experiments, (v) to identify knowledge gaps in integrating all system components, and (vi) to suggest possible soil–crop processes that may have occurred parallel to some observed processes.
References
Abrahamson, D.A., D.E. Radcliffe, J.L. Steiner, M.L. Cabrera, D.M. Endale, and G. Hoogenboom. 2006. Evaluation of the RZWQM for simulating tile drainage and leached nitrate in the Georgia Piedmont. Agron. J. 98:644–654. Abrahamson, D.A., D.E. Radcliffe, J.L. Steiner, M.L. Cabrera, J.D. Hanson, K.W. Rojas, H.H. Schomberg, D.S. Fisher, L. Schwartz, and G. Hoogenboom. 2005. Calibration of the root zone water quality model for simulating tile drainage and leached nitrate in the Georgia Piedmont. Agron. J. 97:1584–1602. Ahuja, L.R. 1986. Characterization and modeling of chemical transfer to runoff. Adv. Soil Sci. 4:149–188. Ahuja, L.R., D.K. Cassel, R.R. Bruce, and B.B. Barnes. 1989. Evaluation of spatial distribution of hydraulic conductivity using effective porosity data. Soil Sci. 148:404–411. Ahuja, L.R., D.G. DeCoursey, B.B. Barnes, and K.W. Rojas. 1993. Characteristics of macropore transport studied with the ARS root zone water quality model. Trans. ASAE 36:369–380. NOT CITED. OK TO DELETE??? Ahuja, L.R., K.E. Johnsen, and G.C. Heathman. 1995. Macropore transport of a surface-applied bromide tracer: Model evaluation and refinement. Soil Sci. Soc. Am. J. 59:1234–1241.NOT CITED. OK TO DELETE??? Ahuja, L.R., K.E. Johnsen, and K.W. Rojas. 2000a. Water and chemical transport in soil matrix and macropores. p. 13–50. In L.R. Ahuja et al. (ed.) The Root Zone Water Quality Model. Water Resources Publ., Highlands Ranch, CO.
60
Ma et al.
Ahuja, L.R., and L. Ma. 2002. Parameterization of agricultural system models: Current Issues and techniques. p. 273–316. In L.R. Ahuja et al. (ed.) Agricultural system models in field research and technology transfer. CRC Press, Boca Raton, FL. Ahuja, L.R., L. Ma, and T.R. Green. 2010. Effective soil properties of heterogeneous areas for modeling infiltration and redistribution. Soil Sci. Soc. Am. J. 74:1469–1482. Ahuja, L.R., K.W. Rojas, J.D. Hanson, M.J. Shaffer, and L. Ma (ed.) 2000b. The Root Zone Water Quality Model. Water Resources Publ., Highlands Ranch, CO. Ahuja, L.R., and R.D. Williams. 1991. Scaling water characteristic and hydraulic conductivity based on Gregson–Hector–McGowan approach. Soil Sci. Soc. Am. J. 55:308–319. Aiken, R.M., G.N. Flerchinger, H.J. Farahani, and K.E. Johnsen. 1997. Energy balance simulation for subsurface and residue temperatures with incomplete cover. Agron. J. 89:404–415. Allen, R.G., L.S. Pereira, D. Raes, and M. Smith. 1998. Crop evapotranspiration: Guidelines for computing crop water requirements. United Nations FAO, Irrigation and Drainage Paper 56. FAO, Rome, Italy. Anothai, J., A. Patanothai, S. Jogloy, K. Pannangpetch, K.J. Boote, and G. Hoogenboom. 2008. A sequential approach for determining the cultivar coefficients of peanut lines using end-ofseason data of crop performance trials. Field Crops Res. 108:169–178. Azevedo, A.S., R.S. Kanwar, P. Singh, L.R. Ahuja, and L.S. Pereira. 1997. Simulating atrazine using root zone water quality model for Iowa soil profiles. J. Environ. Qual. 26:153–164. Bakhsh, A., R.S. Kanwar, and L.R. Ahuja. 1999. Simulating the effect of swine manure application on NO3–N transport to subsurface drainage water. Trans. ASAE 42:657–664. Bakhsh, A., L. Ma, L.R. Ahuja, J.L. Hatfield, and R.S. Kanwar. 2004. Using RZWQM to predict herbicide leaching losses in subsurface drainage water. Trans. ASAE 47:1415–1426. Boote, K.J. 1999. Concepts for calibrating crop growth models. p. 179–200. In G.Y. Tsuji et al. (ed.) DSSAT Version 3. Vol. 4–6. International benchmark sites network for agrotechnology transfer. Univ. of Hawaii, Honolulu, HI. Boote, K.J., G. Hoogenboom, J.W. Jones, and K.T. Ingram. 2008. Modeling nitrogen fixation and its relationship to nitrogen uptake in the CROPGRO model. p. 13–46. In L. Ma et al. (ed.) Quantifying and understanding plant nitrogen uptake for systems modeling. CRC Press, Boca Raton, FL. Boote, K.J., J.W. Jones, G. Hoogenboom, and G.G. Wilkerson. 1997. Evaluation of the CROPGROSoybean model over a wide range of experiments. p. 113–133. In Kropff et al. (ed.) Systems approaches for sustainable agricultural development: Applications of systems approaches at the field level. Kluwer Academic Publishers, Boston. Boote, K.J., J.W. Jones, G. Hoogenboom, and N.B. Pickering. 1998. The CROPGRO model for grain legumes. p. 99–128. In G.Y. Tsuji, G. Hoogenboom, and P.K. Thornton (ed.)Understanding options for agricultural production. Kluwer Academic Publishers, Boston. Boote, K.J., M.J. Kropff, and P.S. Bindraban. 2001. Physiology and modelling of traits in crop plants: Implications for genetic improvement. Agric. Syst. 70:395–420. NOT CITED. OK TO DELETE??? Boyle, D.P., H.V. Gupta, and S. Sorooshian. 2000. Toward improved calibration of hydrologic models: Combining the strengths of manual and automatic methods. Water Resour. Res. 36:3663–3674. Cameira, M.R., L.R. Ahuja, R.M. Fernando, and L.S. Pereira. 2000. Evalauting field measured soil hydraulic properties in water transport simulations using RZWQM. J. Hydrol. 236:78–90. Cameira, M.R., R.M. Fernando, L.R. Ahuja, and L. Ma. 2007. Using RZWQM to simulate the fate of nitrogen in field soil–crop environment in the Mediterranean region. Agric. Water Manage. 90:121–136. Cameira, M.R., R.M. Fernando, L.R. Ahuja, and L.S. Pereira. 2005. Simulating the fate of water in field soil–crop environment. J. Hydrol. 315:1–24. De Vries, D.A. 1963. Thermal properties of soils. p. 210–235. In W.R. van Wijk (ed.) Physics of plant environment. North-Holland Publishing Company, Amsterdam. Doherty, J. 2010. PEST: Model independent parameter estimation. Watermark Numerical Computing, Brisbane, Australia.
A Protocol for Parameterization and Calibration of RZWQM2 in Field Research
61
Fang, Q.X., T.R. Green, L. Ma, R.W. Malone, R.H. Erskine, and L.R. Ahuja. 2010a. Optimizing soil hydraulic parameters in RZWQM2 using automated calibration methods. Soil Sci. Soc. Am. J. 74:1897–1913. Fang, Q.X., L. Ma, Q. Yu, L.R. Ahuja, R.W. Malone, and G. Hoogenboom. 2010b. Irrigation strategies to improve the water use efficiency of wheat–maize double cropping systems in North China Plain. Agric. Water Manage. 97:1165–1174. Farahani, H.J., and D.G. DeCoursey. 2000. Evaporation and transpiration processes in the soil-residue-canopy system. p. 51–80. In L.R. Ahuja et al. (ed.) The Root Zone Water Quality Model. Water Resources Publ., Highlands Ranch, CO. Flerchinger, G.N., R.M. Aiken, K.W. Rojas, and L.R. Ahuja. 2000. Development of the root zone water quality model (RZWQM) for over-winter conditions. Trans. ASAE 43:59–68. NOT CITED. OK TO DELETE??? Gan, T.Y., E.M. Dlamini, and G.F. Biftu. 1997. Effects of model complexity and structure, data quality, and objective functions on hydrologic modeling. J. Hydrol. 192:81–103. Ghidey, F., E.E. Alberts, and N.R. Kitchen. 1999. Evaluation of RZWQM using field measured data from the Missouri MSEA. Agron. J. 91:183–192. Gray, D.M., and D.H. Male. 1981. Handbook of snow: Principles, processes, management and use. Pergamon Press, New York. Hanson, J.D. 2000. Generic crop production. p. 81–118. In L.R. Ahuja et al. (ed.) The Root Zone Water Quality Model. Water Resources Publ., Highlands Ranch, CO. Hanson, J.D., K.W. Rojas, and M.J. Shaffer. 1999. Calibration and evaluation of the root zone water quality model. Agron. J. 91:171–177. Heathman, G.C., L.R. Ahuja, and J.L. Baker. 1986. Test of a non-uniform mixing model for transfer of herbicides to surface runoff. Trans. ASAE 29:450–455. Hoogenboom, G., J.W. Jones, P.W. Wilkens, W.D. Batchelor, W.T. Bowen, L.A. Hunt, N.B. Pickering, U. Singh, D.C. Goldwin, B. Baker, K.J. Boote, J.T. Ritchie, and J.W. White. 1994. Crop models. p. 95–129. In G.Y. Tsuji et al. (ed.) DSSAT version 3, Vol. 2. Univ. of Hawaii, Honolulu. Hu, C., S.A. Saseendran, T.R. Green, L. Ma, X. Li, and L.R. Ahuja. 2006. Evaluating nitrogen and water management in a double-cropping system using RZWQM. Vadose Zone J. 5:493–505. Hunt, L.A., S. Pararajasingham, J.W. Jones, G. Hoogenboom, D.T. Imamura, and R.M. Ogoshi. 1993. GENCALC: Software to facilitate the use of crop models for analyzing field experiments. Agron. J. 85:1090–1094. Johnsen, K.E., H.H. Liu, J.H. Dane, L.R. Ahuja, and S.R. Workman. 1995. Simulating fluctuating water tables and tile drainage with a modified Root Zone Water Quality Model and a new model WAFLOWN. Trans. ASAE 38:75–83. Jones, J.W., G. Hoogenboom, C.H. Porter, K.J. Boote, W.D. Batchelor, L.A. Hunt, P.W. Wilkens, U. Singh, A.J. Gijsman, and J.T. Ritchie. 2003. The DSSAT cropping system model. Eur. J. Agron. 18:235–265. Jones, J.W., J. He, K.J. Boote, P. Wilkens, C.H. Porter, and Z. Hu. 2011. Estimating DSSAT cropping system cultivar-specific parameters using Bayesian techniques. p. xxx–xxx. In L. Ahuja and L. Ma (ed.) Methods of introducing system models into agricultural research. Advances in Agricultural Systems Modeling 2. ASA, CSSA, and SSSA, Madison, WI. Kozak, J.A., and L.R. Ahuja. 2005. Scaling of infiltration and redistribution across soil textural classes. Soil Sci. Soc. Am. J. 69:816–827. Kozak, J.A., R. Aiken, G.N. Flerchinger, D.C. Nielsen, L. Ma, and L.R. Ahuja. 2007. Quantifying residue architecture effects on soil temperature and water. Soil Tillage Res. 95:84–96. Kumar, A., R.S. Kanwar, and L.R. Ahuja. 1998. Evaluation of preferential flow component of RZWQM in simulating water and atrazine transport to subsurface drains. Trans. ASAE 41:627–637. Legates, D.R., and G.J. McCabe. 1999. Evaluating the use of “goodness-of-fit” measures in hydrologic and hydroclimatic model validation. Water Resour. Res. 35:233–241. Loague, K., and R.E. Green. 1991. Statistical and graphical methods for evaluating solute transport models: Overview and application. J. Contam. Hydrol. 7:51–71. Ma, L., L.R. Ahuja, J.C. Ascough II, M.J. Shaffer, K.W. Rojas, R.W. Malone, and M.R. Cameira. 2000. Integrating system modeling with field research in agriculture: Applications of Root Zone Water Quality Model (RZWQM). Adv. Agron. 71:233–292. NOT CITED. OK TO DELETE???
62
Ma et al.
Ma, L., L.R. Ahuja, and R.W. Malone. 2007a. Systems modeling for soil and water research and management: Current status and needs in the 21st century. Trans. ASABE 50:1705–1713. NOT CITED. OK TO DELETE??? Ma, L., G. Hoogenboom, L.R. Ahuja, J.C. Ascough II, and S.S. Anapalli. 2006. Evaluation of RZWQMCERES-maize hybrid for corn production. Agric. Syst. 87:274–295. Ma, L., G. Hoogenboom, L.R. Ahuja, D.C. Nielsen, and J.C. Ascough II. 2005. Development and evaluation of RZWQM-CROPGRO hybrid for soybean production. Agron. J. 97:1172–1182. Ma, L., G. Hoogenboom, S.A. Saseendran, P.N.S. Bartling, L.R. Ahuja, and T.R. Green. 2009. Estimates of soil hydraulic property and root growth factor on soil water balance and crop production. Agron. J. 101:572–583. Ma, L., R.W. Malone, P. Heilman, D.L. Karlen, R.S. Kanwar, C.A. Cambardella, S.A. Saseendran, and L.R. Ahuja. 2007b. RZWQM simulation of long-term crop production, water and nitrogen balances in Northeast Iowa. Geoderma 140:247–259. Ma, L., R.W. Malone, D.B. Jaynes, K.R. Thorp, and L.R. Ahuja. 2008. Simulated effects of nitrogen management and soil microbes on nitrate-N loss in tile drainage and crop production. Soil Sci. Soc. Am. J. 72:1594–1603. Ma, L., D.C. Nielsen, L.R. Ahuja, R.W. Malone, S.A. Saseendran, K.W. Rojas, J.D. Hanson, and J.G. Benjamin. 2003. Evaluation of RZWQM under varying irrigation levels in eastern Colorado. Trans. ASAE 46:39–49. Ma, L., H.D. Scott, M.J. Shaffer, and L.R. Ahuja. 1998b. RZWQM simulations of water and nitrate movement in a manured tall fescue field. Soil Sci. 163:259–270. Ma, L., and H.M. Selim. 1997. Physical nonequilibrium modeling approaches to solute transport in soils. Adv. Agron. 58:95–150. Ma, L., M.J. Shaffer, J.K. Boyd, R. Waskom, L.R. Ahuja, K.W. Rojas, and C. Xu. 1998a. Manure management in an irrigated silage corn field: Experiment and modeling. Soil Sci. Soc. Am. J. 62:1006–1017. Ma, L., T. Trout, L.R. Ahuja, W. Bausch, S.A. Saseendran, and R.W. Malone. 2011. On Calibrating RZWQM2 for plant water stresses in Eastern Colorado. Agron. J. (in review).??? Ma, Q.L., L.R. Ahuja, K.W. Rojas, V.F. Ferreira, and D.G. DeCoursey. 1995. Measured and RZWQM predicted atrazine dissipation and movement in a field soil. Trans. ASAE 38:471–479. Ma, Q.L., R.D. Wauchope, J.E. Hook, A.W. Johnson, C.C. Truman, C.C. Dowler, G.J. Gascho, J.G. Davis, H.R. Summer, and L.D. Chandler. 1998c. Influence of tractor wheel tracks and crusts/seals on runoff: Observation and simulations with the RZWQM. Agric. Syst. 57:77–100.NOT CITED. OK TO DELETE??? Ma, Q.L., R.D. Wauchope, L. Ma, K.W. Rojas, R.W. Malone, and L.R. Ahuja. 2004. Test of the Root Zone Water Quality Model (RZWQM) for predicting runoff of atrazine, Alachlor, and fenamiphos species from conventional-tillage corn mesoplots. Pest Manage. Sci. 60:267–276. Malone, R.W., L.R. Ahuja, L. Ma, R.D. Wauchope, Q.L. Ma, and K.W. Rojas. 2004a. Application of the Root Zone Water Quality Model (RZWQM) to pesticide fate and transport: An overview. Pest Manage. Sci. 60:205–221. Malone, R.W., D. Jaynes, L. Ma, B.T. Nolan, D. Meek, and D. Karlen. 2010. Soil-test N recommendations augmented with PEST-optimized RZWQM simulations. J. Environ. Qual. 39:1711–1723Malone, R.W., S. Logsdon, M.J. Shipitalo, J. Weatherington Rice, L. Ahuja, and L. Ma. 2003. Tillage effect on macroporosity and herbicide transport in percolate. Geoderma 116:191–215. Malone, R.W., L. Ma, L.R. Ahuja, and K.W. Rojas. 2001a. Evaluation of the Root Zone Water Quality Model (RZWQM): A review. In J.E. Parsons et al. (ed.) Agricultural non-point source water quality models: Their use and application. Southern Coop. Ser. Bull. 398. Available at http:// www.bae.ncsu.edu/www3/acad/Regional-Bulletins/Modeling-Bulletin/RZWQM2-word. html (verified 14 Mar. 2011). Malone, R.W., L. Ma, R.D. Wauchope, L. Ahuja, K. Rojas, Q. Ma, R. Warner, and M. Byers. 2004b. Modeling hydrology, metribuzin degradation, and metribuzin transport in macroporous tilled and no till silt loam soil using RZWQM. Pest Manag. Sci. 60:253–266. Malone, R.W., D. Meek, L. Ma, D. Jaynes, B.T. Nolan, and D. Karlen. 2011. Quality assurance of weather data for agricultural system model input. p. xxx–xxx. In L.R. Ahuja and L. Ma (ed.)
A Protocol for Parameterization and Calibration of RZWQM2 in Field Research
63
Methods of introducing system models into agricultural research. Adv. Agric. Systems Modeling 2. ASA, CSSA, SSSA, Madison, WI. Malone, R.W., M.J. Shipitalo, L. Ma, L.R. Ahuja, and K.W. Rojas. 2001b. Macropore component assessment of the Root Zone Water Quality Model (RZWQM) using no-till soil blocks. Trans. ASAE 44:843–852. Martin, D.L., and D.G. Watts. 1999. Application of the root zone water quality model in central Nebraska. Agron. J. 91:201–211. Mavromatis, T., K.J. Boote, J.W. Jones, G.G. Wilkerson, and G. Hoogenboom. 2002. Repeatability of model genetic coefficients derived from soybean performance trials across different states. Crop Sci. 42:76–89. Meisinger, J.J., and G.W. Randall. 1991. Estimating nitrogen budget in soil–crop systems. p. 85–124. In R.F. Follett et al. (ed.) Managing nitrogen for groundwater quality and farm profitability. SSSA, Madison, WI. Monteith, J.L., and M.H. Unsworth. 2008. Principles of environmental physics. 3rd ed. Academic Press, New York. Moriasi, D.N., J.G. Arnold, M.W. Van Liew, R.L. Gingner, R.D. Harmel, and T.L. Veith. 2007. Model evaluation guidelines for systematic quantification of accuracy in watershed simulation. Trans. ASABE 50:885–900. Nash, J.E., and J.V. Sutcliffe. 1970. River flow forecasting through conceptual models. Part 1. A discussion of principles. J. Hydrol. 10:282–290. Nokes, S.E., F.M. Landa, and J.D. Hanson. 1996. Evaluation of the crop component of the root zone water quality model for corn in Ohio. Trans. ASAE 39:1177–1184. Nolan, B.T., R.W. Malone, L. Ma, C.T. Green, and D.B. Jaynes. 2011. Inverse modeling with RZWQM2 to predict water quality. p. xxx–xxx. In L.R. Ahuja and L. Ma (ed.) Methods of introducing system models into agricultural research. Adv. Agric. Systems Modeling 2. ASA, CSSA, SSSA, Madison, WI. Nolan, B.T., L.J. Puckett, L. Ma, C.T. Green, E.R. Bayless, and R.W. Malone. 2010. Predicting unsaturated zone nitrogen mass balances in diverse agricultural settings of the United States. J. Environ. Qual. 39:1051–1065. Qi, Z., M.J. Helmers, R.W. Malone, and K.R. Thorp. 2011. Simulating long-term impact of winter rye cover crop on hydrologic cycling and nitrogen dynamics for a corn-soybean cropping system. Trans. ASABE (in review). Quisenberry, V.L., R.E. Phillips, and J.M. Zeleznik. 1994. Spatial distribution of water and chloride macropore flow in a well–structured soil. Soil Sci. Soc. Am. J. 58:1294–1300. Rawls, W.J., D.L. Brakensiek, and K.E. Saxton. 1982. Estimation of soil water properties. Trans. ASAE 25:1316–1320, 1328. Ritchie, J.T., U. Singh, D.C. Godwin, and W.T. Bowen. 1998. Cereal growth, development and yield. p. 19–88. In G.Y. Tsuji et al. (ed.) Understanding options for agricultural production. Kluwer Academic Publ., Dordrecht, The Netherlands. NOT CITED. OK TO DELETE??? Rojas, K.W., L. Ma, J.D. Hanson, and L.R. Ahuja. 2000. RZWQM98 user guide. In L.R. Ahuja et al. (ed.) The Root Zone Water Quality Model. Water Resources Publ., Highlands Ranch, CO. Roy, W.R., I.G. Krapac, S.F.J. Chou, and R.A. Griffin. 1992. Batch-type procedures for estimating soil adsorption of chemicals. EPA/530-SW-87-006-F. USEPA, Cincinnati, OH. Sandipta, K.A.R., and S. Samarendra. 2002. Dynamics of water and fertilizer N as influenced by dry and wetland tillage in low retentive permeable soil. 17th WCSS, 14–21 Aug. 2002, Thailand. NOT CITED. OK TO DELETE??? Saseendran, S.A., L. Ma, R.W. Malone, P. Heilman, L.R. Ahuja, and R.S. Kanwar. 2007. Simulating management effects on crop production, tile drainage, and water quality using RZWQMDSSA. Geoderma 140:260–271. NOT CITED. OK TO DELETE??? Saseendran, S.A., L. Ma, D.C. Nielsen, M.F. Vigil, and L.R. Ahuja. 2005a. Simulating planting date effects on crop production using RZWQM and CERES-maize models. Agron. J. 97:58–71. Saseendran, S.A., D.C. Nielsen, L.R. Ahuja, T. Trout, and L. Ma. 2008. Simulations of limited-water irrigation management options for corn in dryland agriculture. Water Resour. Res. 44:W00E02, doi:10.1029/2007WR006181. NOT CITED. OK TO DELETE???
64
Ma et al.
Saseendran, S.A., D.C. Nielsen, D. Lyon, L. Ma, D.G. Felter, D.D. Baltensperger, G. Hoogenboom, and L.R. Ahuja. 2009. Modeling responses of dryland spring triticale, proso millet, and foxtail millet to initial soil water in the High Plains. Field Crops Res. 113:48–63. Saseendran, S.A., D.C. Nielsen, L. Ma, L.R. Ahuja, and A.D. Halvorson. 2004. Modeling nitrogen management effects on a winter wheat cropping system using RZWQM and CERES-wheat. Agron. J. 96:615–630. Saseendran, S.A., D.C. Nielsen, L. Ma, L.R. Ahuja, and M.F. Vigil. 2010. Simulating alternative dryland rotational cropping systems in the Central Great Plains with RZWQM2. Agron. J. 102:1521–1534. Saseendran, S.A., D.C. Nielsen, L. Ma, L.R. Ahuja, M.F. Vigil, J.G. Benjamin, and A.D. Halvorson. 2005b. Effectiveness of RZWQM for simulating alternative Great Plains cropping systems. Agron. J. 97:1183–1193. NOT CITED. OK TO DELETE???If deleted, editor remove a on 2005 ref above. Schepers, J.S., and A.R. Mosier. 1991. Accounting for nitrogen in nonequilibrium soil-crop systems. p. 125–138. In R.F. Follett et al. (ed.) Managing nitrogen for groundwater quality and farm profitability. SSSA, Madison, WI. Shaffer, M.J., K.W. Rojas, D.G. DeCoursey, and C.S. Hebsen. 2000. Nutrient chemistry processes– OMNI. p. 119–144. In L.R. Ahuja et al. (ed.) The Root Zone Water Quality Model. Water Resources Publ., Highlands Ranch, CO. Shen, J., W.D. Batchelor, J.W. Jones, J.T. Ritchie, R.S. Kanwar, and C.W. Mize. 1998. Incorporation of a subsurface tile drainage component into a soybean growth model. Trans. ASAE 41:1305–1313. Singh, P., R.S. Kanwar, K.E. Johnsen, and L.R. Ahuja. 1996. Calibration and evaluation of subsurface drainage component of RZWQM v2.5. J. Environ. Qual. 25:56–63. Sophocleous, M., M.A. Townsend, F. Vocasek, L. Ma, and K.C. Ashok. 2009. Soil nitrogen balance under wastewater management: Field measurements and simulation results. J. Environ. Qual. 38:1286–1301. Stehouwer, R.C., W.A. Dick, and S.J. Traina. 1993. Characteristics of earthworm burrow lining affecting atrazine sorption. J. Environ. Qual. 22:181–185. Stehouwer, R.C., W.A. Dick, and S.J. Traina. 1994. Sorption and retention of herbicides in vertically oriented earthworm and artificial burrows. J. Environ. Qual. 23:286–292. Wallach, D., D. Makowski, and J.W. Jones. 2006. Working with dynamic crop models: Evaluation, analysis, parameterization, and applications. Elsevier, Amsterdam. The Netherlands. Wauchope, R.D., L.R. Ahuja, J.G. Arnold, R. Bingner, R. Lowrance, M.Th. van Genuchten, and L.D. Adams. 2004b. Software for pest management science: Computer models and databases from the U.S. Department of Agriculture-Agricultural Research Service. Pest Manag. Sci. 59:691–698. NOT CITED. OK TO DELETE??? Wauchope, R.D., T.M. Buttler, A.G. Hornsby, P.W.M. Augustijn-Beckers, and J.P. Burt. 1992. The SCS/ARS/CES pesticide properties database for environmental decision-making. Rev. Environ. Contam. Toxicol. 123:1–164. Wauchope, R.D., R.G. Nash, L.L. McDowell, K.W. Rojas, L.R. Ahuja, G.H. Willis, T.B. Moorman, and Q. Ma. 2000. Pesticide processes. p. 163–244. In L.R. Ahuja et al. (ed.) The Root Zone Water Quality Model. Water Resources Publ., Highlands Ranch, CO. Wauchope, R.D., K.W. Rojas, L.R. Ahuja, Q.L. Ma, R.W. Malone, and L. Ma. 2004a. Documenting the pesticide processes module of the ARS RZWQM agroecosystem model. Pest Manag. Sci. 60:222–239. Watts, D.G., N.R. Fausey, and D.A. Bucks. 1999. Background of the MSEA-RZWQM modeling project. Agron. J. 91:169–170. Willmott, C.J. 1981. On the validation of models. Phys. Geogr. 2:184–194. Wu, L., R.R. Allmaras, J.A. Lamb, and K.E. Johnsen. 1996. Model sensitivity to measured and estimated hydraulic properties of a Zimmerman fine sand. Soil Sci. Soc. Am. J. 60:1283–1290. Wu, L., W. Chen, J.M. Baker, and J.A. Lamb. 1999. Evaluation of RZWQM field measured data from a sandy soil. Agron. J. 91:177–182. Yu, Q., G.N. Flerchinger, S. Xu, J. Kozak, L. Ma, and L.R. Ahuja. 2007. Simulation of energy balance and water and heat transfer by SHAW and RZ-SHAW. Trans. ASABE 50:1507–1516.