Etica & Politica / Ethics & Politics, XV, 2013, 2, pp. 58–81
Learning with whom to Interact: A Public Good Game on a Dynamic Network Matthias Greiff* Justus Liebig University Giessen Department of Economics
[email protected]
ABSTRACT We use a public good game with rewards, played on a dynamic network, to illustrate how self-organizing communities can achieve the provision of a public good without a central authority or privatization. Given that rewards are given to contributors and that the choice of whom to reward depends on social distance, free-riders will be excluded from rewards and the (almost efficient) provision of a public good becomes possible. We review the related experimental economics literature and illustrate how the model can be tested in the laboratory. KEYWORDS Dynamic networks, evolutionary game theory, public goods, reinforcement learning, social networks
1. Introduction A significant part of economics is concerned with the provision of public goods. Left to the market, public goods will be under-supplied because individuals tend to free-ride. A central authority can increase welfare by supplying the public good, or, if possible, the public good can be privatized. But besides provision by a central authority and privatization there is also a third way, as the work of Nobel Laureate Elinor Ostrom shows. The enormous amount of work done by her and her collaborators emphasizes that interpersonal relations are crucial in achieving the provision of public goods without privatization or outside authorities (Ostrom, 1990; Ostrom et al., 1992). A related strand of research, to which Ostrom also contributed, studied public good games in controlled laboratory environments and found that the introduction of rewards and punishments leads to a more efficient provision of the public good (Rand et al., 2009; Sefton et al., 2007; Andreoni et al., 2003; Fehr and Gächter, 2000; Ostrom et al., 1992). In fact, selective incentives *
The present work is a natural outgrowth of the investigations begun in Greiff (2011), comments and suggestions by Torsten Heinrich, Ulrich Krause, Hannes Rusch, Stefan Traub and an anonymous referee are greatly acknowledged.
58
Learning with whom to Interact: A Public Good Game on a Dynamic Network
in the form of graduated rewards and sanctions are of crucial importance for the successful provision of public goods by self-organizing communities. From a theoretical perspective the provision of public goods within selforganizing communities and the use of rewards and sanctions is puzzling. For selfish and rational agents free-riding is the dominant strategy in linear public good games, hence the first-order dilemma is the underprovision of public goods. And, assuming that rewarding and sanctioning is costly, no individual agent has an incentive to reward or punish. This second-order dilemma implies that the norm that solves the first-order dilemma will not be supplied. Ostrom’s self-organizing communities are able to provide a public good because they are able to solve the second-order dilemma. In this paper, I will focus on one specific mechanism that can solve the second-order dilemma. This mechanism is exclusion (Spiekermann, 2008; Stark and Behrens, 2010). Although many public goods are non-excludable, rewards given to those who contributed to the public good are excludable. If the increase in utility from receiving rewards outweighs the cost of contributing to the public good, rational agents will contribute. It has to be sure, however, that the benefit of the rewards is concentrated on those, who give the rewards. Put bluntly, rewards lead to the provision of the public good if those who give rewards are the ones who receive rewards. The aim of this paper is twofold: First, we will discuss an evolutionary model in which a public good game with rewards is played on an endogenously evolving network. Since the adaptive dynamics operate on both structure and strategy agents learn with whom to interact and how to act. The dynamic network represents interpersonal relations and is a key element in our model. Due to the dynamic nature of the network free-riders will be excluded from rewards and only contributors who give rewards will also receive rewards. The model shows that in order to provide a public good a community needs (i) a norm prescribing to contribute to the public good and (ii) a mechanism for norm-enforcement. The model reveals that a norm, prescribing prosocial behavior and thus solving the second-order dilemma, can emerge from a population of selfish agents so that the public good is provided more efficiently.1 Second, we will relate the model to the empirical evidence from experimental economics. We will review the evidence on rewards and punishments, partner selection, and social ties, and we will sketch how the model presented in this paper can be tested in a laboratory experiment.
1
In sketching the model, we do not discuss the related literature. For a discussion of the related literature the reader is refered to Greiff (2011, chapter 5), or Greiff (forthcoming, section 2).
59
MATTHIAS GREIFF
2. A Public Good Game with Rewards The model is a public good game with rewards, played on a network. Assuming rational and selfish agents, a dilemma arises because individual and social benefits do not coincide. Since nobody can be excluded from the use of the public good, nobody has an incentive to contribute to the public good. One way of solving the dilemma is to change the game by adding a second stage in which rewards can be given. Assume a group of 𝑛 agents playing a public good game. After choosing contributions, agents can give rewards. The game is played repeatedly and each repetition is referred to as a round of the game. Each round consists of two stages. In every stage all 𝑛 agents simultaneously make two decisions. • Stage 1 - Contributions to the public good: Each agent decides whether to contribute to the public good or not. Let 𝑐 ≥ 1 be the cost of contributing to the public good. The public good is nonrival in consumption, hence the benefit of the public good goes to all agents while costs are private. Assume that the quality of contributions is homogeneous and that 𝑘𝑖 = 1 if agent 𝑖 contributed and 0 else. We assume that the public good has a linear production function and the value of the public good is given by:2 𝑛
𝑃 𝐺(𝑘) = 𝜆𝑐
∑ 𝑖=1
𝑘𝑖
1 < 𝜆 < 1. 𝑛
(1)
• Stage 2 - Giving rewards: After the contribution stage, agents observe each others’ moves, i.e., the 𝑘𝑖 ’s are common knowledge. Each agent (giver) is matched with another agent (her opponent) and has the opportunity to assign a reward to her opponent (receiver). Receiving a reward results in an additional payoff of 𝑏 for the receiver at cost ℎ for the giver. We assume the additional payoff from receiving the reward is higher than the cost of giving the reward, ℎ ≤ 𝑏. A reward can be considered to create a bond of loyalty or an obligation, thereby affecting the social distance between giver and receiver. This is similar to gift-giving (Offer, 1997; Mauss, 1954): Like a gift, a reward is given voluntary, imposes costs on the giver and confers a benefit on the receiver. 2
Contributing to the public good increases an agent’s payoff by 𝜆𝑐 at cost 𝑐, hence rational agents have no incentive to contribute and the public good will not be supplied (𝑃 𝐺(0) = 0). Rational agents earn a payoff of zero. However, if all agents contribute, the public good will be supplied (𝑃 𝐺(𝑛) = 𝜆𝑐𝑛) and each agent’s payoff is given by 𝜆𝑐𝑛 − 𝑐 > 0, hence, a Pareto-improvement can be achieved.
60
Learning with whom to Interact: A Public Good Game on a Dynamic Network
The matchings between giver and receiver are not necessary symmetrical, i.e., in her role as a giver, agent A is matched with agent B in her role as a receiver, and agent B in her role as giver is not necessarily matched with agent B in her role as a receiver. If the matching happens to be symmetrical and both agents decide to give rewards, A gives a reward to B and A receives a reward from B. Such a bilateral exchange of rewards corresponds to a mutually beneficial transaction, also called direct reciprocity (e.g., cooperation, gains from trade, risk-sharing). If matchings are not symmetrical, network reciprocity becomes possible, e.g., if A gives a reward to B, B gives a reward to C, and C gives a reward to A. For each round of the game a strategy consists of three actions. Let 𝐴1 be the agent’s action in the first stage and let 𝐴2 |𝐶 and 𝐴2 |𝑁 denote the actions taken in the second stage conditional on the opponent’s behavior in the first stage. A complete strategy is given by (𝐴1 , 𝐴2 |𝐶, 𝐴2 |𝑁). We restrict the analysis to pure strategies and assume that rewards are given only to contributors, i.e., (𝐴2 |𝑁) = 0 for all agents.3 This allows us to represent an agent’s strategy as an ordered pair (𝐴1 , 𝐴2 |𝐶), defining the agent’s actions in each stage of the game. Agent 𝑖’s strategy space is the set containing all three pure strategies, 𝑆𝑖 = [(𝐶, 𝑅), (𝐶, 𝑁), (𝑁, 𝑁)], where 𝐶, 𝑅, 𝑁 correspond to a contribution was given, a reward was given, and no contribution or no reward was given, respectively. To facilitate further discussion of our model, we introduce some terminology. Enforcers play strategy (𝐶, 𝑅) and behave prosocial in both stages since they contribute to the public good and give rewards. Agents with strategy (𝐶, 𝑁) contribute to the public good but do not give rewards. Call agents with strategy (𝐶, 𝑁) Contributors. Note that both Contributors and Enforcers contribute to the public good. The last strategy is (𝑁, 𝑁), which neither contributes nor gives rewards. Call agents with this strategy Free-Riders. Correspondingly, there are three pure population states in which all agents employ the same strategy, called Enforcement State, Contribution State, and Free-Rider State. Table 1 summarizes the labeling of the three strategies. The first two columns represent the strategy and its name. The third column gives the frequency of each strategy in the population. We will refer to the vector 𝑠 = (𝑠1 , 𝑠2 , 𝑠3 ) as the state of the population. The last column gives the name of the pure population state in which all players employ the same strategy. 3
This assumption is closely in line with the experimental evidence on rewards and punishments in public good games, mentioned in section 3 below. In Greiff (forthcoming) we relax this assumption.
61
MATTHIAS GREIFF
Strategy (𝐶, 𝑅) (𝐶, 𝑁) (𝑁, 𝑁)
Name
%
Pure State
Enforcer 𝑠1 Enforcement State Contributor 𝑠2 Contribution State Free-Rider 𝑠3 Free-Rider State
Table 1: Strategies and population states for the public good game with rewards. The solution of the game depends on matching assumption, as we will discuss in the remainder of this section. First, we solve the model under the random matching assumption, then we solve the model under assortative matching, and finally, we solve the model under the assumption that the matching process is governed by a dynamic network evolving according to reinforcement learning dynamics. We find that under the random matching assumption, the public good will not be supplied. Substituting assortative matching for random matching changes the dynamics of the model and the provision of the public good becomes possible. With assortative matching, however, the underlying structure of the population is not explained but simply assumed. This is different if a dynamic network is assumed because then, the model explains how agents learn with whom to interact and how the dynamic network evolves. 2.1. Random Matching Suppose that 𝑛 is very large and agents are randomly drawn from the population. All pairwise interactions are equally likely, i.e., the probability that agent 𝑖 plays against agent 𝑗 ≠ 𝑖 in the reward stage is given by 1𝑛 . We summarize all payoffs in matrix 𝐗. ⎡ 𝑃𝐺 − 𝑐 + 𝑏 − ℎ 𝑃𝐺 − 𝑐 − ℎ 𝑃𝐺 − 𝑐 𝑃𝐺 − 𝑐 𝑃𝐺 − 𝑐 𝐗 = ⎢ 𝑃𝐺 − 𝑐 + 𝑏 ⎢ 𝑃𝐺 𝑃𝐺 𝑃𝐺 ⎣
⎤ ⎥ ⎥ ⎦
(2)
The payoff for an agent using strategy 𝑖 against an agent using strategy 𝑗 is given by the (𝑖, 𝑗)-th entry of matrix 𝐗. Expected payoffs of all three strategies are given by the rows of 𝐗 and spelled out in equations (3) to (5) where 𝑃 𝐺 = 𝑃 𝐺((𝑠1 + 𝑠2 )𝑛). 𝐸 [𝜋(𝐶, 𝑅)] = 𝑃 𝐺 − 𝑐 + 𝑠1 (𝑏 − ℎ) − 𝑠2 ℎ 𝐸 [𝜋(𝐶, 𝑁)] = 𝑃 𝐺 − 𝑐 + 𝑠1 𝑏 𝐸 [𝜋(𝑁, 𝑁)] = 𝑃 𝐺
(3) (4) (5)
Reproduction takes place continuously over time. Assume that strategies evolve according to the well-known replicator dynamics (Taylor and Jonker, 62
Learning with whom to Interact: A Public Good Game on a Dynamic Network
1978).4 The three differential equations (6) to (8) describe the evolution of the population state. 𝜋 ̄ denotes the average payoff. The dynamics are visualized in Figure 1. Each point in the simplex corresponds to a specific population state and the arrows indicate the dynamics. The vertices correspond to the Enforcement State (100% (𝐶, 𝑅)-agents), the Contribution State (100% (𝐶, 𝑁)-agents) and the Free-Rider State (100% (𝑁, 𝑁)-agents), respectively. 𝑠1̇ = 𝑠1 [𝐸 [𝜋(𝐶, 𝑅)] − 𝜋]̄ 𝑠2̇ = 𝑠2 [𝐸 [𝜋(𝐶, 𝑁)] − 𝜋]̄ 𝑠3̇ = 𝑠3 [𝐸 [𝜋(𝑁, 𝑁)] − 𝜋]̄
(6) (7) (8)
𝜋̄ =
𝑠 (𝐗𝑠)𝑗 = 𝑠1 𝐸 [𝜋(𝐶, 𝑅)] + 𝑠2 𝐸 [𝜋(𝐶, 𝑁)] + 𝑠3 𝐸 [𝜋(𝑁, 𝑁)] (9) ∑ 𝑗 As we can see from the expected payoffs, Enforcers (𝐶, 𝑅) are strictly dominated, 𝐸 [𝜋(𝐶, 𝑁)] > 𝐸 [𝜋(𝐶, 𝑅)]. This means that Enforcers will die out eventually. The two remaining strategies are Contributors (𝐶, 𝑁), and FreeRiders (𝑁, 𝑁). Since (𝑁, 𝑁) strictly dominates (𝐶, 𝑁), free-riding is the unique Nash equilibrium. The dynamics of the population state visualized in Figure 1 confirm that the population will end up at the pure state with 100% Free-Riders. With random matching the unique Nash equilibrium is also the evolutionary stable strategy (ESS). This can be proven by looking at the best reply functions. Strategy (𝑁, 𝑁) is the only strategy which is best reply to itself, hence it is an ESS.5 𝜋(𝑥, 𝑁𝑁) ≤ 𝜋(𝑁𝑁, 𝑁𝑁) ∀𝑥 ∈ 𝑆𝑖 , with strict equality only if 𝑥 = 𝑁𝑁
(10)
Giving a reward is costly and Enforcers will always be dominated by Contributors, as well as Contributors will be dominated by Free-Riders. No rewards will be given and we are back to the public good game without rewards in which the dominant strategy is to free-ride. This result holds for any size of the reward. Rewards cannot solve the first-order dilemma because they introduce a second-order dilemma, but if we allow for exclusion by dropping the random matching assumption, the dilemma can be solved. 4
For mathematical convenience we model a continuous process for the evolution of the population in this section where the results are derived analytically. A discrete process is used in section 2.3 where we use simulations in order to derive the results. 5 Introducing the strategy (𝑁, 𝑅) would make no difference since it is weakly dominated by (𝑁, 𝑁). The Nash equilibrium would then be any mixture of (𝑁, 𝑁) and (𝑁, 𝑅) agents who would earn the same payoff. There are no contributions to the public good and no rewards are given. Both strategies would be behaviorally indistinguishable. The only difference is based on a counterfactual (i.e., if another agent had contributed (𝑁, 𝑅) would give a reward).
63
MATTHIAS GREIFF
Fr eeRi derSt at e
Enf or cementSt at e
Cont r i but i onSt at e
Figure 1: Simplex diagram showing the dynamics of the population state (𝑐 = 1.0, ℎ = 0.1, 𝑏 = 1.3). A population state on the line joining the lower left and lower right corner of the simplex correspond to an efficient provision of the public could. 2.2. Assortative Matching With random matching Contributors will exploit Enforcers. Enforcers will change their strategy to (𝐶, 𝑁) first and then to (𝑁, 𝑁) (represented by a counterclockwise movement in the simplex, Figure 1, from the lower left corner to the upper corner). Consequently, the public good will not be supplied. This result changes if the probability of exploitation is reduced through assortative matching which introduces a correlation between strategy and matching probabilities (Skyrms, 1996). Assume that agents are able to recognize each other’s strategy, and that each agent prefers to interact with another agent of the same strategy. Let the probability that an agent with strategy 𝑥 will interact with another agent with strategy 𝑥 be given by 𝑝(𝑠𝑥 |𝑠𝑥 ). The probability that an agent with strategy 𝑥 meets another agent with strategy 𝑦 in the second stage is given by 𝑝(𝑠𝑦 |𝑠𝑥 ). 𝑝(𝑠𝑥 |𝑠𝑥 ) = 𝑠𝑥 + 𝑒(1 − 𝑠𝑥 ) 𝑝(𝑠𝑦 |𝑠𝑥 ) = 𝑠𝑦 − 𝑒𝑠𝑦 ∀𝑦 ≠ 𝑥 Assortative matching changes the second stage of the game. The parameter 𝑒 measures the strength of assortative matching with 𝑒 = 0 for random matching (uncorrelated encounters) and 𝑒 = 1 for perfect correlation. Ex64
Learning with whom to Interact: A Public Good Game on a Dynamic Network
(a)
(b)
Figure 2: Simplex diagrams showing the dynamics of the population state with (a) weak assortative matching, 𝑒 = 0.25, and (b) strong assortative matching, 𝑒 = 0.5 (𝑐 = 1.0, ℎ = 0.1, 𝑏 = 1.3). pected payoffs are now given by equations 11 to 13. 𝐸 [𝜋(𝐶, 𝑅)] = 𝑃 𝐺 − 𝑐 + 𝑝(𝑠 𝑝(𝑠2 |𝑠1 )ℎ ⏟⏟⏟⏟⏟⏟⏟⏟⏟⏟⏟⏟⏟ 1 |𝑠1 )(𝑏 − ℎ) − ⏟⏟⏟⏟⏟ increasing with 𝑒
𝐸 [𝜋(𝐶, 𝑁)] = 𝑃 𝐺 − 𝑐 + 𝑝(𝑠 ⏟⏟⏟ 1 |𝑠2 )𝑏
(11)
decreasing with 𝑒
(12)
decreasing with 𝑒
𝐸 [𝜋(𝑁, 𝑁)] = 𝑃 𝐺
(13)
For all values of 𝑒 the expected payoff for free-riding, (𝑁, 𝑁), is the same since Free-Riders neither give nor receive rewards. With random matching (𝑒 = 0) all agents contributing to the public good (Contributors and Enforcers) have the same chance of receiving a reward since they have the same probability of meeting an Enforcer who gives a reward, (𝑝(𝑠1 |𝑠1 ) = 𝑝(𝑠1 |𝑠2 ) = 𝑠1 ). With assortative matching (𝑒 > 0) the probability that two Enforcers meet is larger than the probability that for a Contributor to meet an Enforcer 𝑝(𝑠1 |𝑠1 ) > 𝑠1 > 𝑝(𝑠1 |𝑠2 ). The expected payoff for Contributors decreases because they are less likely to meet an Enforcer who will give a reward. Hence, Enforces will, on average, receive higher payoffs than Contributors. Assortative matching changes the population dynamics, as can be seen in Figure 2 showing the dynamics for different values of 𝑒. With random matching the Nash equilibrium prediction and the evolutionary stable strategy coincide. This is not the case any more if we assume assortative matching. There is another stable state of the population in which all agents contribute and give rewards. This is the Enforcement State corresponding to the 65
MATTHIAS GREIFF
2 p3,2 p2,3 3 p2,1 p1,2 p3,1 p1,3
p4,2 p2,4 p4,3 p3,4
p5,2
1
p2,5
p3,5 p5,3
p4,1 p1,4 p5,1 p1,5
4 p4,5 p5,4 5
Figure 3: Social network and matching probabilities 𝑝𝑖,𝑗 for 𝑛 = 5. lower left corner in the simplex.6 If we compare Figures 2(a) and 2(b) we see that by increasing 𝑒 the size of the basin of attraction for the Enforcement State increases. This means that if we start from random initial conditions the population is more likely to end up at the Enforcement State in which all agents follow the norm (contribute and enforce the norm by giving rewards to contributors) and the public good will be supplied. But how exactly is assortative matching supposed to arise? In this section it was just assumed that agents preferably interact with others of same strategy. For agents who give rewards assortative matching is perfectly rational, but for all other agents this makes no sense because every agent is better off if she interacts with an Enforcer and can exploit her. In the next section, we let agents play the public good game on a dynamic network. Starting from random matching the network will evolve, leading to constrained interaction where Enforcers will interact with each other (assortative matching). 2.3. Matching Process Governed by a Dynamic Network With random or assortative matching, matching probabilities are exogenously given. In this section, we endogenize matching probabilities by modeling the social distance between agents.7 Social distances are modeled using a dynamic network. The network’s structure is a weighted and directed graph represented by the adjacency matrix 𝑊 . The network is directed 6
There is also an additional unstable equilibrium lying on the line joining the lower left and the upper corner. 7 For a detailed discussion of dynamic networks, see Skyrms and Pemantle (2000), Bonacich and Liggett (2003) and Pemantle and Skyrms (2004).
66
Learning with whom to Interact: A Public Good Game on a Dynamic Network
and the matrix will, in general, not be symmetric. Weights are assigned to all links and each entry of the matrix 𝑊 is the weight of the link (with 𝑤𝑖,𝑗 = 0 if there is no link). We assume that 𝑤𝑖,𝑖 = 0 for all 𝑖. Each row (𝑤𝑖,1 , 𝑤𝑖,2 , … , 𝑤𝑖,𝑛 ) measures the closeness of all other agents to agent 𝑖. Probabilities of interaction are obtained from the weights by 𝑝𝑗,𝑖 =
𝑤𝑗,𝑖 ∑𝑛𝑠=1 𝑤𝑗,𝑠
.
(14)
All probabilities are collected in a matrix 𝑃 , which represents the state of the network.8 Figure 3 illustrates the social network and associates probabilities of interaction for 𝑛 = 5. ⎡ ⎢ 𝑊 =⎢ ⎢ ⎣
𝑤1,1 𝑤1,2 𝑤2,1 … ⋮ ⋱ 𝑤𝑛,1 …
… 𝑤1,𝑛 ⋱ 𝑤2,𝑛 ⋱ … … 𝑤𝑛,𝑛
⎤ ⎥ ⎥ ⎥ ⎦
(15)
Initially, the weights of all links are set to a constant, 𝑤𝑖,𝑗 = 𝑤̄ for all 𝑖 ≠ 𝑗. The initial situation corresponds to random matching in the sense that all pairwise interactions are equiprobable. Then, the weights evolve depending on the outcome of the second stage of the game. In the public good game with rewards an agent’s action in the first stage affects all other agents’ payoffs in the same way. If an agent contributes, she increases all other agents’ payoffs because of the positive externality associated with the public good; and if she defects, all other agents’ payoffs are unaffected. We assume that agents’ actions in the first stage have no direct effect on the social network. In the second stage of the game agents give and receive rewards, and this is what determines the evolution of the network. By lowering social distance the likelihood that the receiver will reciprocate increases. In the reward stage, we allow each agent to give 𝑚 rewards at most. Giving rewards changes the social structure by decreasing the receiver’s social distance to the giver. Denote the set of all contributors containing all Enforcers and Contributors by 𝐐. Each Enforcer 𝑖 selects 𝑚 other agents at most (fewer than 𝑚 agents if there are fewer than 𝑚 contributors). The probability that a particular contributor 𝑗 is selected by agent 𝑖 is proportional to the strength of the link 𝑤𝑖,𝑗 . This reflects the intuition that agents are more likely to give rewards to contributors who are close to them. Denote the set 8
To be precise: The weights are inversely related to social distance. Higher values for 𝑤𝑖,𝑗 indicate that the social distance between 𝑖 and 𝑗 is lower. One possible metric for social distance between agents 𝑖 and 𝑗 is given by (1 − 𝑝𝑖,𝑗 ) ∈ [0, 1]. The limiting case 𝑝𝑖,𝑗 = 0 then implies that agent 𝑖 has no link to agent 𝑗, i.e., the social distance between them is at its maximum 𝑝𝑖,𝑗 = 1.
67
MATTHIAS GREIFF
of all agents selected by agent 𝑖 as 𝐐𝑖 ⊆ 𝐐. Agent 𝑖 now gives a reward to each agent she has selected (all agents in 𝐐𝑖 ). We assume that each Enforcer gives either zero or one reward (but not two or more rewards) to each contributor. At the end of the reward stage, the weights of the network are updated according to equation 16. 𝑤𝑗,𝑖 (𝑡 + 1) =
𝑑𝑤𝑗,𝑖 (𝑡) + 𝑏 if player 𝑖 gave a reward to agent 𝑗 else { 𝑑𝑤𝑗,𝑖 (𝑡)
(16)
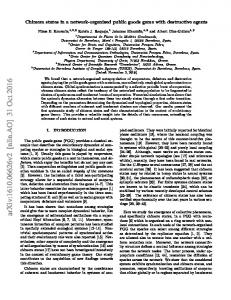
The parameter 𝑑 ∈ [0, 1] is a discount factor giving less weights to payoffs accumulated in the past, and 𝑏 > 0 is the reward. Thus, interactions that resulted in a higher payoff are more likely to be repeated. At this point it should be clear that the structure of the network is of crucial importance. Both Enforcers and Contributors are in the set 𝐐 and receive rewards. The distribution of rewards between Enforcers and Contributors depends on the structure of the network and determines the payoffs which in turn determine the population dynamics. In a nutshell, a typical round of the public good game with rewards on a dynamic network can be summarized as follows: In the first stage, all agents decide whether to contribute or not. In the second stage of the game, agents are matched, and partner choice is governed by matching probabilities (equation 14). This implies that agents will interact more often with agents who are close to them, and if they give rewards, they will give them more often to agents who are close to them. At the end of each round, weights evolve according to the learning dynamics (equation 16).9 In the following section, we illustrate the dynamics of the network when agents’ strategies are fixed, before we present the results for the case in which agents’ strategies and the network coevolve. 2.3.1. Fixed Strategies In this section we fix strategies and focus on the evolution of the network. Let there be 𝑛 agents and assume that the three strategies (Enforcers, Contributors, Free-Riders), are randomly distributed. Agents keep their initial strategy but the social structure evolves according to equation 16. Figure 4 shows the structure of the network after 1.000 periods and illustrates how agents who do not behave as prescribed by the social norm are excluded from its benefits. Figure 4(a) depicts a public good game where agents could give 𝑚 = 1 reward. We see that Enforcers form dyads and reciprocally
9
There is a growing literature on rational choice models of network formation, which is beyond the scope of this paper. For surveys, see Kosfeld (2004); Jackson (2005).
68
Learning with whom to Interact: A Public Good Game on a Dynamic Network
3
4
3
2
5
4
1
6
2
5
8
1
6
8
7
7
(a)
(b)
Figure 4: A reciprocal network. No updating of strategies, 𝑚 = 1 (left) and 𝑚 = 2 (right), 𝑑 = 0.9. (𝐶, 𝑅) agents (yellow) have reciprocal links, (𝐶, 𝑁) agents (red) have only outgoing links, and (𝑁, 𝑁) agents (blue) get isolated. Darker links correspond to higher probabilities of interaction (black if 𝑝 = 1.0, white if 𝑝 = 0.0). give rewards to each other.10 Social distances are symmetric indicating the absence of hierarchical relations. Contributors have only outgoing links. The absence of incoming links reflects the fact that they do not give rewards. The last group consists of Free-Riders who neither contribute nor give rewards. Since they do not give or receive any rewards they are isolated. Figure 4(b) shows the structure of the network after 1.000 periods when players are allowed to give 𝑚 = 2 rewards. While before Enforcers formed dyads, now they form triads. Within the triads social distances are symmetric indicating reciprocity. Generally, it holds that without updating of strategies all Enforcers form a reciprocal network. Enforcers exchange rewards with each other in a reciprocal way and all other agents are excluded from receiving rewards. In the long-run, the probability that Contributors and Free-Riders will receive rewards converges to zero. This result (exclusion) holds independently of the parameters 𝑏, 𝑑 and 𝑚. Changing the parameters only changes the time in which we arrive at the result.11 At first sight, the networks in Figure 4 seem to be peculiar. Agents in10
In case the number of Enforcers is odd there will be dyads and one star consisting of three agents. In each period the agent at the center of the star receives rewards from both other agents and gives a reward to each of the two other agents with probability 0.5. 11 For a proof, see (Greiff, 2011, p. 152).
69
MATTHIAS GREIFF
teract with one or two other agents, ignoring all others. Clearly, this is not a realistic feature of the model, but it is worth looking at it for the following reasons. First, in studying the evolution of the dynamic network, we look at the tendency of matching probabilities to converge toward some limiting values, which is interesting from a mathematical point of view, but not representative of actual interactions. In fact, the model’s limiting behavior does not intend to give a realistic account of networks of interpersonal relations. Rather, the aim of the model is to explain the mechanisms underlying network formation in the most simple models, so that these simple models can serve as building blocks for more complex models. Second, the long-run behavior of the dynamic network does not resemble the structure of real-world networks, because long-run limiting behavior might not be seen in reality. This is because of the time it takes in order to arrive at the limiting state, and because of exogenous shocks. Even if the underlying game would be representative of real-world interactions, we would not expect to find a real-world network that closely resembles the long-run prediction, because the time it takes in order to arrive at this state is simply too long. Also, in order to arrive at the long-run structure of the network, the game must be played for a large number of rounds without any exogenous shocks. In simulating how agents play the game, this is exactly what we do, but in the real world, there will be exogenous shocks (e.g., changes in the payoffs, mutation in agents’ strategies, arrival of new agents and death of existing agents) which will prevent the network from converging to its long-run structure. 2.3.2. Coevolution of Strategies and Network In this section, we consider the same model as above but, in addition, we allow agents to change their strategy. At the end of each round each agent reconsiders her strategy with probability 𝛼. She looks at the agent who has earned the highest payoff this round and imitates her strategy. With a small probability (𝜂) agents mutate and adopt a randomly chosen strategy. Since strategies and network coevolve, an equilibrium must be an equilibrium in strategies and in the structure of the network. First, consider what happens if mutation is turned off, 𝜂 = 0%. Table 2 gives the number of simulations that converged to the Enforcement State, the Contributing State and the Free-Rider State. For each value of 𝛼, 100 simulations were run for 500 periods. Since all columns sum up to 100, we know that all simulations converged to one of the three pure states. At the pure states all agents employ the same strategy and the network remains constant. If all agents are Enforcers the network will be reciprocal, as described in section 2.3.1. By looking at the first row (Table 2) we find that convergence to the Enforcement State becomes less likely if agents change 70
Learning with whom to Interact: A Public Good Game on a Dynamic Network 𝛼 Enforcement State Contribution State Free-Rider State
0.05 0.06 0.07 0.08 0.09 0.10 0.11 0.12 0.12 0.13 0.14 99 0 1
95 2 3
86 5 9
70 19 11
67 21 12
61 20 19
43 36 21
36 41 23
25 53 22
14 57 29
10 63 27
Table 2: No mutation. Number of simulations (out of 100) that converged to the prosocial, dissembling and antisocial state. Parameters: 𝑛 = 100, 𝑑 = 0.9, 𝑐 = 1.0, 𝑚 = 1, 𝑏 = 1.3, ℎ = 0.1, 𝑡 = 500. their strategies more often (higher 𝛼). From rows 2 and 3 we see that, if agents change their strategies more often, the population converges to the Contributing State more often than to the Free-Rider State. This follows from the fact that for high values of 𝛼 Contributors receive the highest payoff. If Enforcers are present, they will give rewards to Contributors. Since Contributors have the highest payoff, they will be imitated by all others and the population converges to the Contributing State. Of course this happens only if the network has evolved in such a way that Contributors are not excluded from the benefits of rewards. Otherwise, the population will converge to the Enforcement or Free-Rider State. Now we introduce a small, positive probability of mutation (𝜂 = 1%). In the presence of mutation it is still possible that the population converges to one of the states where all agents have the same strategy, but the population will not stay there for long. All three pure states (i.e., states in which all agents have the same strategy) are unstable since they can be invaded by a small number of mutating players. Consider a situation in which every agent is an Enforcer and the average payoff is 𝑃 𝐺 − 𝑐 + 𝑚(𝑏 − ℎ). Contributors can invade the population. If an Enforcer randomly changes her strategy and becomes a Contributor she will not pay the cost of enforcing the norm (i.e., the cost of giving a reward) but she will receive rewards. Assuming that she receives 𝑚 rewards, her payoff is given by 𝑃 𝐺 − 𝑐 + 𝑚𝑏. Since the Contributor’s payoff is higher than the Enforcer’s payoff, the fraction of Contributors will increase. As more and more players become Contributors, the total amount of rewards given decreases and, over time, Enforcers learn that Contributors do not reciprocate by returning rewards. Consequently, the network changes Contributors will be excluded from rewards, hence they now receive a lower payoff than Enforcers and Contributor’s population share starts decreasing. If every agent is a Contributor the population can be invaded either by one Free-Rider or by two Enforcers. In a population of 100 % Contributors each agent’s payoff is given by 𝑃 𝐺 − 𝑐. A single agent changing her strategy to Free-Rider would earn a higher payoff, hence the fraction of Free-Riders would increase. Alternatively, it is possible that two agents change their 71
MATTHIAS GREIFF
strategies to Enforcer. These two Enforcers contribute to the public good and give rewards to each other; their payoff is 𝑃 𝐺 − 𝑐 + 𝑚(𝑏 − ℎ) while the payoff of a typical Contributor is 𝑃 𝐺 −𝑐. Since Enforcers earn a higher payoff than Contributors the fraction of Enforcers will increase. In a similar way a population of 100 % Free-Riders can be invaded by Enforcers. Given that the state of the population will not converge to a pure state, how will the population state evolve? To answer this question we ran simulations for varying values of 𝛼 and estimated average population shares of Enforcers, Contributors and Free-Riders. For each value of 𝛼, 100 simulations were run for 𝑡 = 600 periods; the first 100 observations were discarded to avoid the influence of initial fluctuations. Figure 5 shows the mean values and standard deviations of the population shares for different values of 𝛼. We see that as 𝛼 increases the share of Enforcers decreases (Figure 5(a)). The share of Contributors increases until about 𝛼 = 10% and then decreases slightly but is relatively high (between 60% and 80%, see Figure 5(b)). For Free-Riders it is noteworthy that their share increases as 𝛼 increases beyond 10% and standard deviations increase also (Figure 5(c)). The large standard deviations can be explained by looking at the representative simulation runs in Figures 6 and 7. The representative simulations were run for 𝑡 = 2.000 periods. The simplexes (Figure 6) represent the population states, ignoring the time dimension, and the other graphs in Figure 7 show the evolution of the strategy shares over time. For very small values of 𝛼 the share of Contributors is high (see Figures 5(b) and 7(d)) while the shares of Enforcers and Free-Riders (Figures 7(a) and 7(g)) are small but positive. Moreover, population shares are relatively stable. As the simplex (Figure 6(a)) shows, the populations spends most of its time in the neighborhood of the lower right vertex, representing 100% Contributors. Although agents still change their strategies the distribution of strategies remains roughly constant. There are periods in which Contributors have the highest payoff alternating with periods in which either Enforcers or Free-Riders have the highest payoff. If a well-connected Enforcer mutates and becomes a Contributor, this particular Contributor receives the highest payoff and will be imitated, leading to an increase in the share of Contributors. After a while, however, Contributors are excluded from rewards and have an incentive to change back to the Enforcer strategy. Since both Enforcers and Contributors contribute to the public good a stable and sustainable provision can be achieved. This slightly noisy equilibrium persists and is robust to mutations. Almost all agents contribute to the public good although there are only very few agents enforcing the norm. After a while (the first 200 periods) in which the share of Enforcers was high most agents contribute to the public good and there is no need for much enforcement, so 72
Learning with whom to Interact: A Public Good Game on a Dynamic Network % Enforcers HCRL 60
40
20
0.05
0.1
0.15
0.2
0.25
Α
-20
(a)
% Contributors HCNL 100
80
60
40
20
0.05
0.1
0.15
0.2
0.25
0.15
0.2
0.25
Α
(b) % Free-Riders HNNL
50
40
30
20
10
0.05
0.1
Α
(c)
Figure 5: Statistical results: Mean values and standard deviations for Enforcers (top), Contributors (middle) and Free-Riders (bottom); 𝜂 = 1%, 𝑚 = 1, 𝑏 = 1.3, ℎ = 0.1, 𝑑 = 0.9, 𝑛 = 100. 73
MATTHIAS GREIFF
(a) Simplex, 𝛼 = 0.05.
(b) Simplex, 𝛼 = 0.15.
(c) Simplex, 𝛼 = 0.30.
Figure 6: Simplexes for 𝛼 = 0.05, 𝛼 = 0.15 and 𝛼 = 0.30. the share of Enforcers declines (Figure 7(a)). For high values of 𝛼 the population state evolves faster and different. It evolves faster because more agents change their strategies within each period and it evolves different because the evolution of strategies is faster compared to the evolution of the network. It becomes less likely that an Enforcer receives the highest payoff and gets imitated. The population state fluctuates between almost all agents being Contributors and almost all agents being Free-Riders (as can be seen in Figures 7(e), 7(h), 7(f) and 7(i)). For short periods of time the share of Enforcers gets relatively large (see the spikes in Figures 7(b) and 7(c)) but as 𝛼 increases these fluctuations become less frequent. There will be only short periods of time in which most agents contribute to the public good and a stable and sustainable provision of the public good will be impossible.
3. Evidence from Experimental Economics In this section, we review the experimental evidence supporting the model presented above. The experimental literature on public good games with rewards and punishments is large and the contributions are too many to give a complete survey. Instead, we will mention a few important studies and the results that are robust across studies. Then, we will take a closer look at the experimental evidence on reputation-based partner choice and social ties. Starting with Fehr and Gächter (2000) there began an enormous interest in studies investigating the effects of rewards and punishments in public good games. A survey of the effect of punishment can be found in Chaudhuri (2011, section 3), and the differences between rewards and punishments are discussed in various studies (e.g.,Dickinson (2001); Andreoni et al. (2003); Sefton et al. (2007); Rand et al. (2009)). From these and numerous other public good experiments the main results are the following: Without rewards or 74
Learning with whom to Interact: A Public Good Game on a Dynamic Network
punishments, contributions start around 40 or 50 per cent of endowment, but then decrease with repetition. High contributions can be sustained (except for an end-game-effect) if participants are given the opportunity to punish or reward each other. Participants whose contributions are above average are rewarded and participants whose contributions are below average are punished, although a small fraction of participants are antisocial punishers, punishing those who made high contributions.12 Regarding the effectiveness of punishments and rewards there is no consensus. Sefton et al. (2007), for example, argue that punishment is more effective than rewards because over time, the use of punishment stays high while use of rewards decreases. Rand et al. (2009) observe the opposite: Over time, the use of punishment decreases while the use of rewards remains high. More interestingly, Rand et al. (2009) argue that rewards are more effective than punishments because only punishment gives rise to acts of revenge and has a negative effect on interpersonal relationships. Unfortunately, they do not measure the effects of rewards and punishments on interpersonal relationships. Another strand of research related to interpersonal relations is the literature on reputation-based partner choice, or competitive altruism. Here, the key idea is that cooperation is a costly signal of cooperative intent which can be beneficial by providing better access to cooperative relationships. The hypothesis is that, if participants are given the opportunity to choose partners, they will choose partners who showed prosocial behavior in past interactions. Barclay and Willer (2007), for example, conduct a public good game between two participants. In the first stage, the two participants play one round of the public good game while being monitored by a third participant. In the second stage, the third participant can choose with whom to interact, and in almost all cases, the third participant chose the participant who was more generous in the first stage. Other public good games with partner selection, which confirm that the freedom to choose an interaction partner increases contributions are Hauk and Nagel (2001); Coricelli et al. (2004); Page et al. (2005) and Sylwester and Roberts (2010). For dictator and trust games, Slonim and Garbarino (2008) show that partner selection increases altruism and trust rates. Although these experiments do not explicitly test how rewards are given, they provide sound evidence that, if given the freedom to choose, participants prefer to interact with those who behaved prosocially. However, the motivation behind it is unclear. Do participants choose partners who behaved prosocially in the past because they expect to exploit these partners in future interactions, or because they are conditional cooperators who ex12
For details on antisocial punishment, see Herrmann et al. (2008) and Gächter and Herrmann (2009).
75
MATTHIAS GREIFF
pect mutual cooperation? Also, it is unclear what evidence we can draw from the choice of partners to interpersonal relations. A more sophisticated approach directed at the measurement of social ties is van Winden’s social ties model (van Dijk et al., 2002; van Winden et al., 2008; van Winden, 2012). In this model, agents have social preferences with the weight given to another agent’s payoff depending on the strength of the social tie between both agents, which changes over time due to automatic affective responses. Several experiments (van Dijk et al., 2002; Sonnemans et al., 2006; Brandts et al., 2009) confirmed that the strength of social ties depends on the success of past interactions or, to be more precise, that the social tie between agents A and B depends on B’s contribution relative to the some reference contribution. In principle, van Winden’s model could be modified to incorporate rewards, so that the social tie between A and B depends on B’s contribution and on the rewards given from B to A. The key aspect of our model is the link between rewards and partner choice: Receiving rewards reduces social distance (or strengthens social ties and hence interpersonal relationships, see equation 16), and social distance affects partner choice. Based on the evidence reviewed above, we conjecture that our model would be confirmed by empirical tests. If carried out in the laboratory, a test of this model would look as follows: A fixed group of participants play a finitely repeated public good game with rewards. For the sake of concreteness, assume that the game is repeated 20 rounds. Within each round, each participant decides whether to contribute or not. Then, participants’ decisions are made public and each participant decides whether to reward one contributor, who can be chosen deliberately. At the beginning of the experiment and after rounds 5, 10, 15 and 20 the strengths of social ties are measured. This could be done using a modified version of the circletest, as in van Dijk et al. (2002) but with modifications as described in Greiff (2013).13 To avoid confounding effects, participants should not be informed about the outcomes of the ring tests until the end of the experiment. According to our model, we expect to see the following two behavioral regularities. First, we expect to see that the strength of the social tie between participants A and B is proportional to the number of rewards given from A to B. And second, we expect to see that participants give rewards based on social distance, i.e., if both B and C contributed to the public good, participant A is more likely to give a reward to B if 𝑤𝐴,𝐵 > 𝑤𝐴,𝐶 .
13
The original source of the ring test is Liebrand (1984), where the test was used to measure social value orientation. It’s name is derived from the design of the test: In a coordinate system with the payoff to oneself on one axis and the payoff to the partner on the other axis, all payoff combinations lie on a circle with center (0,0) and radius 500.
76
77
10
20
30
40
Share
20
40
60
80
Share 100
20
40
60
80
Share
1000
1500
1000
1500
1000
1500
2000
2000
2000
Time
Time
Time
1000
1500
2000
Time
Share
1000
1500
2000
Time
20
40
60
80
Share
1000
1500
(h) Share of Free-Riders.
500
(e) Share of Contributors.
2000
Time
20
40
60
80
100
Share
20
20
60
80
40
500
Share 100
40
60
80
100
(b) Share of Enforcers.
20
20
60
80
100
Share
40
500
𝛼 = 0.15
40
60
80
Share 100
1000
1500
1000
1500
1000
1500
(i) Share of Free-Riders.
500
(f) Share of Contributors.
500
(c) Share of Enforcers.
500
𝛼 = 0.30
Figure 7: Representative run for 𝛼 = 0.05, 𝛼 = 0.15 and 𝛼 = 0.30.
(g) Share of Free-Riders.
500
(d) Share of Contributors.
500
(a) Share of Enforcers.
500
𝛼 = 0.05
2000
2000
2000
Time
Time
Time
Learning with whom to Interact: A Public Good Game on a Dynamic Network
MATTHIAS GREIFF
4. Concluding Remarks In this paper, we reviewed a model of a public good game with rewards played on a dynamic network, surveyed the experimental evidence with a focus of partner choice and social ties, and sketched how an experimental investigation of this model might look like. Testing the model in the laboratory would be one obvious way for further research, but beyond that, other possibilities for further research suggest themselves. The model, as it is presented in this paper, is extremely simple. Agents are homogeneous and have full information; actions are binary and there are only three strategies. In principle, the model is flexible and can be taken as a building block for more complex models, as has been indicated at the end of section 2.3.1. In a companion paper (Greiff, forthcoming), we extend the strategy space of the model and allow rewards to be given not only to cooperators but also to defectors. One possibility would be to explore more sophisticated learning rules for partner selection, such as experience-weighted attraction (Camerer and Ho, 1999) and belief-based learning models. Will the model be robust with respect to different learning rules? How will the resulting structure of the network look if other learning rules are used? Given the importance of social networks in the provision of public goods, we believe that the process of network formation should receive more attention.
References James Andreoni, William Harbaugh, and Lise Vesterlund. The carrot or the stick: Rewards, punishments and cooperation. American Economic Review, 93(3):893–902, 2003. Pat Barclay and Robb Willer. Partner choice creates competitive altruism in humans. Proceedings of the Royal Society B, 274(1610):749–753, 2007. Phillip Bonacich and Thomas M. Liggett. Asymptotics of a matrix valued markov chain arising in sociology. Stochastic Processes and their Applications, 104(1):155–171, 2003. Jordi Brandts, Arno Riedl, and Frans van Winden. Competitive rivalry, social disposition, and subjective well-being: An experiment. Journal of Public Economics, 93(11-12):1158–1167, 2009. Colin Camerer and Teck-Hua Ho. Experience-weighted attraction learning in normal-form games. Econometrica, 67(4):827–874, 1999. 78
Learning with whom to Interact: A Public Good Game on a Dynamic Network
Ananish Chaudhuri. Sustaining cooperation in laboratory public goods experiments: A selective survey of the literature. Experimental Economics, 14(1):47–83, 2011. Giorgio Coricelli, Dietmar Fehr, and Gerlinde Fellner. Partner selection in public goods experiments. Journal of Conflict Resolution, 48(3):356–378, 2004. David L. Dickinson. The carrot vs. the stick in work team motivation. Experimental Economics, 4(1):107–124, 2001. Ernst Fehr and Simon Gächter. Cooperation and punishment in public goods experiments. American Economic Review, 90(4):980–994, 2000. Simon Gächter and Benedikt Herrmann. Reciprocity, culture and human cooperation: previous insights and a new experiment. Philosophical Transactions of the Royal Society (B), 364(1518):791–806, 2009. Matthias Greiff. Social Approval as an Incentive – The Voluntary Provision of Public Goods in Social Production Communities. Verlag Peter Lang, Frankfurt am Main, 2011. Matthias Greiff. Affective social ties without the need to belong? Rationality, Markets and Morals, 4:20–27, 2013. Matthias Greiff. Rewards and the private provision of public goods on dynamic networks. Journal of Evolutionary Economics, forthcoming. Esther Hauk and Rosemarie Nagel. Choice of partners in multiple twoperson prisoner’s dilemma games: An experimental study. Journal of Conflict Resolution, 45(6):770–793, 2001. Benedikt Herrmann, Christian Thöni, and Simon Gächter. Antisocial punishment across societies. Science, 319(5868):1362–1367, 2008. Matthew O. Jackson. A survey of network formation models: Stability and efficiency. In Gabrielle Demange and Myrna Wooders, editors, Group Formation in Economics: Networks, Clubs, and Coalitions. Cambridge University Press, 2005. Michael Kosfeld. Economic networks in the laboratory: A survey. Review of Network Economics, 3:20–41, 2004. W. B. G. Liebrand. The effect of social motives, communication and group size on behavior in an n-person multi-stage mixed-motive game. European Journal of Social Psychology, 14:239–264, 1984. 79
MATTHIAS GREIFF
Marcel Mauss. The Gift - Forms and Functions of Exchange in Archaic Societies. Cohen and West, 1954. Avner Offer. Between the gift and the market: the economy of regard. Economic History Review, 50(3):450–476, 1997. Elinor Ostrom. Governing the Commons: The Evolution of Institutions for Collective Action. Cambridge University Press, 1990. Elinor Ostrom, James Walker, and Roy Gardner. Covenants with and without a sword: Self-governance is possible. American Political Science Review, 86(2):404–417, 1992. Talbot Page, Louis Putterman, and Bulent Unel. Voluntary association in public good experiments: Reciprocity, mimicry and efficiency. The Economic Journal, 115(506):1032–1053, 2005. Robin Pemantle and Brian Skyrms. Network formation by reinforcement learning: the long and medium run. Mathematical Social Sciences, 48(3): 315–327, 2004. David G. Rand, Anna Dreber, Tore Ellingsen, Drew Fudenberg, and Martin A. Nowak. Positive interactions promote public cooperation. Science, 325(5945):1272–1275, September 2009. Martin Sefton, Robert Shupp, and James Walker. The effect of rewards and sanctions in provision of public goods. Economic Inquiry, 45(4):671–690, 2007. Brian Skyrms. Evolution of the Social Contract. Cambridge University Press, 1996. Brian Skyrms and Robin Pemantle. A dynamic model of social network formation. Proceedings of the National Academy of Sciences, 97(16):9340–9346, 2000. Robert Slonim and Ellen Garbarino. Increases in trust and altruism from partner selection: Experimental evidence. Experimental Economics, 11(2): 134–153, 2008. Joep Sonnemans, Frans van Dijk, and Frans van Winden. On the dynamics of social ties structures in groups. Journal of Economic Psychology, 27(2): 187–204, 2006. 80
Learning with whom to Interact: A Public Good Game on a Dynamic Network
Kai Spiekermann. Sort out your neighborhood. Synthese, 168(2):273–294, 2008. Oded Stark and Doris A. Behrens. An evolutionary edge of knowing less (or: On the ’curse’ of global information). Journal of Evolutionary Economics, 20(1):77–94, 2010. Karolina Sylwester and Gilbert Roberts. Cooperators benefiot through reputation-based partner choice in economic games. Biology Letters, 6(5): 659–662, 2010. Peter D. Taylor and Leo B. Jonker. Evolutionary stable strategies and game dynamics. Mathematical Biosciences, 16(76-83):145–156, 1978. Frans van Dijk, Joep Sonnemans, and Frans van Winden. Social ties in a public good experiment. Journal of Public Economics, 85(2):275–299, 2002. Frans van Winden. Affective social ties – missing link in governance theory. Rationality, Markets and Morals, 3:108–122, 2012. Frans van Winden, Frans van Dijk, and Joep Sonnemans. Intrinsic motivation in a public good environment. In Charles R. Plott and Vernon L. Smith, editors, Handbook of Experimental Economics Results, volume 1 of Handbooks in Economics, chapter 89, pages 836–845. North-Holland, 2008.
81