a decision-support method to aid in the understanding of different architecture candidates ... comparison of different software architecture candidates for a spe-.
M. Svahnberg, C. Wohlin, L. Lundberg and M. Mattsson, "A Quality-Driven Decision Support Method for Identifying Software Architecture Candidates", International Journal of Software Engineering and Knowledge Management, Vol. 13, No. 5, pp. 547-573, 2003.
A Quality-Driven Decision-Support Method for Identifying Software Architecture Candidates Mikael Svahnberg, Claes Wohlin, Lars Lundberg, Michael Mattsson Department of Software Engineering and Computer Science Blekinge Institute of Technology, PO Box 520, S-372 25 Ronneby SWEDEN Phone: +46 457 385000
[Mikael.Svahnberg|Claes.Wohlin|Lars.Lundberg|Michael.Mattsson]@bth.se ABSTRACT To sustain the qualities of a software system during evolution, and to adapt the quality attributes as the requirements evolve, it is necessary to have a clear software architecture that is understood by all developers and to which all changes to the system adheres. This software architecture can be created beforehand, but must also be updated as the domain of the software, and hence the requirements on the software system evolve. Creating a software architecture for a system or part of a system so that the architecture fulfils the desired quality requirements is often hard. In this paper we propose a decision-support method to aid in the understanding of different architecture candidates for a software system. We propose a method that is adaptable with respect to both the set of potential architecture candidates and quality attributes relevant for the system’s domain to help in this task. The method creates a support framework, using a multi-criteria decision method, supporting comparison of different software architecture candidates for a specific software quality attribute and vice versa, and then uses this support framework to reach a consensus on the benefits and liabilities of the different software architecture candidates and to increase the confidence in the resulting architecture decision.
Categories and Subject Descriptors D2.2 [Design Tools and Principles] Decision Tables, D2.11 [Software Architectures] Patterns.
General Terms Design, Experimentation
Keywords Software Architectures, Quality Attributes, Analytic Hierarchy Process
1. INTRODUCTION In [20] Parnas describes the phenomenon of software aging. He ascribes this to two causes: (1) the domain changes around the software and (2) changes to the system are introduced in a careless manner, which degrades the system. Part of the solution to both of these problems may be found in having and maintaining a clear and updated software architecture for a software system. As is also described in [20], having an architecture that all changes must be related to will help to prevent the second form of decay. As the domain of the software evolves, so will the requirements on the software system, and hence the architecture needs to be re-evaluated so that it still reflects a modern system that fits the evolved domain. By doing this on a regular basis, we believe that the first form of aging can be, if not hindered, so at least relieved. Furthermore, an appropriate architecture is not only governed by functional requirements, but to a large extent by quality attributes [2][4][8]. However, knowing this, it is still a non-trivial task to cre-
Architecture Architecture Candidates Architecture Structure Structure
Architecture Candidate Decision Process
Quality Quality Req. Quality Req. Req.
Uncertainty Indicator
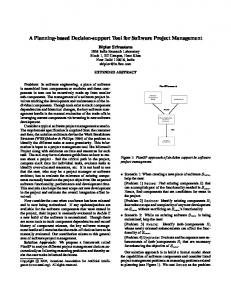
Figure 1. Illustration of Problem ate an appropriate architecture. There are usually more than one quality attribute involved in a system, and the knowledge of the benefits and drawbacks of different software architectures with respect to different quality attributes is not yet an exact science. Decisions are often taken on intuition, relying on the experience of senior software developers. Quality cannot be added to the system as an afterthought; it has to be built into the system from the beginning. Thus, the software architecture for any software system ought to be based on functional needs, domain specificities and quality requirements. Hence, support is needed. The focus in this paper is on presenting some key aspects for a method supporting the understanding of architecture candidates based on quality attributes. Such a method provides one important input to decision-makers when designing a suitable system architecture, together with other considerations. The method in this paper has the additional benefit that the identification of which architecture to use is based on the experience of a group of software engineers, and each participant’s opinions and reasons for why a particular architecture is heard before a decision is taken. This ensures not only a broader decision base, but also creates a learning effect, allowing the participants to learn from each others experiences. Moreover, it allows discussions to be held focusing on the areas where the participants’ experiences differ. The terms “software architecture” and “architecture structure” are used rather loosely to denote an architecture or an architecture proposal of a software system which can be on any level of granularity, such as a software product, a software module, software subsystem or software component. In this paper, we only focus on the software artefacts, although the proposed method may be applicable on a system level as well.
1.1 Description of Problem In this paper, we address the following problem: Given a set of requirements on quality attributes for a system and a set of architecture candidates, which architecture candidate is the most appropriate, i.e. fulfils the quality requirements on the system best? This problem is also illustrated in Figure 1.
If a structured way to understand the benefits and liabilities of different architecture candidates is found and used this may increase the confidence in the decisions taken, and hence the software systems developed are not forced into a mould which may not be entirely suitable for the problem at hand. Moreover, by re-evaluating the architecture decisions regularly, it is ensured that the architecture always reflect the current quality requirements, or we are able to strive in the right direction. As shown by Johansson et al. [11], different stakeholders tend to have different views of the importance of various quality requirements for a system, and the differing experiences of the software developers may also lead to a different interpretation of the strengths and weaknesses of different architectures. A structured method facilitates in this situation because it enables us to identify where stakeholders and developers have differing opinions.
1.2 Context of Method and Related Work The objective of the method proposed in this paper is to enable a quantified understanding of different architecture candidates for a software system. We assume, for the sake of this method, that a small set of architecture candidates is developed, after which the proposed method provides support for identifying and discussing which of the architecture candidates is best suited to meet the quality requirements of the software system. This architecture may either be the architecture that the system is designed according to, or an architecture to strive towards when evolving the system. As is indicated in e.g. [12], architectures degrade over time unless something is made to prevent this. One way may be to have a clear architecture to relate changes to. It is not our intention that the proposed method should be used as the only method when designing a software architecture. Rather, we suggest that the method is used in conjunction with other methods, possibly more qualitative in nature, or focusing on other aspects of the software development, such as the functional requirements. Examples of such methods are the design method proposed by Hofmeister et al. [8], the Rational Unified Process [10] and the QASAR design method [4]. The way we currently see it, these methods are used to create software architectures, which constitute candidate designs for a system, after which the method proposed in this paper is used to further understand and discern between the strengths and weaknesses of the different architecture candidates, and possibly comparing with the current architecture of the system. The context of the method is thus a specific situation within a particular company, where either the initial architecture of a system is designed, or the current architecture of a system is evaluated against newer architecture suggestions. The architecture candidates are identified within this context, and they are also evaluated within this context. Similarly, the quality attributes are only the ones that are relevant for the domain in question and for the business model of the company. Architecture evaluations can be separated into early architecture evaluations and late architecture evaluations [18], and different methods are more or less suitable for either of these two types. Late architecture evaluation is conducted during later stages of the software development process when there is a software system or at least a detailed design available on which more concrete metrics can be collected. Lindvall et al. 2003 [18] is an example of this. Early architecture evaluation, on the other hand, is concerned with deciding at an early stage during the software development process what qualities a software architecture have a potential for exhibiting.
Early architecture evaluations are commonly based on the experiences of the software developers and logical reasoning, as there are usually no tangible artifacts on which to e.g. perform simulations or collecting metrics. Oftentimes, this is aided by first specifying, categorising and prioritizing scenarios. These scenarios then enables the evaluators to focus on one issue at a time. Examples of evaluation methods focused on early evaluation and using scenarios are the Software Architecture Analysis Method (SAAM) [2] that is solely based on the use of scenarios, its successor the Architecture Tradeoff Analysis Method (ATAM) [7] that is more flexible in the possible evaluation techniques (ATAM can use e.g. mathematical models for evaluations of some quality attributes), and various methods focusing on specific quality attributes such as modifiability [3]. Another method focusing on scenarios is Global Analysis [8], although this is more a method for designing architectures than for evaluating them. However, evaluations is a constant and ongoing activity within Global Analysis. While these methods tend to be performed as a group activity, the method used in this paper allows each participant to first form his or her own opinion, and then the method facilitates in focusing discussions around those issues where the involved parties have different opinions. This means, of course, that issues that all participants agree on are not covered and that the outcome is an increased joint understanding of what needs to be done. Moreover, the methods above are focused on evaluating a single architecture to find out if and where there may be problems in it. The method in this paper is more aimed towards finding out which architecture candidate, of a set of architecture candidates, has the most potential to support the mix of quality attributes for a particular system to build. Accordingly, the method used in this paper does not produce any absolute measures on the architecture candidates. Rather, it produces judgements relative to the other architecture candidates on how good or bad the architecture candidates are with respect to a particular quality attribute, much in the same way as Morisio et al. 2002 [19] compares software artifacts with predefined ideal artifacts. A final difference is that the method in this paper is not based on scenarios as the aforementioned methods are (except for Morisio et al. [19]). This may, however, be a possible and interesting future extension.
1.3 Outline of Paper The remainder of this paper is organised as follows. In Section 2 we present the proposed method for understanding software architectures based on quality attributes. In Section 3 we present a case study where the proposed method is used. The method and potential extensions are discussed in Section 4. Finally, the paper is summarised in Section 5.
2. METHOD The objective of this paper is to propose a method for pinpointing a software architecture candidate that best fit the quality requirements on the software product in question. The method also allow focused discussions to create a joint understanding of the architecture candidates. The method is broken down into a number of concrete steps. 1. 2. 3.
Identify potential software architecture candidates and key quality attributes. Create method framework. Prioritize the quality attributes for the software system to be developed.
Top-level Decision Process
Individual FAS Individual FAS Individual FAS Architecture Architecture Ideas Architecture Structure Structure
Step 6 Hold Consensus Discussion
FAS Architecture Architecture Candidates Architecture Structure Structure Step 1 Identify Candidates
Quality Quality Quality Requirements Requirements Requirements
Individual FQA Individual FQA Individual FQA
Quality Quality Attributes Quality Attribute Attribute
FQA Step 2 Create Framework
Step 4 Suggest Architecture Candidate
Architecture Structure
Step 5 Determine Uncertainty
Uncertainty Indicator
Architecture Decision
FVC Step 3 Prioritize Quality Attributes PQA
Figure 2. Illustration of Solution 4.
Identify which software architecture candidate best fits the list of prioritized quality attributes. 5. Determine the uncertainty in the identification. 6. Discuss the individual frameworks, the synthesized prioritized list of quality attributes and the recommended software architecture candidate to reach a consensus. These steps are illustrated in Figure 2. As can be seen, the first step is performed before the actual analysis process begins, but we include it nevertheless as it is a vital part of any architecture design process to identify potential candidates. Moreover, the FAS, FQA, individual FAS and FQA, FVC and PQA referred to are outcomes of step 2 and 3, and are further discussed in Section 2.2 and Section 2.3. Each of the steps in Figure 2 corresponds to a subsection below, where the steps are described in further detail. During the remainder of this paper, we will use a number of acronyms to refer to different sets of data. These acronyms are presented in Table 1.
2.1 Step 1: Identify Candidates This step is fairly simple to describe, although not trivial in a development situation. The intention is that possible software architecture candidates are created, listed and described so that people understand the differences and similarities between them. Further, the key quality attributes for the system to be developed are identified, listed and described. It is outside the scope of this paper to describe how the architecture candidates are created, but as mentioned earlier, various design methods (e.g. [4][8][10]) can be used to create the architecture candidates and standard requirements engineering methods (e.g. [6][17]) can be used to obtain the quality attributes. The outcome of this step is two lists containing the relevant software architecture candidates and quality attributes respectively. As mentioned in Section 1.2, the actual candidates and attributes on the lists are dependent on the application domain and the situation in which the software is developed. We would again like to stress the fact that the architecture candidates used can be on any level of granularity on any level of the system (e.g. product, module, subsystem or component). Similarly, we do not put any constraints on the level of granularity for the quality attributes. However, in our experience it is beneficial if all quality attributes are on the same level of granularity, as this facilitates comparison between the quality attributes. Moreover it may
be easier if the specific quality attributes are grouped into categories to facilitate the prioritization process. The reason why this is easier is simply that the number of inputs to the creation of the framework decreases, which reduces the number of comparisons that need to be made. This step produces the inputs to the rest of the decision process in Figure 1, in that it generates a set of n architecture candidates and a set of k quality attributes.
Table 1. Acronyms used in paper Acronym
Description
FQA
Framework for Quality Attributes. A set of vectors where architecture structures are ranked according to their ability to meet particular quality attributes.
FAS
Framework for Architecture Structures. A set of vectors where the support for different quality attributes are ranked for each architecture structure.
Individual FQA
Contains the same as FQA, but from the perspective of only one individual. The individual FQA’s are combined into the FQA.
Individual FAS
Contains the same as FAS, but from the perspective of only one individual. The individual FAS’s are combined into the FAS.
FVC
Framework for Variance Calculation. A vector of variance indicators for a FQA vector set.
PQA
Prioritized list of Quality Attributes. A list of quality attributes prioritized for a system to design.
FQA’
An intermediate result during the process of generating the FQAr.
FQAr
A refined version of the FQA, where the values of FAS have been used to increase the accuracy.
Step two: Create Framework FQA’ FQA’ FQA’
Architecture Architecture Candidates Architecture Structure Structure Step 2.1 Obtain Individual Data Quality Quality Attributes Quality Attribute Attribute
Individual FAS Individual FAS Individual FAS
Step 2.2 Synthesize Data
Step 2.3 Refine Data
FQA
FQAr
FAS
FQAr Step 2.4 Calculate Variance
Individual FQA Individual FQA Individual FQA
FVC
Figure 3. Illustration of step two of solution Architecture Architecture Candidates Architecture Structure Structure Step 2 Create Framework
FQAr
Step 4 Suggest Architecture Candidate
Quality Quality Attributes Quality Attribute Attribute
Figure 4. Refinements to Process
2.2 Step 2: Create Framework In step two of the method the method framework, consisting of two tables, is created and refined. In this section we describe further how this is done. In Section 2.2.1 we discuss how the data is obtained that is used to create the framework. In Section 2.2.2 we describe how the data obtained from each individual is combined into two tables with a set of vectors in each (we call these vector sets Framework for Quality Attributes (FQA) and Framework for Architecture Structures (FAS), respectively). In Section 2.2.3 we discuss how these two tables are related to each other and how the FAS can be used to improve the accuracy of FQA. As a result from this step a refined vector set (called the FQAr) is generated. A final outcome of correlating FQA and FAS is that we get an indication of the variance in the data (represented in the vector FVC). How this is obtained is presented in Section 2.2.4. These sub-steps within step two, and the different vector sets created during the process are illustrated in Figure 3. In this figure we see that a number of intermediate results are produced (such as the FAS and the individual FAS and FQA), and these are later used in step 6, where the framework is discussed. Putting what is done in step two into the context of the rest of the method, there is a minor change to the solution outlined in Figure 2, as illustrated in Figure 4 (for clarity, we have left out processes and data sets not involved in the refined view).
2.2.1 Obtaining Individual Data for Framework The basic idea of our method is that it is possible to understand how good certain software architecture candidates are for different quality attributes. This implies that we can determine two things: • A comparison of different software architecture candidates for a specific software quality attribute. • A comparison of different quality attributes for a specific software architecture candidate. To succeed in this a method for ranking software architecture candidates and quality attributes respectively is needed. Such methods
are available from the management science literature, for example in Anderson et al. 2000 [1]. The methods are often denoted multicriteria decision processes. One such method is the Analytic Hierarchy Process (described in further detail below), which was originally proposed by Saaty 1980 [21]. Applying a method such as the Analytic Hierarchy Process in our context means that two sets of vectors may be created. The first set of vectors is connected to prioritizing the software architecture candidates with respect to a certain quality attribute. This means that it is possible to determine the order in which different software architecture candidates are believed to support a specific quality attribute. Moreover, it is possible to get a relative weight using the Analytic Hierarchy Process. The latter means that it is possible to determine how much better a specific candidate is with respect to a quality attribute. The outcome of such a comparison is discussed in Section 3. In this step of our proposed method, we use the AHP method to create vectors signifying the relative support for different quality attributes within architecture candidates (FAS) and the relative ranking of how well different architecture candidates support different quality attributes (FQA). Each participant in the architecture design decision creates an individual set of data (corresponding to step 2.1 in Figure 3.), i.e. an individual FAS and an individual FQA. These are then synthesized into a combined view, as described in Section 2.2.2. Analytic Hierarchy Process. AHP has previously been described, evaluated and successfully used in similar settings and in other areas of software engineering (e.g. [13][14][23]). Briefly, AHP consists of a set of steps, where all combinations of elements are evaluated pair-wise, and according to a certain scale, as illustrated in Figure 5. The question to answer for each pair-wise comparison is which of the two elements, i or j is more important, and how much more important it is. This is rated by interpreting the values as presented in Table 2. These comparisons are then transferred into a n × n matrix, where n is the number of elements, together with the reciprocal values. After this is done, the eigenvector of the matrix is computed. [21][22] proposes a method called averaging over normalised columns to do this. This results in an estimation of the eigenvalues of the matrix, and is called the priority vector. The priority vector is the primary output of applying AHP. i
j 9
7
5
3
1
3
5
7
Figure 5. The scale for the AHP comparison.
9
Next, the fact that AHP uses more comparisons than necessary (i.e. n × ( n – 1 ) ⁄ 2 comparisons) is used to evaluate the consistency of the rating. A consistency ratio (CR) is calculated, which indicates the amount of contradictions and inconsistencies between the pair-wise comparisons. A consistency ratio of 0.10 or less is, according to [21][22], considered acceptable even if it is pointed out that higher values are often obtained. Hence 0.10 may be too hard, but it nevertheless indicates an approximate size of the consistency ratios to expect. A more extensive description of AHP can be found in e.g. [13][21][22] and [25].
The individual FAS and FQA created in the previous section are then synthesized into a combined view of all of the participants. We have found that the easiest way to do this is by taking the median values of all of the participants. Examples of the FQA and the FAS - be they individual or synthesized can be found in Table 3 and Table 4, respectively. In Table 3, we see four different architecture candidates, numbered from one to four, and four different quality attributes, equally numbered from one to four. For each of the quality attributes, the architecture candidates relative support for the quality attribute in question is shown. The values, denoted FQAi,j in this example, are normalised so that each row sums up to 1.
Table 2: Scale for pairwise comparison using AHP [21][22]. Definition
AC 1
AC 2
AC 3
AC 4
Sum
QA 1
FQA1,1
FQA1,2
FQA1,3
FQA1,4
1
QA 2
FQA2,1
FQA2,2
FQA2,3
FQA2,4
1
QA 3
FQA3,1
FQA3,2
FQA3,3
FQA3,4
1
QA 4
FQA4,1
FQA4,2
FQA4,3
FQA4,4
1
Table 4. Example FAS - Column normalised vector set
2.2.2 Synthesize Data
Relative intensity
Table 3. Example FQA - Row normalised vector set
Explanation
1
Of equal importance
The two variables (i and j) are of equal importance.
3
Slightly more important
One variable is slightly more important than the other.
5
Highly more important
One variable is highly more important than the other.
7
Very highly more important
One variable is very highly more important than the other.
9
Extremely more important
One variable is extremely more important than the other.
2, 4, 6, 8
Intermediate values Used when compromising between the other numbers.
Reciprocal
If variable i has one of the above numbers assigned to it when compared with variable j, then j has the value 1/number assigned to it when compared with i. More formally if nij = x then nji = 1/x.
AC 2
AC 1
AC 3
AC 4
QA 1
FAS1,1
FAS1,2
FAS1,3
FAS1,4
QA 2
FAS2,1
FAS2,2
FAS2,3
FAS2,4
QA 3
FAS3,1
FAS3,2
FAS3,3
FAS3,4
QA 4
FAS4,1
FAS4,2
FAS4,3
FAS4,4
Sum
1
1
1
1
Table 5. FQA vector set
Table 6. FAS vector set
AC 1
AC 1
AC 2
AC 2
QA 1 0.6
0.4
QA 1
0.5
0.6
QA 2 0.3
0.7
QA 2
0.5
0.4
The second set of vectors is obtained in the same way, but here the different quality attributes are prioritized for a specific software architecture candidate. This means that the relative support for a quality attribute of a candidate can be determined. This set of vectors are shown in Table 4 with values FASi,j in the cells. It should be noted that, for example, both FQA1,1 and FAS1,1 are measures of support for QA 1 by SA 1, although from different perspectives. This fact is used as part of the method to determine the uncertainty in the identification of an appropriate software architecture candidate. This is further elaborated in Section 2.2.3 and Section 2.2.4. These two sets of vectors provide a framework for working with the software architectures with respect to software quality attributes. Presently, the main usage of the combined framework is to indicate a suitable software architecture candidate for a system to design.
2.2.3 Adjusting the FQA The fact that we are able to do both row-wise comparisons (FQA) and column-wise comparisons (FAS) opens up some possibilities to increase the quality of our estimations and at the same time determining the uncertainty in our predictions. The nature of these new possibilities can be understood by considering the following very small example. Consider a situation with two architecture candidates, i.e., n = 2, and two quality attributes, i.e. k = 2, and assume that we have obtained the FQA and FAS in Table 5 and Table 6. Let s1,1 denote the support provided by Architecture 1 for QA 1 and s2,1 denote the support provided by Architecture 1 for QA 2. Furthermore, let s1,2 denote the support provided by Architecture 2 for QA 1 and s2,2 denote the support provided by Architecture 2
Table 7. FQA’ based on row one
Table 8. FQA’ based on row two
AC 1
AC 1
AC 2
Table 9. Normalised FQA’ based on row one
AC 2
Table 10. Normalised FQA’ based on row two
AC 1 AC 2 Sum
AC 1
AC 2
Sum
QA 1
0.6
0.4
QA 1
0.3
1.05
QA 1
0.6
0.4
1
QA 1
0.22
0.78
1
QA 2
0.6
0.27
QA 2
0.3
0.7
QA 2
0.69
0.31
1
QA 2
0.3
0.7
1
for QA 2. From column one in the FAS we see that s1,1 = s2,1. Furthermore from the FQA we get the relations: s1,1 =3s1,2/2 and s2,1 = 3s2,2/7. From these three equations we get: 7s1,2 = 2s2,2. This is, however, inconsistent with the relation obtained by looking at column two in the FAS, i.e., the relation obtained by this column is s1,2 = 3s2,2/2. Consequently, the two vector sets are incompatible, which of course is possible (and also highly likely) since the values in the vector sets are obtained from (expert) opinions and experiences. The fact that the information in the FQA and FAS is incompatible can be used in (at least) two ways: first we can use the information in the FAS for adjusting the values in the FQA, which is our main concern; second, we can calculate a variance value (or some other uncertainty indicator) based on the degree of inconsistency between the two vector sets. In this section we discuss some simple techniques for doing this. The calculation in this section is based on the assumption that the values in the FQA and FAS are of equal quality. Using the AHP method, this can be ascertained as AHP generates a consistency index rating how consistent the answers are with each other. The basic strategy is then to calculate k FQA’-vector sets, such that each FQA’ is compatible with the FAS and one row in the FQA. Having obtained these k vector sets, we adjust the FQA by simply taking the average of these k FQA’-vector sets and k copies of the FQA thus obtaining the FQAr which we can then use for identifying an appropriate architecture candidate (see Section 2.4). The FQA’ vector sets stem from the FAS and by taking the average between the k FQA’-vector sets and k copies of the FQA, the FQA and FAS will contribute equally to the FQAr. From the discussion above we see that based on the FAS and row one in the FQA it is possible to calculate another row (i) in the new FQA’-vector set in the following way: FQA 1, j FAS i, j FQA' i j = -------------------------------------- . , FAS 1, j In order not to complicate the presentation we assume that all involved values are larger than zero. Similarly, based on the FAS and row two in the FQA it is possible to calculate another row (i) in the new FQA’-vector set in the folFQA 2, j FAS i, j lowing way: FQA' = -------------------------------------- . i, j FAS 2, j If we consider the small 2x2-vector sets in Table 5 and Table 6, we get the two FQA’ vector sets in Table 7 and Table 8. We see that the row sums in the two FQA’ vector sets are no longer normalised to one. It is not obvious how one should handle this, but we suggest that we add an additional step where the sum of each row is normalised to one, so that the values in the FQA’ tables are of the same magnitude as the already normalised FQA table. The normalised FQA’ vector sets will thus be as presented in Table 9 and Table 10.
Table 11. FQAr AC 1
AC 2
Sum
QA 1
0.5
0.5
1
QA 2
0.4
0.6
1
Table 12. FVC AC 1
AC 2
QA 1
0.036
0.036
QA 2
0.038
0.038
By taking the average of these two vector sets and two copies of the FQA we get the FQAr in Table 11 which was our goal.
2.2.4 Variance Calculation Since each value in the FQAr is the average of 2k values (k times the value in the FQA and the value in the k normalised FQA’-vector sets) we can calculate the variance in the ordinary way. We will thus obtain a variance vector set - the FVC-vector set. For the small example above we would get the FVC in Table 12. This variance measurement is used in later stages to determine by what level of certainty the framework can be used as a support when deciding what architecture to use.
2.3 Step 3: Prioritize Quality Attributes The next step of the method is to conduct a prioritization of the quality attributes for the software system in question. Different methods may be applied for prioritization [14]. This includes subjective judgement with or without consensus building and methods such as providing a total sum of points to be divided between the items or aspects you would like to prioritize. Most methods have however weaknesses and it is mostly hard to judge the goodness of the prioritization. The Analytic Hierarchy Process (AHP) addresses some of these problems [21], since it allows for a calculation of a consistency index for the prioritization. This opportunity arises from the fact that AHP is based on all pair-wise comparisons of whatever we would like to prioritize. In our example (Table 3 and Table 4), we need to perform six comparisons for the quality attributes, since we have four quality attributes. The outcome of the prioritization process is one vector per participant with relative weights on the importance of the different quality attributes for the software system in question. The median value of these individual vectors are then used to create a single vector, called PQA. An example of a PQA can be seen in Table 13, where the different priorities are denoted PQAi. There is a price to pay when using a method such as AHP: the number of comparisons grows fairly quickly. On the other hand, it is not likely that we have a huge number of architecture candidates or quality attributes to prioritize (either for the framework or for
Table 13. Prioritized quality attributes for system to develop. Attribute
Table 16. PQA-vector Attribute
Priority
Priority
QA 1
0.4
QA 1
PQA1
QA 2
0.3
QA 2
PQA2
QA 3
0.2
QA 3
PQA3
QA 4
0.1
QA 4
PQA4
Sum
1
Table 14. Example FAS
Table 15. Example FQA
AC 1
AC 1
AC 2
AC 2
QA 1
0.4
0.25
QA 1
0.5
0.5
QA 2
0.3
0.25
QA 2
0.38
0.62
QA 3
0.2
0.25
QA 3
0.25
0.75
QA 4
0.1
0.25
QA 4
0.12
0.88
the prioritization of quality attributes of the software system to develop). The number of architecture candidates is limited by the amount of time and effort it takes to develop them, so in a practical setting there will most likely not be more than a few architecture candidates developed. The number of quality attributes may be larger, but this number can be reduced by grouping the quality attributes into categories, each representing some aspect of the system’s requirements. The number of quality attributes can also be reduced by selecting a smaller set of quality attributes to focus on. In our experience, for most software systems there is a small set of easily identified quality attributes that are more relevant to consider, and these are the ones that should be used for the framework and the PQA. Further, it should be noted that each comparison is conducted very quickly. This is based on experience from conducting this type of studies in another area [14]. We have also conducted a related study [25], in which we used five architectures and six quality attributes. This resulted in 135 questions being asked to each participant to create the framework (the FAS and FQA), which took the participants approximately one hour of concentrated work to complete. (The first result came in after 45 minutes and the last came in after 70 minutes.) The outcome of this step is a vector with the different quality attributes prioritized, and with a relative weight of their importance. This vector is used in the next step, where the data is used to determine the most appropriate software architecture candidate for the given situation.
2.4 Step 4: Suggest Architecture Candidate As discussed above, we can obtain two kinds of vector sets: the FQA and the FAS (plus the derived FQAr). Based on these vector sets and the PQA-vector we are going to identify an appropriate architecture candidate. It may at first glance be tempting to try to correlate the PQA-vector with the columns in the FAS, and select the architecture candidate which has the most similar profile. Consider for example the following small example with a FAS in Table 14 and a PQA-vector in Table 16. Without going into details about how we define the correlation, it is clear that the profile of Architecture 1 is closer to the PQA-vec-
tor than the profile of Architecture 2. The obvious conclusion would thus be to select Architecture 1 in this case. However, assume that the FAS corresponds to the FQA shown in Table 15. From the FQA we see that Architectures 1 and 2 are equally good for QA 1, and that Architecture 2 is better for all other quality attributes, i.e., we should in fact select Architecture 2. The example above is somewhat naive since Architecture 2 is consistently better than Architecture 1. However, the example illustrates that a good correlation between a column in the FAS and the PQA-vector is not a good criterion for identifying an architecture candidate. Instead we suggest that the FQA or the derived FQAr should be used for pinpointing a suitable architecture. We therefore suggest a very direct method which is: Suggest architecture candidate i such that k is as large as possible. PQA j FQAr j, i j=1
∑
2.5 Step 5: Determine Uncertainty In order to obtain the uncertainty in our suggestion we can calculate the variance for each architecture i given the PQA-vector and the FVC. From the rules of variance propagation we know that the variance for architecture candidate i is obtained in the following k 2 way PQA j FVC j, i . j=1
∑
We are thus able to determine the uncertainty in our suggestion. If there is high uncertainty, this may indicate that the architecture candidates and quality attributes are not so well understood, and that further investigations are necessary before the final architecture decision is taken.
2.6 Step 6: Consensus Discussion In this step, which is elaborated further on in [24], we use the individual FQA and FAS, the PQA and the suggested software architecture as a foundation for a discussion about the different architecture alternatives, the quality attributes and their relation. The basic idea is that by studying the differences among the individual FQA’s and FAS’s we are able to, with relatively easy measures, pinpoint where the participants are in disagreement. The areas where there are disagreements are then used to kindle discussions, to find out why there is a difference. Reasons can be e.g. that the participants represent different development units, have contact with different customers, have different experiences or have different interpretations of the architecture candidates or quality attributes. Some of these reasons are also described in [11]. If participants disagree on the meaning of a certain quality attribute, or of a certain architecture candidate, this is a disagreement that would manifest itself later during the development process and, in a worst case, be the source of flaws in the delivered product. By instead venting the different opinions at an early stage, some of these problems may be avoided.
Preparations for the consensus discussion meeting is done by studying the individual FAS and FQA and identify for each datapoint in these if and where there are participants that disagree with the rest of the participants. This can manifest itself in several ways, e.g.: • A few participants diverge from the general consensus. • A few participants form a small group that diverge from the general consensus. • A few participants diverge in the same direction from the general consensus, but are not so much in consensus with each other that they can be said to form a group. • The participants form two or more distinct groups. During the preparations, the task is to identify issues for discussion where any of the above has occurred. This can e.g. be done by calculating the sum of the squared distance to the mean value over all participants and then selecting those data-points where this sum is above a certain threshold value, or the discussion issues can be identified by visually inspecting graphs where the values of all individuals are plotted or one can use a combination of these two techniques. The identified issues are then discussed during the consensus discussion meeting, allowing both those participants that diverge from the general consensus as well as the participants representing the general consensus to voice their opinions and give a rationale to their respective viewpoints. The most tangible output from the consensus discussion meeting is a list of issues where the discussions have shown that it is necessary to conduct further investigations, or issues that must be taken care of in a particular way for the project to succeed. Among the less tangible outputs is the increased confidence that all are striving in the same direction and that the architecture decision is the correct decision, and the knowledge that participants will have gained from each others experiences and opinions.
2.7 Summary In Section 2.1 architecture candidates are created and quality attributes are identified, upon which the FQA, FAS and the FQAr vector sets created in Section 2.2 are based. These are then used to suggest an architecture candidate in Section 2.4. Parallel to this, a variance vector set, FVC, is created in Section 2.2, which is used in Section 2.5 to generate indications of the uncertainty in the identification of the architecture candidate. The outcome is thus an architecture candidate, how much better suited this candidate is to the problem than its competitors, and how certain we are of the results. All of the above is then used in the last step, described in Section 2.6, where differences between the participants opinions, and their opinions of the suggested architecture candidate is discussed. This creates a better joint understanding and an increased confidence in that the right decision is ultimately taken.
3. A CASE STUDY USING THE METHOD In order to illustrate the method described in this paper, we present a summary of an experiment conducted using the method. This is done to give a more comprehensive presentation of how the method can be used. The investigation is conducted in an industry setting, with experienced practitioners of software engineering. Specifically, we conduct the study together with Danaher Motion Särö AB1, a Swedish
1. http://www.danahermotion.se
company that develops software for automatic guided vehicles (AGVs) which are, for example, used to automatically haul goods on factory floors. Within this setting we are studying a particular situation where a redesign of the existing system allows the company to question the previous architectures (logical as well as physical architectures), in order to possibly obtain an architecture that better suit the quality requirements. We focus on a single software system from the product line of systems developed by the company, of which most are necessary to get an AGV system operational. Below, we describe how each step of the method is applied in the study.
3.1 Step 1: Identify Candidates Below, we describe the software architecture candidates that the company has developed, and the identified quality attributes. Architectures. Three architecture candidates were developed for the subsystem in focus of our study. For reasons of confidentiality we are unable to give the full picture of the architecture candidates, but the architecture candidates describe three variations of how to physically distribute the logic among a set of hardware components. Specifically, the architectures involve: • A one-CPU solution, where the entire system in question is gathered on a single CPU board. We refer to this as Architecture A. • A two-CPU solution, where parts of the system have been placed on a separate CPU and communication is done over a generic communications bus. We refer to this as Architecture B. • A centralised solution, where the first CPU has been replaced with execution cycles in a central computer, shared over all vehicles. We refer to this as Architecture C. These architectures were developed by a person from the company, and described in diagrams and text together with a description of the functional scope of the system, also described with diagrams and text. The description of each architecture consists of two pages: one with a UML diagram and one with an explanatory text. Quality Attributes. After the architectures were developed, five quality attributes relevant for this system were identified and described. We waited with this until the architectures were developed to be sure that the quality attributes were indeed relevant. The quality attributes identified and the descriptions of them that was distributed to the participants are: • Cost. This quality attribute involves aspects such as development cost, maintenance costs and production cost, but also indirectly time-to-market. Furthermore, the ability to understand the system and the ability to allocate resources with the right competence is also indirectly included in this attribute. • Functional Flexibility. With this we mean the ability to configure and deliver with different subsets of functionality, but also the ability to add new functionality and remove or replace old functionality. To deliver with different subsets of functionality mainly means adding different sets of functionality on top of a common core, but it may also mean that the components (both hardware and software) of the common core may need to be extended or replaced to accommodate parts of the desired functionality. • Performance Flexibility. This quality attribute concerns the ability to configure different soft- and hardware solutions that supports different maximum speeds. This may have impact on the hardware (e.g. faster CPUs), but may also influence the rate at which software components must communicate, or
Table 19. FQAr from NDC
Table 17: FAS from NDC Arch. A Arch. B Arch. C Cost
0.248
0.120
0.315
Functional Flexibility
0.270
0.286
0.253
Performance Flexibility
0.205
0.286
0.162
Security Flexibility
0.099
0.135
0.097
Testability
0.177
0.173
0.173
Arch. C
Arc. A Arch. B Cost
0,190
0,365
Functional Flexibility
0,177
0,477
0,347
Performance Flexibility
0,164
0,649
0,187
Security Flexibility
0,217
0,582
0,201
Testability
0,205
0,421
0,374
Table 18: FQA from NDC
0,445
Table 20. FVC from NDC
Arch. A Arch. B Arch. C
Arch. A
Arch. B
Arch. C
Cost
0,0070
0,0093
0,0091
0.155
Functional Flexibility
0,0029
0,0090
0,0106
0.589
0.144
Performance Flexibility
0,0022
0,0078
0,0058
0.345
0.443
Security Flexibility
0,0049
0,0066
0,0095
Testability
0,0028
0,0132
0,0121
Cost
0.143
0.429
0.429
Functional Flexibility
0.160
0.431
0.408
Performance Flexibility
0.155
0.689
Security Flexibility
0.267
Testability
0.212
even the algorithm by which the software controls the vehicle. • Security Flexibility. With this we mean the ability to configure and deliver solutions with varying degrees of security and safety. This can, for example, be done by adding redundant hardware and software, which means that the architecture must support redundant components, both in the software and in the hardware. • Testability. Testability involves the ability to test and debug the parts of the system individually and/or as a group, the ability to extract test data from the system and the ability to add data measurement points when needed, but also the ease by which these things can be done. The objective is to identify the best possible candidate using the proposed method, which recommend a candidate based on quality attributes.
Table 21: PQA from NDC Quality Attribute Cost
0.246
Functional Flexibility
0.324
Performance Flexibility
0.145
Security Flexibility
0.104
Testability
0.181
Table 22: Match of Architectures and Priorities of Quality Attributes
3.2 Step 2: Create Framework Using AHP [21][22] the 13 participants each complete a questionnaire to create an individual FAS, FQA. These are then synthesized into a unified FAS and FQA by taking the median values of all of the individual dittos. These are presented in Table 17 and Table 18
respectively.
Although the values are created using subjective assessments of the qualities of software architecture candidates, it is our belief that the subjective judgements of a set of professional software developers is an accurate representation of the actual qualities that said architecture candidates have a potential for exhibiting. Using these two tables and the process described in Section 2.2.3, the FQAr is created as presented in Table 19. This is the table that is used in later stages. Furthermore, a variance vector set FVC is created according to Section 2.2.4, presented in Table 20.
3.3 Step 3: Prioritize Quality Attributes Next, the participants prioritize the quality attributes for the product to build. The resulting vectors are synthesized into the PQAvector introduced in Section 2.3. The PQA is presented in
Priority
Value
Variance
Architecture A
0.187
0.000919
Architecture B
0.475
0.00218
Architecture C
0.338
0.00229
Table 21. This vector is created using the same multi-criteria decision process as was used to create the FQA and FAS.
3.4 Step 4: Suggest Architecture Candidate Using the formula in Section 2.4, a value for each architecture candidate is obtained as presented in Table 22. The architecture candidate named Architecture B has the highest value, and is hence identified as the architecture candidate upon which to base the product. That Architecture B “wins” is not surprising as it is consistently, with one exception, better than all of the other architectures, as can be seen in the FQAr (Table 19).
3.5 Step 5: Determine Uncertainty The variance is calculated according to Section 2.5 (the values are presented in Table 22), and is found to be rather low, which
increase the confidence in that the architecture candidates and quality attributes are reasonably well understood.
3.6 Step 6: Consensus Discussion During the consensus discussion, the individual views for each of the architectures and quality attributes were presented, and a total of 20 issues for discussions where there was a large spread among the answers was discussed. Some of these issues triggered a deeper discussion, whereas others rendered a simple comment and nothing more. All of the participants in the study also participated during the consensus discussion meeting. Moreover, all persons actively took part in the discussions. The discussions were such that they allowed the younger participants to learn from the older and, to some extent, vice versa. The discussion of some issues led to very specific questions directed to the software and hardware developers among the participants. Several issues were also noted where it was decided to conduct further investigations. Half of the 20 issues for discussions had been identified using a simple formula measuring the spread among the answers. These issues rendered more discussions than the remaining that had been identified by examining graphs of all participants’ answers. The reason for this is simple: for the first 10 issues (identified through the formula) there was a significant spread among the answers, requiring longer discussions before a consensus could be reached. For the remaining 10 issues there was usually only one or two persons that had an opinion that differed from the majority, often rendering a mere comment from the participants with a different opinion. One surprise was that Architecture C scored so well compared to the others. This led to some discussions on the merits of this architecture candidate and the possibilities of combining parts of this candidate with Architecture B. An interview conducted with the participants after this consensus discussion meeting gave that their confidence in that the correct decision is taken increased as a consequence of the meeting. The general view was that the method helped focusing the discussions onto the areas where most needed, which made for an efficient use of the meeting time.
3.7 Summary The case study presented above is a abbreviated version of a study conducted using the method in this paper (described in further detail in [26]). This experiment is conducted together with an industry partner, and in the context of a design decision they are facing within this company. The data presented above is thus real, live data. The cost of applying the method is relatively low: completing the questionnaires to create the individual frameworks took, in the case above, about one hour per participant and the consensus discussion took another three hours, totalling four hours per participant. The participants were pleased with the method. Even if it would have been even more useful with more concrete architecture candidates and quality attributes, it was still considered useful as the amount of uncertainty reflects the confusion generally present at early stages of a project. 75% were willing to try the method again in a later stage of the project, when the architecture candidates were clearer and the quality requirements more well defined.
4. DISCUSSION AND EXTENSIONS A key element of the method in this paper is the framework, as the method depends on whether it is at all possible to create this frame-
work. We have conducted an experiment where a framework for a particular set of software architectures and a particular set of quality attributes is used [25]. In this experiment we use five of the architecture patterns in Buschmann et al. 1996 [5] and the quality attributes in ISO 9126 [9], together with the AHP method [21]. Other ways to use the created framework include using it to study similarities and differences between different candidates, identify strengths and weaknesses of different candidates, to apply the framework in the context of assessment and evaluation of candidates, and to use the framework in software evolution. We also intend to continue studying the consensus building aspects of the method. Specifically, the way the method helps focusing discussions to those issues where the participants have disagreements, and the way this allows for knowledge transfer. We would like to study whether this can be useful to train new software developers in assessing different architecture candidates.
5. SUMMARY AND CONCLUSIONS In this paper we present a method to increase the understanding of the benefits and liabilities of different software architectures with respect to quality attributes. Moreover, the method can be used to indicate which of the architecture candidates that best suits the quality requirements of a given software system. This can then be used to hold focused discussions on areas where there are disagreements to increase the confidence that the correct decision is taken. The method takes as input a set of quality requirements for a software system, and a set of architecture candidates. During the process two sets of vectors, containing (a) a comparison of different architecture candidates with respect to different quality attributes, and (b) a comparison of different quality attributes with respect to different architecture candidates, are created and further refined. The use of the method produces a list of values for the different candidate architecture candidates, of which the one obtaining the highest value indicates the most suitable for the system to construct. The sets of vectors and the recommended architecture is used as input to a consensus discussion, during which issues where the participants disagree with each other are discussed to further understand the reasons for this disagreement. The purpose of this discussion meeting is to further increase the understanding of the architecture candidates and quality attributes, identify where further studies are necessary and to allow the software developers to learn from each other. The method, and our use of AHP to obtain the initial values, is a way to systematically quantify the experience of the developers, as it is the subjective judgements of the developers that are asked for in step 2 (create method framework) and 3 (prioritize quality attributes) of the method. Two of the major benefits of the method is that it forces developers to systematically consider all possible combinations and that it clearly indicates where the developers are disagreeing. These disagreements will lead to focused discussions and, eventually, a better understanding of the problem and hopefully an agreement among the developers. To summarise, the proposed method enables software designers to take into account relevant quality attributes for a system and evaluate these against all software architecture candidates for the system. The architecture candidate recommended by the method is the one that, according to the developers, best meet the quality attribute requirements for the system. This can then either be used to actually create the software system accordingly, or by directing evolution work to aspire towards the nominated architecture, in order to work against software aging.
References [1] D.R. Anderson, D.J. Sweeney, T.A. Williams, “An Introduction to Management Science: Quantitative Approaches to Decision Making”, South Western College Publishing, Cincinnati Ohio, 2000. [2] L. Bass, P. Clements, R. Kazman, “Software Architecture in Practice”, Addison-Wesley Publishing Co., Reading MA, 1998. [3] PO Bengtsson, “Architecture-Level Modifiability Analysis”, Ph.D. Thesis, Blekinge Institute of Technology, Dissertation Series No 2002-2, 2002. [4] J. Bosch, “Design & Use of Software Architectures - Adopting and Evolving a Product Line Approach“, Addison-Wesley, Harlow UK, 2000. [5] Buschmann, F., Jäkel, C., Meunier, R., Rohnert, H., Stahl, M., “Pattern-Oriented Software Architecture - A System of Patterns“, John Wiley & Sons, Chichester UK, 1996. [6] L. Chung, B.A. Nixon, E. Yu, J. Mylopoluos, “Non-Functional Requirements in Software Engineering”, Kluwer Academic Publishers, Dordrecht, the Netherlands, 2000. [7] P. Clements, R. Kazman, M. Klein, “Evaluating Software Architectures - Methods and Case Studies”, Addison-Wesley, Boston MA, 2002. [8] C. Hofmeister, R. Nord, D. Soni, “Applied Software Architecture”, Addison-Wesley, Reading MA., 2000. [9] “Software Qualities”, ISO/IEC FDIS 9126-1:2000(E). [10] I. Jacobson, G. Booch, J. Rumbaugh, “The Unified Software Development Process”, Addison-Wesley, Reading MA, 1999. [11] E. Johansson, M. Höst, A. Wesslén, L. Bratthall, “The Importance of Quality Requirements in Software Platform Development - A Survey”, in Proceedings of HICSS-34, Maui Hawaii, January 2001. [12] E. Johansson, M. Höst, “Tracking Degradation in Software Product Lines through Measurement of Design Rule Violations”, to appear in Proceedings of the 14th International Conference on Software Engineering and Knowledge Engineering (SEKE), Italy, July 2002. [13] J. Karlsson and K. Ryan, “A Cost-Value Approach for Prioritizing Requirements”, in IEEE Software 14 (5):67–74, 1997. [14] J. Karlsson, C. Wohlin and B. Regnell, “An Evaluation of Methods for Prioritizing Software Requirements”, in Information and Software Technology, 39(14-15):938-947, 1998. [15] R. Kazman, M. Barbacci, M. Klein, S. J. Carrihe, S.G. Woods, “Experiences with performing Architecture Tradeoff Analysis”, in Proceedings of ICSE’99, Los Angeles CA., pp. 54-63, May 1999. [16] R. Kazman, J. Asundi, M. Klein, “Quantifying the Costs and Benefits of Architectural Decisions”, Proceedings of the 23rd International Conference on Software Engineering (ICSE 23), Toronto, Canada, pp. 297-306, May 2001. [17] G. Kotonya, I. Sommerville, “Requirements Engineering”, John Wiley & Sons, Chichester UK, 1998. [18] M. Lindvall, R.T. Tvedt, P. Costa, “An Empirically-Based Process for Software Architecture Evaluation”, in Empirical Software Engineering, 8(1):83-108, 2003. [19] M. Morisio, I. Stamelos, A. Tsoukiàs, “A New Method to Evaluate Software Artifacts Against Predefined Profiles”, in Proceedings of the 14th International Conference on Software Engineering and Knowledge Engineering (SEKE 2002), ACM Press, New York NY, pp. 811-818, 2002.
[20] D.L. Parnas, “Software Aging”, in Proceedings of the 16th International Conference on Software Engineering, IEEE Computer Society Press, Los Alamitos CA, pp. 279-287, 1994. [21] T. L. Saaty, “The Analytic Hierarchy Process”, McGraw Hill, Inc., New York NY, 1980. [22] T.L. Saaty, L.G. Vargas, “Models, Methods, Concepts & Applications of the Analytic Hierarchy Process”, Kluwer Academic Publishers, Dordrecht, the Netherlands, 2001. [23] M. Shepperd, S. Barker, M. Aylett, “The Analytic Hierarchy Process and almost Dataless Prediction”, in Project Control for Software Quality - Proceedings of ESCOM-SCOPE 99, R.J. Kusters, A. Cowderoy, F.J. Heemstra, E.P.W.M. van Weenendaal (eds), Shaker Publishing BV, Maastricht the Netherlands, 1999. [24] M. Svahnberg, C. Wohlin, “Consensus Building when Comparing Software Architectures”, in Proceedings of the 4th International Conference on Product Focused Software Process Improvement (PROFES 2002), Lecture Notes in Computer Science (LNCS 2559), Springer Verlag, Berlin Germany,, 2002. [25] M. Svahnberg, C. Wohlin, “Evaluation of Software Quality Aspects for Architectural Structures using the Analythical Hierarchy Process”, submitted (can be obtained from the authors), 2003. [26] M. Svahnberg, “An Industrial Study on Building Consensus around Software Architectures and Quality Attributes”, submitted (can be obtained from the authors), 2003.