Are there Non-Linearities between SME Growth and their Determinants? A Quantile Approach Zélia Serrasqueiro1 Management and Economics Department, Beira Interior University Estrada do Sineiro, Pólo IV, 6200209 Covilhã, Portugal and CEFAGE Research Center, Évora University. Phone: + 351 275 319 600 Fax: + 351 275 319 601 E-mail:
[email protected]
Paulo Maçãs Nunes Management and Economics Department, Beira Interior University Estrada do Sineiro, Pólo IV, 6200209 Covilhã, Portugal and CEFAGE Research Center, Évora University. Phone: + 351 275 319 600 Fax: + 351 275 319 601 E-mail:
[email protected]
João Leitão Instituto Superior Técnico, Technical University of Lisbon Department of Engineering and Management, Av. Professor Doutor Aníbal Cavaco Silva, 2744-016 Porto Salvo, Portugal and NEGE Research Centre, Minho University. Phone: + 351.214.233.585 Fax: + 351.214.226.901 E-mail:
[email protected]
Manuel José da Rocha Armada Management and Economics School, Minho University and NEGE Research Centre, Minho University, Campus de Gualtar , 4710 - 057 Braga , Portugal Phone: + 351 253604550 Fax: + 351 253601380 E-mail:
[email protected]
1
Corresponding author: Zélia Serrasqueiro
1
Abstract The current paper aims to analyse the relationships between growth of Portuguese SME and their determinants, using quantile regressions. The results allow us to reject Gibrat´s Law only for the upper quantiles of growth distribution. The negative relationship expected between growth and age is only found in the upper quantiles of growth distribution. We also find a positive effect of the level of intangible assets and internal and external finance on Portuguese SME growth, for upper levels of growth distribution. The results allow us to conclude that there are significant non-linearities between SME growth and their determinants.
Keywords: Gibrat´s Law; Quantile Regressions; SME Growth.
EFM classification codes: 140 - Capital Structure; 800 - Small Business
2
Are there Non-Linearities between SME Growth and their Determinants? A Quantile Approach
1. Introduction
The conclusion by Gibrat (1931) that company growth is not a continuous process, not depending on previous size, became known in the literature as the Law of Proportionate Effect (LPE) or Gibrat’s Law. According to Gibrat (1931), small companies and large companies have the same probability of reaching a determined rate of growth. Sutton (1997) concludes that a company’s rate of growth diminishes, systematically, with increased size, as a consequence of the fact that companies aim to reach the optimal scale of production that allows them to survive. The conclusions by Sutton (1997), show that validation of Gibrat´s Law can depend on company size, with a greater possibility of validation in the context of small companies that have not yet reached an optimal scale of production. According to Jovanovic (1982), company growth diminishes with age, since companies, with the aim of reaching a minimum efficient scale, tend to have a high growth rate at the beginning of their life cycle. Following the study by Jovanovic (1982), various empirical studies, mainly in the context of SMEs (Mata, 1994; Becchetti and Trovato, 2002; Yasuda, 2005; Honjo and Harada, 2006; Calvo, 2006; Oliveira and Fortunato, 2006; Moreno and Casillas, 2007), test the relationship between growth and age, besides the relationship between growth and size. The empirical results of the studies indicate that (Small and Medium-Sized Enterprises) SME growth tends to diminish with increased size, rejecting Gibrat´s Law. In addition, greater age of SMEs also means diminished growth.
3
Recently, especially in the context of SMEs, empirical approaches to Gibrat’s Law, besides company size and age, consider other factors that may determine company growth. Deloof (2003) and Rogers (2004) conclude that the intangible assets, which are indicative of growth opportunities, can be considered as a fundamental aspect for the survival and sustainable growth of SMEs. Empirical evidence about the effect of intangible assets on SME growth are scarce, an exception being the studies by Yasuda (2005) and Calvo (2006), which point towards a positive relationship between growth and intangible assets. However, the insufficiency of internal finance conjointly with the lack of external finance influence negatively companies’ investment decisions, and consequently their growth dynamics (Harris and Raviv, 1991; Lang et al., 1996; Carpenter and Petersen, 2002). In recent years, there have been approaches to Gibrat’s Law, considering the effect of internal finance (Heshmati, 2001; Audretsch and Elston, 2002; Carpenter and Petersen, 2002; Cabral and Mata, 2003; Honjo and Harada, 2006; Oliveira and Fortunato, 2006; Moreno and Casillas, 2007) and also of external finance (Heshmati, 2001; Becchetti and Trovato, 2002; Honjo and Harada, 2006) on the dynamics of SME growth. There is a gap in the literature in that until now empirical studies of growth determinants, with SMEs as the subject of analysis1, have focused on identification of the central tendency of growth distribution, and have not considered the possibility of testing SME growth determinants throughout growth distribution. This paper has the following objectives: (i) to check for possible significant non-linearities between growth and their determinants throughout the growth distribution of Portuguese SMEs; and (ii)
4
to identify the determinant factors that restrict and catalyse Portuguese SME growth throughout growth distribution. Concerning to the methodology, we use quantile regressions, which allow us to determine the relationships between SME growth and the possible determinant factors, for different levels of growth. Afterwards we use the Chow test for the following purposes: (i) to test Gibrat´s Law throughout the growth distribution of Portuguese SMEs; and (ii) to identify possible significant non-linearities between Portuguese SME growth and their determinants, throughout growth distribution. Therefore, as well as the classic test of Gibrat’s Law, which consists of testing the relationship between company growth in the current period and size in the previous period, the study also tests the relationships between: (i) SME growth in the current period and age in the previous period; (ii) SME growth in the current period and intangible assets (as a measure of growth opportunities) in the previous period; and (iii) SME growth in the current period and cash flow (as a measure of internal finance) and debt (as a measure of external finance), in the previous period. We use the second form of test proposed by Mansfield (1962), considering for this purpose the companies in the sample that remained in the market in the period under study. Based on this criterion, the selected research sample is made up of 370 Portuguese SMEs for the period between 1999 and 2005. This paper presents two contributions for the literature on entrepreneurship and SME management. Firstly, on basis of the use of quantile regressions, we conclude that there are significant non-linearities between SME growth and their determinants throughout the growth distribution of SMEs. Secondly, as a consequence of the existence of non-linearities between SME growth and their determinants, it was possible
5
to identify the restrictive factors and the catalysers SME growth throughout the growth distribution. After this introduction, the paper has the following structure. The second section presents a literature review concerning possible determinant factors of SME growth. The third section presents the research methodology, namely the database, variables and estimation method. The fourth section presents the results, according to the possible determinant factors of SME growth. The fifth section discusses the results. Finally, we present conclusions and implications for managers and policy-makers, as well as guidelines for future research.
2. Growth Determinants
The following items present a review of the literature about determinant factors of growth considered in the literature: (i) size; (ii) age; (iii) intangible assets; and (iv) financing sources.
2.1. Size
According to Barkham et al. (1996) small companies and large companies have quite different motivations for growth, namely: (i) small companies grow because of the need to reach a minimum efficient scale that allows survival; and (ii) large companies can grow according to possible strategic alterations, as a consequence of changes taking place in the markets. The conclusions of Barkham et al. (1996) are reinforced by Audretsch et al. (2004), the authors pointing towards motivation for small company growth having to do with
6
the need to find a minimum efficient scale that permits survival. In this way, obtaining economies of scale is the main motivation behind the growth of companies that are smaller than they would be if they have already achieved the minimum efficient scale. According to Audretsch et al. (2004) small companies can present high growth potential, since they frequently operate at a sub-optimal production scale, which assumes partial use of internal capacity as well as partial exploration of the market in which they operate. In the empirical evidence dealing only with SMEs, namely for Portugal (Mata, 1994; Oliveira and Fortunato, 2006), Sweden (Heshmati, 2001), Italy (Becchetti and Trovato, 2002; Lotti et al., 2003), Spain (Calvo, 2006; Moreno and Casillas, 2007) and Japan (Yasuda, 2005; Honjo and Harada, 2006), the great majority of results do not validate Gibrat’s Law, in that negative and statistically significant relationships were detected between growth and size.
2.2. Age
In the early years of the life cycle, a company grows towards attaining an optimal level of efficiency. At later stages of its life cycle, and after reaching a minimum efficient scale that allows it to survive the rate of growth diminishes. Jovanovic (1982) claims that company managers need time to identify the opportunity costs associated with the alternative investment opportunities. In this context the results of Fariñas and Moreno (1997) are particularly relevant, concerning the relationship between growth and age, highlighting the fact that the youngest companies register higher growth rates in the first years of their life cycle.
7
After ensuring survival, companies show lower growth rates, which increases the possibility of company growth not being related to age. Lumpkin (1998) and Shane and Venkataraman (2000), conclude that young companies, usually more proactive and better informed about the level of risk associated with investment opportunities, present a better rate of effectiveness as regards taking advantage of new profitable business than older companies. This being so, according to Lumpkin (1998), and Shane and Venkataraman (2000), a negative relationship is expected between growth and age, given the greater ability to grow revealed by younger companies. The great majority of empirical evidence, in the context of SMEs, points to a negative and statistically significant relationship between growth and age, namely, in the case of Portugal (Mata, 1994; Oliveira and Fortunato, 2006), Italy (Becchetti and Trovato, 2002), Spain (Calvo, 2006; Moreno and Casillas, 2007) and Japan (Yasuda, 2005; Honjo and Harada, 2006). Lotti et al. (2003), in the case of Italian SMEs, reveal that company age is a fundamental characteristic for investigating the validity of Gibrat’s Law. The authors conclude that at the beginning of a company’s life cycle, Gibrat’s Law cannot be considered valid, in that negative relationships are detected between growth and size, as well as between growth and age. However, in later stages of the life cycle of companies that survive, the authors tend to consider Gibrat’s Law as valid, since the growth of Italian SMEs is seen to be independent of size and age. However the results of Heshmati (2001), for Sweden, deserve special attention, inasmuch as the author concludes that the nature of the relationship between growth and age depends on the estimation method used, and it is not possible to state definitively that there is a negative relationship between growth and age.
8
2.3. Intangible Assets
Cressy and Olofsson (1996) conclude that strategies followed by companies are affected by the type of assets they have available. Small companies usually show a lower level of tangible assets than large companies. According to the authors, the difference in the type of assets may be fundamental for distinguishing between the growth strategies of large companies and SMEs. Companies that own greater intangible assets have a higher propensity to develop innovative activities, this higher propensity to innovate meaning improved economic performance in companies (Griliches and Lichtenberg, 1984; Pusher, 1995; Smith et al., 2004; Audia and Greve, 2006; Chen et al., 2006). In the study by Hall (1987), expenditure on Research and Development (R&D), understood as a component of intangible assets, takes on fundamental importance for company growth in the US. Greater level of expenditure on R&D contributes to diversification of production activities and range of products, allowing companies to attain a higher level of growth. Nevertheless, Yasuda (2005) warns that we may find a non-positive relationship between growth and R&D expenditure, above all for companies that are at the initial stage of their life cycle. This relationship is due, on the one hand, to the fact that R&D expenditure is usually associated with implementation of strategies that include a higher level of risk. On the other hand, the non-positive relationship between growth and R&D expenditure can be justified by the fact that companies need some time to find an optimal combination between strategies of innovation and the level of risk that brings higher levels of SME growth.
9
In the context of SMEs, the conclusions by Rogers (2004) have special relevance. The author concludes that SMEs that own more intangible assets, present also a bigger flexibility for taking advantage from growth opportunities in the form of innovating strategies, which can contribute to significant increases in company growth. Yasuda (2005), for Japanese SMEs, detects a positive and statistically significant relationship between growth and R&D expenditure. Calvo (2006), for Spanish SMEs, concludes that innovating activity, in the form of product innovation and production process innovation, increases the possibility for survival and subsequent company growth.
2.4. Financing Sources
The results obtained by Cooley and Quadrini (2001), and Cabral and Mata (2003), show that the growth of new small companies is hindered by restrictions concerning finance and by the shortage of resources of diverse nature. The strategies of SMEs for finance are fundamental in explaining their growth, and this can be seriously hindered when companies are subject to considerable financial restrictions (Reid, 2003). Companies bear different costs of internal finance2 and external finance3, due to the imperfections of the capital market (Stiglitz and Weiss, 1981). If the capital market was perfect, then all companies would have access to alternative sources of finance, and in this way internal finance and external finance would be considered perfect substitutes. As a consequence, companies’ financing decisions would be irrelevant for carrying out their strategies for investment and growth (Stiglitz and Weiss, 1981). In the context of the imperfections of the capital market, the results obtained by Fazzari et al. (1988) are particularly relevant: SMEs face more restrictions in the access
10
to external finance and are therefore much more dependent on internal finance, in order to finance their investment, and consequently their growth. Empirical evidence reveals the importance of internal finance for SME growth, pointing towards a positive relationship between growth and internal finance, in different economies, namely Germany (Audretsch and Elston, 2002), United States (Carpenter and Petersen, 2002), Portugal (Cabral and Mata, 2003; Oliveira and Fortunato, 2006) and Spain (Moreno and Casillas, 2007). However, the analysis developed by Heshmati (2001), concerning Sweden, did not detect a statistically significant effect of internal finance on growth. In turn, the study by Honjo and Harada (2006), applied to the situation in Japan, underlines the importance of internal finance for the growth of younger companies, although there was no statistically significant relationship detected between the growth of older companies and level of internal finance. Meyer (1998) concludes that in cases of insufficient internal finance, access to external finance can be fundamental to encourage company investment and consequently growth. However, insufficiency of internal finance can be a problem, given the greater difficulties faced by SMEs in accessing external finance (Becchetti and Trovato, 2002). Concerning external finance, debt can influence company growth (Lang et al., 1996). In large companies, debt is fundamental to discipline managers’ behaviour, so that they do not invest in projects that make the company grow beyond the optimal level, which would negatively influence the value of the company (Meyer, 1998). However, the ownership and management of SMEs are usually concentrated in the same individuals, which contributes decisively to minimizing conflicts between company
11
owners and managers (Pettit and Singer, 1985; Crutchley and Hansen, 1989; Ang, 1992; Jensen et al., 1992; Cowling, 2003). Baker and Nelson (2005) and George (2005) conclude that small companies that show a high level of debt tend to use their resources efficiently, due to the need to make periodic payment of debt charges. Greater strategic flexibility combined with the possibility of taking advantage of growth opportunities can contribute to debt being a fundamental aspect for SME growth, whenever the possibilities of internal finance are exhausted and considering that a considerable number of SMEs are excluded from the stock market. Nevertheless, empirical evidence does not point to a positive effect of debt on SME growth. Heshmati (2001), for Sweden, obtains inconclusive results, emphasising the variability of the results, according to the estimation method used and measure of size used. Becchetti and Trovato (2002), for Italy, reveal a negative relationship between growth and debt, statistically significant when considering together surviving and nonsurviving companies. However, the referred relationship is not statistically significant when only considering surviving companies. Honjo and Harada (2006), for Japan, obtain a negative and statistically significant relationship between growth and debt when measuring size through the variables: number of employees and total assets. Nevertheless, the authors detect a positive and statistically significant relationship between growth and debt when considering sales volume of companies as the measurement of size.
3. Methodology
12
3.1. Database
This study uses the SABI (System Analysis of Iberian Balance Sheets) database supplied by Bureau van Dijk´s, for the period from 1999 to 2005. We select SMEs based on the recommendation of the European Union L124/36 (2003/361/CE). According to this recommendation, a company is considered SME when it verifies two of the following criteria: (i) fewer than 250 employees; (ii) annual balance sheet total no exceeding 43 million Euros; and (iii) annual turnover not exceeding 50 million Euros. To answer the central question of the paper: are there non-linearities between SME growth and their determinant factors?; we choose the Portuguese reality, since it is considered as a suitable laboratory with business activity carried out in Portugal covering 99.6% of SMEs, which employ 75.6% of the workforce and account for 56.4% of the total sales of Portuguese industry (IAPMEI, 2008). In this context, we selected SMEs that fulfilled the three criteria mentioned above and that had intangible assets on their balance sheet for the period under study. Based on these criteria, 370 companies were selected, with information available for the period between 1999 and 2005, making a total of 2220 observations. All companies in the sample are closed held companies4.
3.2. Variables
3.2.1. Dependent variable
13
To measure the dependent variable growth we use the growth rate of total assets in the current period (Hall, 1987; Heshmati, 2001; Becchetti and Trovato, 2002; Honjo and Harada, 2006).
3.2.2. Independent variables
The independent variables are: size, given by the logarithm of total assets in the previous period (Hall, 1987; Heshmati, 2001; Becchetti and Trovato, 2002; Honjo and Harada, 2006); we used as a proxy for company age, the logarithm of the number of years the company had been in existence in the previous period (Mata, 1994; Becchetti and Trovato, 2002; Yasuda, 2005; Honjo and Harada, 2006; Calvo, 2006; Oliveira and Fortunato, 2006; Moreno and Casillas, 2007). In accordance with recent empirical research, we also consider as possible growth determinants of Portuguese SMEs: 1) the intangible assets5 (Michaelas et al., 1999; Sogorb-Mira, 20056), measured by the ratio of intangible assets to total assets in the previous period; 2) as a proxy of internal finance we use cash flow, given by the ratio between earnings after taxes plus depreciations and total Assets in previous period (Carpenter and Petersen, 2002; Cabral and Mata, 2003; Honjo and Harada, 2006; Oliveira and Fortunato, 2006); and 3) as a proxy of external finance we use level of debt (total debt7) given by the ratio of total liabilities to the book value of total assets in the previous period (Heshmati, 2001; Becchetti and Trovato; 2002; Honjo and Harada, 2006). Table 1 presents the variables used in this study and their corresponding measures. Table 1: Measurement of Variables Variables Dependent Growth ( GROWTH i ,t )
Measurement Difference between logarithm of Total Assets in current period and logarithm of Total Assets in previous period
14
Independent Size ( SIZE i ,t −1 ) Age ( AGE i ,t −1 ) Intangible ( INTANGi ,t −1 ) Internal Finance ( CFi ,t −1 ) External Finance ( LEVi ,t −1 )
Logarithm of Total Assets in Previous Period Logarithm of the Number of Years of Company Existence in Previous Period Ratio between Intangible Assets and Total Assets in Previous Period Ratio between earnings after taxes plus depreciations and Total Assets in Previous Period Ratio between Total Liabilities and book value of Total Assets in Previous Period
15
3.3. Estimation Method
The classic test of Gibrat´s Law consists of testing the relationship between growth in the current period and size in the previous period. The relationship to test can be presented as follows:
SIZEi ,t − SIZE i ,t −1 = β 0 + ( β1 − 1) SIZEi ,t −1 + d t + ei ,t ,
(1)
in which: SIZEi ,t is the size of company i, in the current period; SIZEi ,t −1 is the size of company i, in the previous period; d t represents annual dummy variables measuring the impact of possible macroeconomic changes on growth; and ei ,t is the error term. Company growth is equal to: GROWTH i ,t = SIZE i ,t − SIZE i ,t −1 .
(2)
Substituting (2) in (1), gives: GROWTH i ,t = β 0 + ( β1 − 1) SIZE i ,t −1 + d t + ei ,t .
(3)
The null hypothesis to be tested is H 0 : β1 − 1 = 0 , against the alternative hypothesis H 1 : β1 − 1 ≠ 0 . By not rejecting the null hypothesis, then β1 ≈ 1 that validates Gibrat´s
Law, growth in the current period being independent of size in the previous period. On the contrary, if β1 − 1 ≠ 0 , we reject Gibrat´s Law, since size in the previous period is
related to growth in the current period. When β1 > 1 , there is an explosive growth tendency, given that growth increases as size also increases. The most common situation in cases of rejecting Gibrat´s Law is to find β1 < 1 , that is, growth diminishes as company size increases. 16
As mentioned before, starting with the study by Jovanovic (1982), company age has been considered fundamental in explaining their growth. This being so, at a second stage we add age as an explanatory variable of Portuguese SME growth. In this way, we have: GROWTH i ,t = β 0 + ( β 1 − 1) SIZE i ,t −1 + β 2 AGEi ,t −1 + d t + ei ,t ,
(4)
where: AGEi ,t −1 is the age of company i, in the previous period.
Finally considering all determinants previously named in this study, we have: GROWTH i ,t = β 0 + ( β 1 − 1) SIZE i ,t −1 + β 2 AGEi ,t −1 + β 3 INTANGi ,t −1 + β 4 CFi ,t −1 +
+ β 5 LEVi ,t −1 + d t + ei ,t
(5)
with: INTANG i ,t −1 represents the intangible assets in the previous period; CFi ,t −1 is the cash flow (measure of internal finance), in the previous period; and LEVi ,t −1 is the debt (measure of external finance), in the previous period. Firstly, this paper aims to check for non-linearities in the relationship between SME growth and their determinant factors, and secondly, identify the determinant factors that restrict or catalyse growth of SMEs throughout growth distribution. For this purpose, the methodology deemed to be most appropriate is based on using the quantile conditional regression estimator developed by Koenker and Hallock (2001). Considering that the θ th quantile of the conditional distribution of the dependent variable ( Yi ,t ) is a linear function of the representative vector of the independent variables ( X i ,t ), the quantile conditional regressions can be presented as follows: Yi ,t = β 0 + β θ 1 `X i ,t + zθi ,t ,
(6)
and, Qθ (Yi ,t / X i ,t ) ≡ inf{Yi ,t : Fi ,t (Yi ,t / X i ,t ) ≥ θ } = β 0 + β θ 1 `X i ,t ,
(7)
17
with the following restriction: Qθ ( zθi ,t / X i ,t ) = 0 ,
(8)
where: Yi ,t = GROWTH i ,t ; X i ,t = SIZEi ,t −1 , considering the classic test of Gibrat´s Law;
X i ,t = SIZE i ,t −1 ; AGEi ,t −1 , adding age to the classic test of Gibrat´s Law; and X i ,t = SIZE i ,t −1 ; AGE i ,t −1 ; INTANG i ,t −1 ; CFi ,t −1 ; LEVi ,t −1 , considering all determinants of
growth previously considered in this study, i represents the company ( i = 1,...,370 ), t is the time period ( t = 1,...,6 ), Qθ ( zθi ,t / X i ,t ) is the θ th conditional quantile of Yi ,t , being conditional in relation to vector X i ,t referring to the independent variables, β θ 1 corresponds to the vector of estimated parameters for the different values of θ in [0,1], zθi ,t is the error and Fi ,t (. / X i ,t ) represents the conditional function of distribution.
This study tests Gibrat’s Law for the following quantiles of the growth distribution of Portuguese SMEs: θ = 5th ,10th ,25th ,50th ,75th ,90th ,95th . Estimating quantile conditional regressions for the different values of θ , we have distribution of the variable Yi ,t , conditional to the corresponding values of X i ,t for values of i ( i = 1,...,370 ), and t ( t = 1,...,6 ). In order to guarantee robustness of the results, concerning estimated parameters for the different quantiles, we use the bootstrap matrix method proposed by Buchinsky (1995, 1998). Based on Monte Carlo simulations, Buchinsky (1995) concludes that the bootstrap matrix method is the most advisable for databases with a rather low number
of observations, being considered a valid method in the presence of the most varied forms of heterogeneity.
18
With the aim of testing Gibrat´s Law throughout the growth distribution of Portuguese SMEs, we use the Chow test. By not rejecting the null hypothesis, H 0 : β1 − 1 = 0 , that is, β1 ≈ 1 , Gibrat´s Law is accepted. Otherwise, Gibrat´s Law8 is
rejected. To test for possible non-linearity throughout growth distribution we also use the Chow test, so as to test for possible differences in the estimated parameters for the different quantiles of growth distribution. We also present graphs for each of the variables regarding the evolution of estimated parameters for the different quantiles9.
4. Results
4.1. Descriptive Statistics and Correlation Matrix
Below, Table 2 presents the descriptive statistics of the variables used in this study.
Table 2: Descriptive Statistics GROWTH i ,t SIZE i ,t AGEi ,t INTANGi ,t MIN 5qt 10qt 25qt 50qt 75qt 90qt 95qt MAX MEAN SD N
CFi ,t
LEVi ,t
-1.15534
5.16478
0.00000
0.00004
-0.24526
0.04789
-0.20932
7.20681
1.79175
0.00024
-0.02838
0.32662
-0.15098
7.54978
2.19722
0.00044
-0.00879
0.40551
-0.07165
8.28055
2.56494
0.00141
0.02636
0.54522
0.00888
8.88445
3.09104
0.00540
0.04563
0.66476
0.11398
9.44661
3.43398
0.01752
0.08737
0.75280
0.24805
9.88659
3.89182
0.05885
0.12837
0.82912
0.34583
10.1036
4.06899
0.11082
0.17626
0.87422
1.09188
10.7391
4.64439
0.78488
1.46363
0.98978
0.03017
8.80693
3.00656
0.02428
0.06277
0.63833
0.18682
0.89589
0.68389
0.06360
0.08939
0.16857
2220
2220
2220
2220
2220
2220
The descriptive statistics reveal that Portuguese SME growth is negative up to the 25th quantile, becoming positive from the 50th quantile of growth distribution. This
19
aspect is particularly relevant for analysing the results obtained towards the use of quantile regressions, so as to be able to check for significant differences in the results of the test of Gibrat’s Law, between quantiles referring to negative growth rates and quantiles that also include positive growth rates in SMEs. The reduced amount of intangible assets in Portuguese SMEs is of note, their mean value being around 0.024. This means that a reduced amount of intangible assets can limit strategies of growth and diversification of Portuguese SMEs. Table 3 presents results of the correlation matrix.
GROWTH i ,t
Table 3: Correlation Matrix SIZE i ,t −1 AGE i ,t −1 INTANG i ,t −1
CFi ,t −1
GROWTH i ,t
1
SIZEi ,t −1
-0.1337***
1
AGE i ,t −1
-0.1226***
0.1820***
1
INTANGi ,t −1
0.0208
-0.0372
-0.0833***
1
CFi ,t −1
0.1907***
-0.0643***
-0.0787***
-0.0123
1
LEVi ,t −1
0.0046
-0.0564**
-0.2722***
0.0196
-0.2566***
LEVi ,t −1
1
Notes: 1. *** significant at 1%; ** significant at 5%; * significant a 10%.
On the one hand, the finding of negative and statistically significant correlations between growth and size, and between growth and age must be stressed. On the other hand, a positive and statistically significant correlation between growth and cash flow is detected. The correlations between growth and intangible assets, and between growth and debt, although positive, are not significant in statistical terms. Aivazian et al. (2005) conclude that when correlation coefficients between independent variables are over 30%, the problem of collinearity begins to be particularly relevant. Results of the correlation matrix show that in no circumstances are correlation coefficients between independent variables above 30%. This being so, we
20
can conclude that the problem of collinearity between independent variables will not be particularly relevant in this study.
4.2. Quantile Regressions
Next we present the results of the quantile regressions, considering: (i) the classic test of Gibrat´s Law; (ii) the classic test of Gibrat´s Law, adding age; and (iii) all the possible determinant factors of growth considered in this study. The following Tables present the results.
Table 4: Gibrat´s Law – Classic Test Dependent variable: GROWTH i ,t Independent variables:
OLS
5qt
10qt
25qt
50qt
75qt
90qt
95qt
SIZEi ,t −1
-0.0251*** (0.0046) 0.3404*** (0.0458) 0.1433
-0.0084 (0.0076) -0.0267 (0.0689) 0.0428
-0.0087 (0.0069) -0.0016 (0.0710) 0.0455
-0.0031 (0.0037) 0.0336 (0.0369) 0.0678
-0.0095 (0.0091) 0.1627*** (0.0499) 0.0712
-0.0373*** (0.0067) 0.5339*** (0.0623) 0.0983
-0.0543*** (0.0149) 0.8161*** (0.1174) 0.1293
-0.0685*** (0.0105) 1.0407*** (0.1957) 0.1498
1850
1850
1850
1850
1850
1850
1850
1850
CONST R 2 / PseudoR 2 N
Notes: 1. *** significant at 1%; ** significant at 5%; * significant at 10%. 2. Year – dummies are included, but not shown. 3. Bootstrapped Standard Errors (1000 reps) are shown in parentheses.
Table 5: Gibrat´s Law – Classic Test and Age Dependent variable: GROWTH i ,t Independent variables:
OLS
5qt
10qt
25qt
50qt
75qt
90qt
95qt
SIZE i ,t −1
-0.0220*** (0.0047) -0.0223*** (0.0061) 0.3769*** (0.0428) 0.1698
-0.0081 (0.0075) 0.0039 (0.0133) -0.0262 (0.0921) 0.0428
-0.0087 (0.0075) -0.0017 (0.0080) 0.0024 (0.0638) 0.0456
-0.0028 (0.0084) -0.0013 (0.0048) 0.0343 (0.0325) 0.0678
-0.0071 (0.0084) -0.0129** (0.0060) 0.2228*** (0.0401) 0.0798
-0.0320*** (0.0080) -0.0281*** (0.0103) 0.5662*** (0.0791) 0.1101
-0.0507*** (0.0107) -0.0432*** (0.0155) 0.9050*** (0.1543) 0.1465
-0.0677*** (0.0132) -0.0370*** (0.0039) 1.1320*** (0.0959) 0.1766
1850
1850
1850
1850
1850
1850
1850
1850
AGEi ,t −1 CONST R 2 / PseudoR 2 N
Notes: 1. *** significant at 1%; ** significant at 5%; * significant at 10%. 2. Year – dummies are included, but not shown. 3. Bootstrapped Standard Errors (1000 reps) are shown in parentheses.
21
Table 6: Gibrat´s Law – All Variables Dependent variable: GROWTH i ,t Independent variables:
OLS
5qt
10qt
25qt
50qt
75qt
90qt
95qt
SIZE i ,t −1
-0.0204*** (0.0046) -0.0189*** (0.0068) 0.0361 (0.0867) 0.4609*** (0.0674) 0.0206 (0.0284) 0.3119*** (0.0543) 0.2098
-0.0080 (0.0094) -0.0083 (0.0146) -0.0893 (0.0146) 0.0728*** (0.0135) -0.1156*** (0.0336) 0.0456 (0.1073) 0.0628
-0.0086 (0.0084) -0.0049 (0.0095) -0.0264 (0.1034) 0.1204*** (0.0143) -0.1041*** (0.0209) 0.0950 (0.0742) 0.0653
-0.0062 (0.0042) -0.0026 (0.0058) -0.0165 (0.0675) 0.3217*** (0.0657) -0.0197*** (0.0030) 0.0661 (0.0439) 0.0976
-0.0072 (0.0050) -0.0148** (0.0063) -0.0419 (0.0728) 0.5031*** (0.0689) 0.0247*** (0.0030) 0.1617*** (0.0518) 0.1031
-0.0237*** (0.0060) -0.0287*** (0.0064) -0.0363 (0.1185) 0.6819*** (0.0793) 0.1010*** (0.0210) 0.3491*** (0.0768) 0.1456
-0.0541*** (0.0123) -0.0420*** (0.0083) 0.2047*** (0.0663) 0.5722*** (0.1233) 0.1170*** (0.0367) 0.7796*** (0.1595) 0.1812
-0.0651*** (0.0113) -0.0394*** (0.0041) 0.4719*** (0.1180) 0.2954*** (0.0555) -0.0513 (0.0946) 1.1688*** (0.0132) 0.2187
1850
1850
1850
1850
1850
1850
1850
1850
AGEi ,t −1 INTANG i ,t −1
CFi ,t −1 LEVi ,t −1 CONST R 2 / PseudoR 2 N
Notes: 1. *** significant at 1%; ** significant at 5%; * significant at 10%. 2. Year – dummies are included, but not shown. 3. Bootstrapped Standard Errors (1000 reps) are shown in parentheses.
For the relationships between growth and size in Portuguese SMEs, in the various quantiles of growth distribution, we find that the results are almost identical, concerning magnitude of estimated parameters and their statistical significance, whether adding the other possible determinant factors to the model or not. When considering all the variables used in this study (Table 6), results of the relationships between growth and age in Portuguese SMEs, for the various quantiles of growth distribution, are almost identical to those obtained when adding age to the classic test of Gibrat´s Law (Table 5).
4.2.1. Test of Gibrat´s Law
Going on to make a comparative analysis of the obtained results, Table 7 presents the results of the tests of Gibrat´s Law by making use of the Chow test, for the different quantiles of growth distribution in Portuguese SMEs, as well as the results obtained with an OLS regression, for comparative purposes.
22
Table 7: Chow Test to Gibrat´s Law H 0 : β1 − 1 = 0
OLS and Quantile Regressions OLS
F (1,1843) = 1.23 5qt
F (1,1843) = 1.23 10qt
F (1,1843) = 1.23 25qt
F (1,1843) = 1.23 50qt
F (1,1843) = 1.23 75qt
F (1,1843) = 1.23 90qt
F (1,1843) = 1.23 95qt
F (1,1843) = 1.23
Classic Test 28.83*** (0.000)
β1 = 0.9749
(R)
1.23 (0.267) β1 ≈ 1 (A) 1.58 (0.208) β1 ≈ 1 (A) 0.68 (0.409) β1 ≈ 1 (A) 1.19 (0.282) β1 ≈ 1 (A) 30.73*** (0.000) β1 = 0.9627 (R) 33.05*** (0.000) β1 = 0.9457 (R) 42.50*** (0.000) β1 = 0.9315 (R)
Classic Test and Age 21.63*** (0.000) β1 = 0.9780 (R) 1.14 (0.284) β1 ≈ 1 (A) 1.36 (0.244) β1 ≈ 1 (A) 0.70 (0.401) β1 ≈ 1 (A) 0.76 (0.384) β1 ≈ 1 (A) 15.97*** (0.000) β1 = 0.9680 (R) 22.18*** (0.000) β1 = 0.9493 (R) 25.99*** (0.000) β1 = 0.9323 (R)
All Variables 19.19*** (0.000) β1 = 0.9796 (R) 0.73 (0.392) β1 ≈ 1 (A) 1.05 (0.305) β1 ≈ 1 (A) 2.14 (0.143) β1 ≈ 1 (A) 2.02 (0.155) β1 ≈ 1 (A) 15.59*** (0.000) β1 = 0.9763 (R) 19.22*** (0.000) β1 = 0.9459 (R) 32.70*** (0.000) β1 = 0.9349 (R)
Notes: 1. *** significant at 1%; ** significant at 5%; * significant at 10%. 2. Probabilities are shown in parentheses.
Based on the results obtained, with or without addition of other determinant factors to the model besides size, Gibrat´s Law is rejected (i.e. β1 ≠ 1 ) only for the upper quantiles of Portuguese SME growth distribution (75th, 90th, and 95th quantiles). For lower quantiles of growth distribution (5th, 10th and 25th quantiles), and in the quantile referring to the median of growth distribution (50th quantile), Gibrat´s Law (that is, β1 ≈ 1 ) is validated. We can conclude that the growth of the Portuguese SMEs is related to size for high rates of growth. When considering negative growth rates (5th, 10th and 25th quantiles) and low rates of growth (50th quantile), Portuguese SME growth is independent of size. It is noticeable that with an OLS regression, that considers the central tendency of
23
growth distribution, the results obtained are similar to those obtained for the upper quantiles of Portuguese SME growth distribution, rejecting Gibrat´s Law.
4.2.2. Size
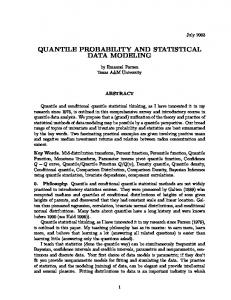
In Figure 1 it is possible to observe the evolution of estimated parameters, concerning the relationship between growth and size, for the different quantiles of Portuguese SME growth distribution. Figure 1: Estimated coefficients for the relationship between GROWTHi,t and SIZEi,t-1
Estimated coefficients
0,02 0 -0,02
5qt
10qt
25qt
50qt
75qt
90qt
95qt
OLS Lower - QR
-0,04
Upper - QR
-0,06
Lower OLS Upper OLS QR
-0,08 -0,1 -0,12 Quantiles
We find that on moving up the growth distribution (75th, 90th and 95th quantiles) the results are considerably different from those obtained in the other quantiles, in that there are significant negative relationships between growth and size. Despite negative relationships between growth and size for the different quantiles of growth distribution, these relationships are only statistically significant for the upper quantiles of growth distribution (75th, 90th and 95th). Comparison of the estimated parameters referring to the upper quantiles (75th, 90th and 95th) with those obtained with an OLS regression shows that the estimated parameters are substantially higher in the 75th, 90th and 95th quantiles. Therefore, we 24
conclude that the negative relationships between growth and size have greater magnitude when considering the upper levels of company growth distribution, compared to the results obtained when considering the central tendency of growth distribution. To investigate the existence of non-linearity, concerning the relationship between growth and size in Portuguese SMEs, throughout growth distribution, Table 8 presents the results of the Chow test.
Table 8: Test of Non – Linearity between GROWTH and SIZE 5qt 10qt 25qt 50qt 75qt 90qt 95qt 5qt 1 F(1,1840) 10qt 0.11 1 F(1,1840) (0.735) 25qt 0.02 0.41 1 F(1,1840) (0.887) (0.523) 50qt 0.00 0.15 0.06 1 F(1,1840) (0.975) (0.696) (0.814) 75qt 7.11*** 6.89*** 7.32*** 9.64*** 1 F(1,1840) (0.007) (0.008) (0.007) (0.002) 7.74*** 1 90qt 8.42*** 9.33*** 13.84*** 14.67*** F(1,1840) (0.003) (0.002) (0.000) (0.000) (0.005) 95qt 10.76*** 11.67*** 15.28*** 15.68*** 8,48*** 0.83 1 F(1,1840) (0.000) (0.000) (0.000) (0.000) (0.003) (0.316) 17.98*** Global Difference F(5,1840) (0.000) Notes: 1. *** significant at 1%; ** significant at 5%; * significant at 10%. 2. Probabilities are shown in parentheses.
Based on the global test for equality of parameters, in the different quantiles of growth distribution, that measure the relationship between growth and size, we reject the null hypothesis of equality of estimated parameters. Therefore, regarding the relationship between growth and size, we can conclude there is significant non-linearity over growth distribution10.
25
4.2.3. Age
In Figure 2 it is possible to observe the evolution of estimated parameters, regarding the relationship between growth and age, for the different quantiles of the growth distribution of Portuguese SMEs.
Figure 2: Estimated coefficients for the relationship between GROWTHi,t and AGEi,t-1 0,04 Estimated coefficients
0,02 0 -0,02
OLS 5qt
10qt
25qt
50qt
75qt
90qt
95qt
Lower - QR
-0,04
Upper - QR
-0,06
Lower OLS Upper OLS QR
-0,08 -0,1 -0,12 Quantiles
In the lower quantiles of growth distribution (5th, 10th and 25th) the negative relationships between growth and age are not statistical significant or in terms of magnitude of the estimated parameters. In the median quantile (50th) and in the upper quantiles of growth distribution (75th, 90th and 95th), the relationships between growth and age are statistically significant. Progressing up the growth distribution of Portuguese SMEs, magnitude of the relationship between growth and age gets bigger all the time, except for the fall in the 95th quantile. The estimated parameters in the upper quantiles of growth distribution (75th, 90th and 95th) of Portuguese SMEs are above the parameter estimated with an OLS regression.
26
In order to identify possible non-linearities in the relationship between growth and age in Portuguese SMEs, throughout growth distribution, we present the results of the Chow test in Table 9.
Table 9: Test of Non – Linearity between GROWTH and AGE 5qt 10qt 25qt 50qt 75qt 90qt 95qt 5qt 1 F(1,1840) 10qt 0.15 1 F(1,1840) (0.700) 25qt 0.28 0.08 1 F(1,1840) (0.595) (0.778) 50qt 5.12** 4.72** 4.21** 1 F(1,1840) (0.023) (0.031) (0.048) 75qt 10.17*** 11.47*** 12.41*** 0.60 1 F(1,1840) (0.000) (0.000) (0.000) (0.437) 7.10*** 1 90qt 17.91*** 15.12*** 13.98*** 17.41*** (0.000) (0.000) (0.000) (0.007) F(1,1840) (0.000) 95qt 13.92*** 12.49*** 13.12*** 11.44*** 4.62** 1.31 1 F(1,1840) (0.000) (0.000) (0.000) (0.000) (0.033) (0.253) Global Difference 19.12*** F(5,1840) (0.000) Notes: 1. *** significant at 1%; ** significant at 5%; * significant at 10%. 2. Probabilities are shown in parentheses.
The obtained results allow rejection of the null hypothesis of equality of estimated parameters in the different quantiles of the growth distribution of Portuguese SMEs. Based on this result, we can conclude there are significant non-linearities in the relationship between growth and age, over growth distribution11.
4.2.4. Intangible Assets
Figure 3 presents evolution of the estimated parameters referring to the relationship between growth and intangible assets, for the different quantiles of the growth distribution of Portuguese SMEs.
27
Figure 3: Estimated coefficients for the relationship between GROWTHi,t and INTANGi,t-1 1,2 Estimated coefficients
1 0,8
OLS
0,6 0,4
Lower - QR
0,2
Upper - QR
0 -0,2
5qt
10qt
25qt
50qt
-0,4 -0,6
75qt
90qt
95qt
Lower OLS Upper OLS QR
-0,8 Quantiles
As for the relationship between growth and intangible assets in Portuguese SMEs, we find the results are considerably different over the distribution of Portuguese SME growth: (i) in the 5th, 10th, 25th, 50th and 75th quantiles, there is a negative relationship between growth and intangible assets, although always statistically insignificant; and (ii) in the 90th and 95th quantiles there is a positive and statistically significant relationship between growth and intangible assets in Portuguese SMEs. It is particularly relevant to highlight the considerable increase of the estimated parameter from the 90th quantile (0.2047) to the 95th quantile (0.4719). This considerable increase of the estimated parameter shows the importance of intangible assets in determining the growth of Portuguese SMEs, when considering companies with higher growth levels, referring to the upper quantiles of growth distribution. Observation of the results of an OLS regression shows a positive relationship, but not significant in statistical terms, between growth and intangible assets, the estimated parameter being considerably less than that estimated in the 90th and 95th quantiles.
28
Next we present the results of the Chow test for identifying possible non-linearities in the relationship between growth and intangible assets in Portuguese SMEs, throughout growth distribution. Table 10 presents these results.
Table 10: Test of Non – Linearity between GROWTH and INTANGIBLE ASSETS 5qt 10qt 25qt 50qt 75qt 90qt 95qt 5qt 1 F(1,1840) 10qt 0.05 1 F(1,1840) (0.818) 25qt 0.06 0.01 1 F(1,1840) (0.810) (0.913) 50qt 0.02 0.02 0.14 1 F(1,1840) (0.879) (0.881) (0.709) 75qt 0.03 0.00 0.02 0.00 1 F(1,1840) (0.867) (0.948) (0.884) (0.963) 90qt 36.7*** 42.73*** 38.41*** 32.16*** 26.78*** 1 F(1,1840) (0.000) (0.000) (0.000) (0.000) (0.000) 53.19*** 7.35 1 95qt 68.05*** 67.41*** 62.47*** 64.41*** F(5,1840) (0.000) (0.000) (0.000) (0.000) (0.000) (0.006) Global Difference 20.43*** F(5,1840) (0.000) Notes: 1. *** significant at 1%; ** significant at 5%; * significant at 10%. 2. Probabilities are shown in parentheses.
Analysis of the results allows rejection of the null hypothesis of equality of estimated parameters in the different quantiles of growth distribution. Therefore, there are significant non-linearities in the relationship between growth and intangible assets, over the distribution of Portuguese SME growth12.
4.2.5. Internal Finance
In Figure 4 it is possible to observe the evolution of the estimated parameters, referring to the relationship between growth and cash flow in Portuguese SMEs, for the different quantiles of growth distribution.
29
Figure 4: Estimated coefficients for the relationship between GROWTHi,t and CFi,t-1
Estimated coefficients
1 0,8 OLS
0,6
Lower - QR
0,4
Upper - QR
0,2 0 -0,2
5qt
10qt
25qt
50qt
75qt
90qt
95qt
Lower OLS Upper OLS QR
-0,4 Quantiles
We detect a positive relationship between growth and cash flow in Portuguese SMEs throughout growth distribution. It is of note that in all quantiles, that relationship is statistically significant. Based on the results obtained, we can conclude that internal finance is relevant in explaining the growth of Portuguese SMEs. The effect of internal finance on growth takes on increasing importance, moving up the growth distribution of Portuguese SMEs, except for the 90th and 95th quantiles. The estimated parameters in the 50th, 75th and 90th quantiles have a greater magnitude than the parameter estimated with an OLS regression, having less magnitude in the other quantiles of the growth distribution of Portuguese SMEs. Table 11 presents results of the Chow test, to check for possible non-linearities in the relationship between growth and cash flow in Portuguese SMEs, over growth distribution.
Table 11: Test of Non – Linearity between GROWTH and CASH FLOW 5qt F(1,1840) 10qt F(1,1840) 25qt F(1,1840) 50qt F(1,1840)
5qt 1
10qt
0.27 1 (0.603) 15.30*** 8.10*** (0.000) (0.004) 25.16*** 20.14*** (0.000) (0.000)
25qt
50qt
75qt
90qt
95qt
1 8.74*** (0.003)
1
30
75qt 41.06*** 30.04*** 10.45*** 5.78** 1 F(1,1840) (0.000) (0.000) (0.000) (0.016) 90qt 30.02*** 21.47*** 7.11*** 0.99 1.35 1 (0.000) (0.008) (0.319) (0.245) F(1,1840) (0.000) 95qt 4.64** 4.22** 0.07 4.27** 9.92*** 7.69*** 1 F(1,1840) (0.031) (0.039) (0.787) (0.038) (0.002) (0.006) Global Difference 18.97*** F(5,1840) (0.000) Notes: 1. *** significant at 1%; ** significant at 5%; * significant at 10%. 2. Probabilities are shown in parentheses.
We reject the null hypothesis of equality of estimated parameters in the different quantiles of the growth distribution of Portuguese SMEs, and so we can conclude there are significant non-linearities in the relationship between growth and cash flow, over growth distribution13.
4.2.6. External Finance
Figure 5 presents evolution of the estimated parameters concerning the relationship between growth and Portuguese SME debt, for the different quantiles of growth distribution.
Figure 5: Estimated coefficients for the relationship between GROWTHi,t and LEVi,t-1
Estimated coefficients
0,3 0,2 OLS
0,1
Lower - QR
0 -0,1
5qt
10qt
25qt
50qt
75qt
90qt
95qt
Upper - QR Lower OLS Upper OLS QR
-0,2 -0,3 -0,4 Quantiles
31
As for the results referring to the relationship between growth and debt, these vary considerably over growth distribution: (i) in the 5th, 10th, 25th and 95th quantiles, we detect a negative relationship between growth and debt, although in the 95th quantile the estimated parameter is not statistically significant; and (ii) in the 50th, 75th and 90th quantiles, we find a positive relationship between growth and debt in the debt of Portuguese SMEs, the estimated parameters being significant in statistical terms, in these cases. The results suggest that access to external finance restricts the growth of Portuguese SMEs, especially for those that present negative growth, that is, those in the lower quantiles of growth distribution. However, external finance becomes a catalyst of growth on progressing through growth distribution, i.e. when considering the upper quantiles of distribution. Between the 50th quantile and the 90th quantile, the effect of external finance on growth has increasing importance, given that the magnitude of the estimated parameter becomes greater on progressing up growth distribution. Nevertheless, in the 95th quantile, the effect of external finance on growth becomes negative, although the parameter is not significant in statistical terms. With an OLS regression, there is a positive relationship, although not significant statistically, between growth and debt in Portuguese SMEs. Magnitude of the parameters estimated in the 75th and 90th quantiles is considerably above magnitude of the parameter estimated with an OLS regression. Next we present the results of the Chow test for possible non-linearities in the relationship between growth and debt in Portuguese SMEs, throughout growth distribution. Table 12 presents these results.
32
Table 12: Test of Non – Linearity between GROWTH and DEBT 5qt 10qt 25qt 50qt 75qt 90qt 95qt 5qt 1 F(1,1840) 10qt 0.04 1 F(1,1840) (0.834) 25qt 9.83*** 13.93*** 1 F(1,1840) (0.002) (0.000) 50qt 21.40*** 20.82*** 11.66*** 1 (0.000) (0.000) F(1,1840) (0.000) 75qt 23.31*** 16.02*** 17.77*** 16.57*** 1 F(1,1840) (0.000) (0.000) (0.000) (0.000) 90qt 31.29*** 16.38*** 18.23*** 12.41*** 0.18 1 F(1,1840) (0.000) (0.000) (0.000) (0.000) (0.673) 95qt 9.14*** 8.66*** 0.10 0.36 9.14*** 10.27*** 1 F(1,1840) (0.003) (0.003) (0.751) (0.548) (0.002) (0.000) Global Difference 28.87*** F(1,1836) (0.000) Notes: 1. *** significant at 1%; ** significant at 5%; * significant at 10%. 2. Probabilities are shown in parentheses.
Regarding the relationship between growth and debt in Portuguese SMEs, we reject the null hypothesis of equality of estimated parameters in the different quantiles of growth distribution. Based on the result obtained, we can conclude that concerning the relationship between growth and debt, there are significant non-linearities over growth distribution14.
5. Discussion of the Results
Choosing the second form of the test of Gibrat’s Law, proposed by Mansfield (1962), and which considers all surviving companies, let us carry out an empirical approach to Gibrat’s Law, including surviving companies with negative growth rates. The justification for carrying out this type of empirical approach is to avoid including companies that left the market over the period of study, something which could lead us to accept Gibrat’s Law as valid. From analysis of the quantile regressions, we can conclude that Gibrat´s Law is only rejected for the upper quantiles of the growth distribution of Portuguese SMEs. Gibrat’s
33
Law is accepted as valid for the lower quantiles of growth distribution and the median quantile since, contrary to the upper quantiles, we find a relationship of independence between growth and size in Portuguese SMEs. Over the different quantiles of the growth distribution of Portuguese SMEs, the results concerning the relationship between growth and age are relatively similar to those obtained for the relationship between growth and size. However, in the median quantile of the growth distribution of Portuguese SMEs, there is a negative relationship between growth and age, whereas growth is independent of size. The empirical results obtained only allow corroboration of the conclusions by Sutton (1997), in the upper quantiles of growth distribution, since size is not correlated with company growth, for low rates of growth. The empirical evidence obtained in this study suggests that Portuguese SMEs grow towards the attainment of a minimum efficient scale that allows for increased probability of survival, corroborating the conclusions by Barkham et al. (1996) and Audretsch et al. (2004). In fact, as we consider upper quantiles, that include observations corresponding to higher rates of growth, we detect a negative relationship between growth and size, as well as increasing magnitude of estimated parameters, on progressing up growth distribution. Therefore, we can conclude that the search for a minimum efficient scale takes on special importance in explaining the growth of Portuguese SMEs. The empirical evidence revealed here corroborates the results obtained in previous studies for different countries, namely for Portugal (Mata, 1994; Oliveira and Fortunato, 2006), Sweden (Heshamati, 2001), Italy (Becchetti and Trovato, 2002; Lotti et al. 2003), Spain (Calvo, 2006; Moreno and Casillas; 2007) and Japan (Yasuda, 2005; Honjo and Harada, 2006), but only when considering observations regarding higher
34
rates of growth. The results revealed here are different from those obtained in the studies mentioned above, for the lower and median quantiles of growth distribution, in that these show a relationship of independence between growth and size in Portuguese SMEs. Similarly to what was said about the effect of size on growth, also in the case of age, on moving throughout the growth distribution, by considering observations of higher rates of growth, there is an increasing magnitude of the negative effect of age on growth of Portuguese SMEs. The results obtained reveal that greater age contributes to diminished growth in Portuguese SMEs, this statement being valid in the upper quantiles and the median quantile of growth distribution. Turning to the lower quantiles, the results show that Portuguese SME growth is independent of age. The conclusions by Jovanovic (1982), Fariñas and Moreno (1997), Lumpkin (1998), and Shane and Venkataraman (2000), that point towards a negative relationship between growth and age, as a consequence of younger companies’ greater possibility to grow, are corroborated by the empirical evidence in this study, but only when not considering the lower quantiles of growth distribution. Similarly, the conclusions of most studies carried out in the context of SMEs, namely for Portugal (Mata, 1994; Oliveira and Fortunato, 2006), Italy (Becchetti and Trovato, 2002), Spain (Calvo, 2006; Moreno and Casillas, 2007) and Japan (Yasuda, 2005; Honjo and Harada, 2006), are corroborated, partially, by the results obtained in the upper quantiles and the median quantile of growth distribution. Concerning the importance of intangible assets on growth, for the quantiles containing observations with the highest growth rates (90th and 95th quantiles), we detect a positive effect of intangible assets on the growth of Portuguese SMEs, that
35
effect being considerably more significant in the 95th quantile of growth distribution. Therefore, the results obtained show, unequivocally, that intangible assets catalyse growth, especially for upper levels of Portuguese SME growth distribution. In the context of Portuguese SMEs, the contribution of the intangible assets to improved company performance (Griliches and Lichtenberg, 1984; Pusher, 1995, Cressy and Olofson, 1996; Deloof, 2003; Smith et al., 2004; Audia and Greve, 2006; Chen et al., 2006) only seems to be important for companies with high growth rates. When Portuguese SMEs present low or moderate growth rates, the intangible assets do not contribute to company growth. For the 90th and 95th quantiles, the results of this study, concerning the relationship between growth and intangible assets, are in agreement with those obtained for the situation in Japan (Yasuda, 2005) and Spain (Calvo, 2006), something which does not occur when considering the results of the remaining quantiles. These results can be justified by the fact that taking advantage of growth opportunities for SMEs, in the form of investment in intangible assets, is fundamental, when they present high levels of growth. These ratify the vision of Rogers (2004) that intangible assets are an important factor in the matter of increased SME growth. Internal finance has a decisive importance in determining Portuguese SME growth, throughout growth distribution. Indeed, throughout growth distribution, we see increasing magnitude of the positive effect of internal finance on growth, except for the 90th and 95th quantiles. Therefore, the results obtained here corroborate the arguments of Reid (2003), and the empirical results of Cooley and Quadrini (2001), and Cabral and Mata (2003) that internal finance is a catalyser of SME growth. Cabral (2007), in comparison with SMEs of other European countries, underlines the difficulty felt by Portuguese SMEs in accessing external finance. In this context,
36
internal finance becomes more important, in order to finance growth (Fazzari et al., 1988; Bechetti and Trovato, 2002). The conclusions of Fazzari et al. (1988) are corroborated, in the sense that results now obtained also show the importance of internal finance in determining the growth of Portuguese SMEs, whatever the quantile of growth distribution considered. The results of this study about the relationship between growth and internal finance are identical to those obtained for different national studies, namely for Germany (Audretsch and Elston, 2002), the United States (Carpenter and Petersen, 2002), Portugal (Cabral and Mata, 2003; Oliveira and Fortunato, 2006) and Spain (Moreno and Casillas, 2007), whatever the quantile of growth distribution under consideration. External finance produces different effects on the growth of Portuguese SMEs, throughout growth distribution. For the lower quantiles of growth distribution, debt contributes negatively to the growth of Portuguese SMEs. When considering upper quantiles and the median quantile of growth distribution, the effect of debt on growth is the opposite, i.e. debt has a positive effect on the growth of Portuguese SMEs. However, in the 95th quantile the effect of debt on growth becomes negative again, although the estimated parameter is not significant. When considering the results obtained for Portuguese SMEs, the positive effects, expected by Meyer (1998), of debt on company growth are partially corroborated, in that the effects referred to only have increased importance in the upper quantiles and in the median quantile of growth distribution, except for the 95th quantile. The conclusions of Baker and Nelson (2005), and George (2005) that point to debt being able to contribute to SME growth, given the pressure felt favouring greater efficiency in use of resources, are not corroborated empirically in the lower quantiles of growth distribution. Based on the results, we can conclude that Portuguese SMEs with
37
low rates of growth are not particularly efficient in managing external finance, debt being a factor that restricts growth. Since in the case of SMEs, ownership and management are usually concentrated in the same individuals, we cannot conclude that the positive effect of debt on Portuguese SME growth in the 50th, 75th and 90th quantiles, is due to the disciplining role of debt in the alignment of managers interests with company’s maximizing value as Lang et al. (1996) concluded, in the context of large companies. The empirical evidence obtained here for Portuguese SMEs in the lower quantiles of growth distribution contribute to confirmation of a negative relationship between growth and external finance, that was already identified by Becchetti and Trovato (2002), for Italian SMEs, when considering together surviving and non-surviving companies. In addition, the positive relationship between growth and debt in Portuguese SMEs in the 50th, 75th and 90th quantiles goes towards corroborating the results of Honjo and Harada (2006), for Japanese SMEs, when considering companies` volume of sales as the measuring of size.
6. Conclusions and Implications
The current study uses the quantile regressions that aimed fundamentally to investigate possible non-linearities between SME growth and their determinant factors. The results allow the identification of substantial differences throughout growth distribution, using a sample of Portuguese SMEs. The empirical evidence of this study, firstly, allow us to conclude about
the
existence of significant non-linearities between SME growth and the determinants of growth throughout the growth distribution. Secondly, as consequence of the existence of non-linearities between Portuguese SME growth and the determinants of growth, it is
38
possible to conclude that: (i) Gibrat´s Law is accepted as valid for the lower levels of growth distribution, but the opposite happens for the upper levels of
growth
distribution, where Gibrat´s Law is not accepted; (ii) for lower levels of growth distribution, internal finance is a catalyser of growth, but
external finance is a
restrictive factor of growth; and (iii) for upper levels of growth distribution, internal finance and external finance as well as intangible assets are catalysers of growth; conversely, size and age company are restrictive factors of growth. It is particularly relevant the catalyser effect of the intangible assets on Portuguese SME growth in the highest quantile of the growth distribution, where the effect of external finance is almost negligenciable. The empirical evidence of this study, allow us to identify the relative importance of the determinants factors of Portuguese SME growth: on the one hand, for the lower levels of growth distribution, the Portuguese SMEs are strongly dependent on the internal finance, which is fundamental to support their growth, being external finance a restrictive factor of growth. On the other hand, for the upper levels of growth distribution, still that internal finance and external finance are catalysers of growth, intangible assets are the most decisive catalyser for the Portuguese SME growth. Furthermore, for the upper levels of growth distribution, size and age company contribute for a less growth of Portuguese SMEs. As far as the limitations are concerned, it is worth pointing out firstly that, given the information available, it was not possible to break up the variable referring to intangible assets into different components (e.g. R&D, Brand Image, Intellectual Property Rights, Patents, etc). Secondly, given the methodology used, it is not possible to test the relationship between growth in the previous period and growth in the current period, since this would be an alternative way to extend the classic test of Gibrat’s Law, which
39
could only be tested by recourse to the use of dynamic panel estimators allowing elimination of the correlation between lagged growth and the error in the previous period. Despite the limitations identified, and with this study focused on a sample of Portuguese SMEs, the fact that the results obtained here provide evidence of nonlinearities between SME growth and their determinant factors, over growth distribution, provides important insights and implications for owners and managers of SMEs. Firstly, the fact of not considering Gibrat’s Law as valid for SMEs with low or moderate growth rates suggests that this type of SMEs need a strategic change to move forward in order to reach a minimum efficient scale and in this way ensure survival. Secondly, the results suggest a different effect of debt on SME growth, being positive when they present moderate and high growth rates, although the same factor restricts growth when recording low growth rates. Therefore, it is suggested for SME owners and managers to carry out efficient management of resources so as to, on the one hand, maximize growth opportunities and, on the other hand, minimize the level of risk. In this way, use of external finance can be fundamental to overcome insufficiencies, in terms of internal finance, contributing for taking advantage of growth opportunities. Otherwise, inefficient resource management, given the need for making periodic payment of debt charges, can contribute decisively to diminished company growth and consequently increased likelihood of exiting the market. Thirdly, the results of this study indicate that the intangible assets owned by the SMEs can catalyse growth, especially in situations of high growth rates (i.e. 90th quantile and 95th quantile). Owners and managers of SMEs should take advantage of growth opportunities, in the form of intangible assets, for differentiating and
40
diversifying their activities, so as to minimize business risk and consequently the likelihood of exiting the market. Regarding implications for public policy makers, it should be emphasised that in Portugal, as in the great majority of European countries, SMEs make up almost the entire productive system, being the main lever of wealth creation and contributing decisively to the country’s economic growth on a microeconomic basis. The considerable difficulties generally faced by SMEs in accessing external finance, in cases of insufficient internal finance, can decisively restrict their growth. In this context, and based on the importance of combining intangible assets, external and internal finance for stimulating even more the high growth SMEs it is suggested that policy-makers for one thing, create financial incentives for young SMEs developing an organizational culture and intrapreneurship practices directed towards the reinforcement of their intrinsic entrepreneurial innovation capacity. For another, they should intermediate in access to external finance, so that SMEs can fulfil growth opportunities, namely through providing the guarantees demanded of SMEs in matters of debt, and facilitating access to the catalysers of SME growth, such as intangible assets, especially for high levels of growth. Finally, in terms of guidelines for future investigations, it will be interesting to study the effect of intangible assets on SME growth, but using a breakdown of information regarding the components of this type of asset. In this line of research, it would also be a suggestion to make comparative analysis of the importance of the different components of intangible assets in determining the growth of gazelle companies, in different sectors of economic activity.
41
1
Fotopoulos and Louri (2004) study determinants of growth to Greece companies,
using quantile approach, but not in SMEs context. 2
Internal finance corresponds to financial resources generated by company activity and
can be measured based on company cash flow. 3
External finance concerns financial resources obtained from finance sources outside
the company and may be sources of external capital or sources of equity. 4 5
Understood as being companies not listed in the stock market. Intangible Assets include Installation Expenditure, Expenditure of Research and
Development, Industrial Property, Other Rights and Other Intangible Assets. 6
Michaelas et al. (1999) and Sogorb-Mira (2005), although not specifically studying
the relationship between growth and their determinants, use as a measure of SME growth opportunities, the ratio of intangible assets to total assets. In this study, in the absence of data for expenditure on R&D by Portuguese SMEs, we use the same ratio as a way of measuring the impact of greater innovating propensity and strategic flexibility on Portuguese SME growth. 7
In the current paper the book value of debt is used, since all companies in the sample
have closed capital. 8
We present results of the test of Gibrat´s Law for the three quantile regressions
described above: (i) classic test; (ii) classic test and age; and (iii) all the explanatory variables considered in this study. 9
In the case of the Chow test for possible non-linearity throughout growth distribution
and graphs, we only present results concerning the situation where we consider all the growth determinants previously named.
42
10
The results of equality of parameters between each of the different quantiles imply the
rejection of the null hypothesis of equality of parameters, especially when comparing lower and upper quantiles of growth distribution. 11
As happens in the case of the relationship between growth and size, rejection of the
null hypothesis of equality of estimated parameters is influenced above all by rejection of the null hypothesis of equality of parameters between the quantiles of low and high growth. 12
The differences between the estimated parameters in the 90th and 95th quantiles and
the other quantiles of growth distribution contribute to this result. 13
When going on to test equality of estimated parameters between pair of estimated
parameters in each quantiles of the growth distribution of Portuguese SMEs, in most situations we reject the null hypothesis of equality of estimated parameters. 14
Similarly to what was described previously for the relationship between growth and
cash flow in Portuguese SMEs, the null hypothesis of equality of estimated parameters between each of the quantiles of growth distribution is rejected in most situations.
43
References
Aivazian, V., Ge, Y. and Qiu, J. (2005), ´The Impact of Leverage on Firm Investment: Canadian Evidence`, Journal of Corporate Finance, 11, 277-291. Ang, J. (1992), ´On the Theory of Finance for Privately Held Firms`, The Journal of Small Business Finance, 1, 185-203.
Audia, P. and Greve, H. (2006), ´Less Likely to Fail: Low Performance Firm Size, and Factory Expansion in the Shipbuilding Industry`, Management Science, 52, 83-94. Audretsch, D. and Elston, J. (2002), ´Does Firm Size Matter? Evidence on the Impact of Liquidity Constraints on Firm Investment Behavior in Germany`, International Journal of Industrial Organization, 20, 1-17.
Audretsch D, Klomp, L., Santarelli, E. and Thurik, A. (2004), ´Gibrat´s Law: Are the Services Different?`, Review of Industrial Organization, 24, 301-324. Baker, T. and Nelson, R. (2005), ´Creating Something From Nothing: Resource Construction
Through
Entrepreneurial
Bricolage`,
Administrative
Science
Quarterly, 50, 329-366.
Barkham, R., Gudgin, G., Hart, M. and Harvey, E. (1996), The Determinants of Small Firm Growth: As Inter – Regional Study in the United Kingdom 1986-90.
Routledge: London Becchetti, L. and Trovato, G. (2002), ´The Determinants of Growth for Small and Medium Sized Firms`, Small Business Economics, 19, 291-306. Buchinsky, M. (1995), ´Estimating the Asymptotic Covariance Matrix for Quantile Regression Models: A Monte Carlo study`, Journal of Econometrics, 68, 303-338. Buchinsky, M. (1998), ´Recent Advances in Quantile Regression Models: A Practical Guideline for Empirical Research`, Journal of Human Resources, 33, 8-126. 44
Cabral L. and Mata, J. (2003), ´On the Evolution of the Firm Size Distribution: Facts and Theory`, The American Economic Review, 93, 1075-1095. Cabral, L. (2007), ´Small Firms in Portugal: a Selective Survey of Stylised Facts, Economic Analysis, and Policy Implications`, Portuguese Economic Journal, 6, 6588. Calvo, J. (2006), ´Testing Gibrat´s Law for Small, Young and Innovating Firms`, Small Business Economics, 26, 117-123.
Carpenter, R. and Petersen, B. (2002), ´Is the Growth of Small Firms Constrained by Internal Finance?`, The Review of Economics and Statistics, 84, 298-309. Chen, T. – S., Lin, M. – J. and Chang, C. – H. (2006), ´The Influence of Intellectual Capital on New Product Development Performance – The Manufacturing Companies of Taiwan as an Example`, Total Quality Management, 17, 1323 – 1339. Cooley, T. and Quadrini, V. (2001), ´Financial Markets and Firm Dynamics`, The American Economic Review, 91, 1286-1310.
Cowling, M. (2003), ´Productivity and Corporate Governance in Smaller Firms`, Small Business Economics, 20, 335–344.
Cressy, R. and Olofsson, C. (1996), ´The Financial Conditions for Swedish SMEs: Survey and Research Agenda`, Small Business Economics, 9, 179-194. Crutchley, C. and Hansen, R. (1989), ´A Test of the Agency Theory of Managerial Ownership, Corporate Leverage, and Corporate Dividends`, Financial Management, Winter, 36-46. Deloof, M. (2003), ´Does Working Capital Management Affect Profitability of Belgian Firms`, Journal of Business Finance and Accounting, 30, 573-588.
45
Fariñas, J. and Moreno, L. (1997), ´Size, Age and Growth: an Application to Spanish Manufacturing Firms`, Working Paper 9705, Fundación Empresa Pública, Universidad Complutense de Madrid: Madrid. Fazzari M., Hubbard, S. and Petersen, B. (1988), ´Financing Constraints and Capital Investment`, Brooking Papers of Economic Activity, 1, 141-195. Fotopoulos, G. and Louri, H. (2004), ´Firm Growth and FDI: Are Multinationals Stimulating Local Industry Development`, Journal of Industry, Competition and Trade, 4, 163-189.
George, G. (2005), ´Slack Resources and the Performance of Privately Held Firms`, Academy of Management Journal, 48, 661-676
Gibrat, R. (1931), Les Inégalités Économiques. Librairie du Recueil Sirey: Paris Griliches, Z. and Lichtenberg, F. (1984), ´R&D and Productivity Growth at Industry Level: Is There Still a Relationship?`. Z. Griliches(ed.), R&D, Patents and Productivity, Chicago, University of Chicago Press: Chicago. Hall, B. (1987), ´The Relationship Between Firm Size and Firm Growth in the US Manufacturing Sector`, Journal of Industrial Economics, 35, 583-605. Harris, M. and Raviv, A. (1991), ´The Theory of Capital Structure`, The Journal of Finance, 46, 297-355.
Heshmati, A. (2001), ´On the Growth of Micro and Small Firms: Evidence From Sweden`, Small Business Economics, 17, 213-228. Honjo, Y. and Harada, N. (2006), ´SME Policy, Financial Structure and Firm Growth: Evidence From Japan`, Small Business Economics, 27, 289-300. IAPMEI, (2008), Sobre as PMEs em Portugal. Instituto de Apoio à Pequena e Média Empresa: Lisboa.
46
Jensen, G., Solberg, D. and Zorn, T. (1992), ´Simultaneous Determination of Insider Ownership, Debt and Dividend Policies`, Journal of Financial and Quantitative Analysis, 27, 247-263.
Jovanovic, B. (1982), ´Selection and Evolution of Industry`, Econometrica, 50, 649670. Koenker, R. and Hallock, K. (2001), ´Quantile Regression: an Introduction`, Journal of Economic Perspectives, 15, 143-156.
Lang, L., Ofek, E. and Stulz, R. (1996), ´Leverage, Investment, and Firm Growth`, Journal of Financial Economics, 40, 3-29.
Lotti, F., Santarelli, E. and Vivarelli, M. (2003), ´Does Gibrat´s Law Hold Among Young, Small Firms?`, Journal of Evolutionary Economics, 14, 213-235. Lumpkin, G. (1998), ´Do New Entrants Have an Entrepreneurial Orientation?`, Paper Presented at the 1998 Academy of Management Meeting, San Diego, CA. Mansfield, E. (1962), ´Entry, Gibrat`s Law, Innovation, and the Growth of Firms`, American Economic Review, 52, 1023-1051.
Mata, J. (1994), ´Firm Growth During Infancy`, Small Business Economics, 6, 27-39. Meyer, L. (1998), ´The Present and Future Roles of Banks in Small Business Finance`, Journal of Banking and Finance, 22, 1109-1116.
Michaelas, N., Chittenden, F. and Poutziouris, P. (1999), ´Financial Policy and Capital Structure Choice in U.K. SMEs: Empirical Evidance From Panel Data`, Small Business Economics, 12, 113-130.
Moreno, A, and Casillas, J. (2007), ´High – Growth SMEs Versus Non – High Growth SMEs: a Discriminant Analysis`, Entrepreneurship and Regional Development, 19, 69 – 88.
47
Oliveira, B. and Fortunato, A. (2006), ´Firm Growth and Liquidity Constraints: A Dynamic Analysis`, Small Business Economics, 27, 139-156. Pettit, R. and Singer, R. (1985), ´Small Business Finance: a Research Agenda`, Financial Management, 14, 47-60.
Pusher, G. (1995), ´Equity Ownership Structure, Leverage, and Productivity: Empirical Evidence From Japan`, Pacific-Basin Finance Journal, 3, 241-255. Reid, G. (2003), ´Trajectories of Small Business Financial Structure`, Small Business Economics, 20, 273-285.
Rogers, M. (2004), ´Networks, Firm Size and Innovation`, Small Business Economics, 22, 141-153. Shane, S. and Venkataraman, S. (2000), ´The Promise of Entrepreneurship as a Field of Research`, Academy of Management Review, 25, 217-226. Smith, V., Harsenm, M., Eriksson, T. and Madsen, E. (2004), ´R&D Productivity in Danish Firms: Some Empirical Evidence`, Applied Economics, 36, 1797-1806. Sogorb-Mira, F. (2005), ´How SME Uniqueness Affects Capital Structure: Evidence From A 1994-1998 Spanish Data Panel`, Small Business Economics, 25, 447-457. Stiglitz, J. and Weiss, A. (1981), ´Credit Rationing in Markets With Imperfect Information`, The American Economic Review, 71, 393-410. Sutton, J. (1997), ´Gibrat´s Legacy`, Journal of Economic Literature, 35, 40-59. Yasuda, T. (2005), ´Firm Growth, Size, Age and Behavior in Japanese Manufacturing`, Small Business Economics, 24, 1-15.
48