Guess et al. Nutrition & Metabolism (2015) 12:36 DOI 10.1186/s12986-015-0033-2
RESEARCH
Open Access
A randomized controlled trial: the effect of inulin on weight management and ectopic fat in subjects with prediabetes Nicola D. Guess1,4*, Anne Dornhorst2, Nick Oliver2, Jimmy D. Bell3, E. Louise Thomas3 and Gary S. Frost1
Abstract Background: Fat infiltration of the liver, muscle and pancreas is associated with insulin resistance and risk of diabetes. Weight loss reduces ectopic fat deposition and risk of diabetes, but is difficult to sustain to due to compensatory increases in appetite. Fermentable carbohydrates have been shown to decrease appetite and food intake, and promote weight loss in overweight subjects. In animal studies, fermentable carbohydrate reduces ectopic fat independent of weight loss. We aimed to investigate the effect of the fermentable carbohydrate inulin on weight maintenance, appetite and ectopic fat in subjects with prediabetes. Methods: Forty-four subjects with prediabetes were randomized to 18 weeks’ inulin or cellulose supplementation. During weeks 1–9 (weight loss phase) all subjects had four visits with a dietitian to guide them towards a 5 % weight loss. During weeks 10–18 (weight maintenance phase) subjects continued taking their assigned supplementation and were asked to maintain the weight they had lost but were offered no further support. All subjects attended study sessions at baseline, 9 and 18 weeks for measurement of weight; assessment of adipose tissue and ectopic fat content by magnetic resonance imaging and magnetic resonance spectroscopy; glucose, insulin and GLP-1 levels following a meal tolerance test; and appetite by ad libitum meal test and visual analogue scales. Results: Both groups lost approximately 5 % of their body weight by week nine (−5.3 ± 0.1 % vs −4.3 ± 0.4 %, p = 0.13, but the inulin group lost significantly more weight between 9 and 18 weeks (−2.3 ± 0.5 % vs −0.6 ± 0.4 %, p = 0.012). Subjects taking inulin had lower hepatic (p = 0.02) and soleus muscle (p < 0.05) fat content at 18 weeks compared to control even after controlling for weight loss and consumed less at the ad libitum meal test (p = 0.027). Fasting glucose significantly decreased at week nine only (p = 0.005), insulin concentrations did not change, and there was a significant increase in GLP-1 in the cellulose group at 9 and 18 weeks (p < 0.03, p < 0.00001). Conclusion: Inulin may have a two-pronged effect on the risk of diabetes by 1) promoting weight loss 2) reducing intrahepatocellular and intramyocellular lipid in people with prediabetes independent of weight loss. Trial registration: Clinical trial number: NCT01841073. Keywords: Diabetes prevention, Diabetes risk, Weight management, Intrahepatocellular lipid, Intramyocellular lipid, Fibre, Carbohydrate, Appetite
* Correspondence:
[email protected] 1 Nutrition and Dietetic Research Group, Imperial College, London, Hammersmith Hospital, London W12 0NN, UK 4 Division of Diabetes, Endocrinology and Metabolism, 6th Floor Commonwealth Building, Faculty of Medicine, Imperial College Hammersmith Campus, Du Cane Road, London W12 ONN, UK Full list of author information is available at the end of the article © 2015 Guess et al. Open Access This article is distributed under the terms of the Creative Commons Attribution 4.0 International License (http://creativecommons.org/licenses/by/4.0/), which permits unrestricted use, distribution, and reproduction in any medium, provided you give appropriate credit to the original author(s) and the source, provide a link to the Creative Commons license, and indicate if changes were made. The Creative Commons Public Domain Dedication waiver (http://creativecommons.org/publicdomain/zero/1.0/) applies to the data made available in this article, unless otherwise stated.
Guess et al. Nutrition & Metabolism (2015) 12:36
Background Lifestyle interventions can significantly reduce the risk of developing type 2 diabetes (T2DM) [1] with weight loss being the primary mediator of the reduction in risk [2]. However, outside of a labour-intensive clinical trial setting, long-term weight loss is notoriously difficult to achieve [3, 4]. One explanation for the rarity of successful weight loss maintenance is that an energy deficit and loss of body fat are both associated with increases in appetite and food intake [5, 6]. Therefore, interventions such as glucagonlike peptide-1 (GLP-1) agonists aimed at decreasing or ameliorating such changes in appetite help promote longterm weight loss maintenance [7]. Non-digestible carbohydrate (dietary fibre) has long been linked to reduced food intake [8], and fermentable carbohydrates (FCHO) may be particularly effective [8]. This class of carbohydrate passes undigested and unabsorbed from the upper gastrointestinal tract to the colon where bacterial fermentation produces short chain fatty acids (SCFA) that can stimulate GLP-1, and regulate other appetite hormones [9]. Furthermore, as a natural dietary compound, FCHOs could represent a widely applicable public health intervention. By promoting a natural reduction in appetite, less frequent clinical support may needed. In a year-long study in overweight adolescents, there was a significantly lower rise in body mass index (BMI) in the inulin group, without receiving input from health professionals [10]. A key mediator of the beneficial effect of weight loss on insulin sensitivity is the loss of ectopic fat [11], which is highly correlated to insulin resistance and T2DM [11–13]. Intriguingly, FCHO has been shown to reduce ectopic fat in animal studies independent of weight loss [14]. This raises the possibility that this natural dietary carbohydrate may not only enhance weight loss efforts, but may also promote loss of this metabolically-deleterious fat in humans, even after accounting for weight loss. In healthy and insulin-resistant subjects, FCHO has been shown to improve insulin sensitivity [15, 16], but it is not clear whether a reduction in ectopic fat plays a role. No previous study has examined the effect of a dietary intervention on ectopic fat in subjects with prediabetes. Here we report the effect of 30 g/day (following a 4-week dose escalation period) inulin supplementation taken alongside a 9-week weight loss program and a 9-week weight maintenance period. We hypothesise the inulin will result in greater weight loss maintenance at the 18-week follow-up in subjects with prediabetes, and will promote a reduction in ectopic fat and insulin resistance independent of weight loss assessed by using the gold-standard magnetic resonance imaging (MRI) and magnetic resonance spectroscopy (MRS) techniques.
Page 2 of 10
Volunteers
Subjects with known prediabetes or high risk factors for prediabetes were identified from local GPs registers. Informed consent was obtained prior to the study. The protocols were approved by the North West 1 Research Ethics Committee (registration number: 10/H0717/32) (Clinical trial number: NCT01841073) and conformed to the Declaration of Helsinki. An oral glucose tolerance test (OGTT) was performed to clarify glycaemic status [17]. Inclusion criteria were age ≥ 18 years, BMI of 25–35 kg/m2, prediabetes (impaired fasting glucose (IFG) and/or impaired glucose tolerance (IGT)) using the American Diabetes Association criteria [17] and a stable body weight for 3 months prior to the study. Exclusion criteria were normal glucose tolerance, T2DM, gastrointestinal disorders, pregnancy or breastfeeding, prescribed medication that affects appetite or glucose homeostasis and consumption of prebiotic products or antibiotic use within 3 months of the study start date. Volunteers were randomised by BMI and gender using a random-number table, with an allocation ratio of 1:1. Experimental design
The study was a double-blinded randomized parallel control trial examining the effect of 30 g/day inulin (Synergy1,Orafti, Tienen, Belgium) versus the control cellulose (Vitacel® Powdered Cellulose L 600–20, J. Rettenmaier & Söhne GmbH + Co.) alongside a 9-week weight loss and 9-week weight maintenance program (Fig. 1). The fibre cellulose was chosen as a comparator as this unbranched polymer of glucose molecules linked by (β4-1) bonds undergoes minimal colonic fermentation. The 30 g dose was chosen based on previous studies by our group [18, 19]. Both supplements were given as 10 g sachets taken three times a day with food or drink. To reduce potential gastrointestinal side-effects supplements were increased by 10 g/day every 2 weeks to reach the 30 g/day dose. Therefore, by week five of the nine-week weight loss phase, all subjects were on the maximum 30 g/day dose. The inulin and cellulose sachets were assigned letter A or B and were otherwise identical. During the 9-week weight loss program each subject underwent a standardized dietary intervention comprising four dietary sessions 2–3 weeks apart with a registered dietitian (Fig. 1). The dietitian was blinded to the supplement allocation. Energy requirements and assigned portion sizes for starches, protein, milk and dairy, fats and sugars and fruits and vegetables were determined using a ready-reckoner developed at Hammersmith Hospital. Following the 9-week visit, subjects were given no further input or support from the study team. They were merely asked to try and maintain the weight that they had lost. All subjects attended a study day at baseline, 9 weeks (representing the end of the weight loss phase) and
Guess et al. Nutrition & Metabolism (2015) 12:36
Page 3 of 10
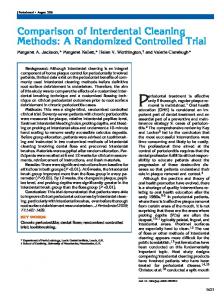
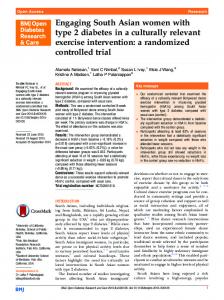
Fig. 1 Schematic showing study outline, including the timings of blood samples, VAS and breath hydrogen measure during the MTT. H2: breath hydrogen measure; MTT: meal tolerance test; MRS: magnetic resonance imaging; MRS: magnetic resonance spectroscopy; VAS: visual analogue scales
18 weeks (end of weight maintenance phase) for a meal tolerance test (MTT) (Ensure Plus™ (220 ml), Total energy: 1380 kJ, 44.4 g carbohydrate, 10.8 g fat, 13.8 g protein). Blood samples were taken at −15, 0, 5, 10, 15, 20, 30, 45, 60, 90, 120, 150, 180 min for measurement of glucose, insulin and GLP-1 (Fig. 1). Appetite was assessed during the MTT using validated [20] visual analogue scales (VAS) at frequent intervals, followed by an ad libitum meal test [20]. The appetite questions used were “How hungry are you right now?” (general hunger), “How much do you think you could eat right now?” (prospective food consumption), “How pleasant would it be to eat right now?” (desire to eat) and “How full do you feel right now?” (feeling of fullness in the stomach) (Additional file 1). Body composition was assessed by a 9-electrode bioelectrical impedance (BIA) device (Tanita BC-418 MA Segmental Body Composition Analyzer) (Tanita Corporation, Tokyo, Japan). The BIA device provides estimates of % body fat (±0.1 %), fat mass (±0.1 kg), and free fat mass (±0.1 kg). In addition, a subset of subjects who were eligible (no metal in situ or reported claustrophobia) (n = 20) underwent MRI and MRS to assess total and regional fat volumes at baseline, week nine and week 18. Rapid T1-weighted magnetic resonance images were obtained using a 1.5 T Phillips Achiva scanner (Phillips, Best, the Netherlands) [21] with intrahepatocellular lipid (IHCL), and intramyocellular lipid in the soleus and tibilalis muscles
(IMCL-S and IMCL-T, respectively) assessed by MRS as previously described [22]. Compliance was assessed by asking subjects to return unused sachets and breath hydrogen was measured as a proxy of colonic fermentation using a breath hydrogen monitor (Gastrolyzer, Bedfont Scientific Ltd. Kent, UK). Laboratory analysis
Glucose was collected into fluoride oxalate tubes and measured using an Architect ci8200 analyzer (Abbott Diagnostics, Maidenhead, UK), with an assay detection limit of 0.3 mmol/L and an intra-assay coefficient of variation (CV) of 1 %. Plasma insulin samples were collected into serum gel separator tubes containing gel clotting activator Vacutte® and measured with a commercial radioimmunoassay kit (Millipore; Watford, UK). The sensitivity and intra-assay CV for insulin were 7.1 pmol, and 3.0 % respectively. GLP-1 samples were collected into lithium heparin tubes, with aprotinin (Trasylol, Bayer, Newbury, UK) (200 μL/7.5 ml blood) added. Blood samples were spun at 4000 g at 4 °C for 10 mins, separated into plasma and stored at −20 °C until analysed using an in-house radioimmunoassay [23]. The sensitivity and intra-assay CV of the GLP-1 assay were 7.5 pmol/l and 3.3 % respectively. Calculations and statistical analysis
Based on a study by Parnell et al. [24] with an expected weight loss of 2.0 kg and a standard deviation of 2.0 kg
Guess et al. Nutrition & Metabolism (2015) 12:36
Page 4 of 10
based on 0.8 power to detect a significant difference (P < 0.05, 2-sided) we estimated a minimum of 32 subjects were needed; 16 additional subjects were added to account for dropouts. Data are presented as mean ± standard error of the mean (SEM) for normally distributed data and median and interquartile range for non-normally distributed variables. The postprandial response curves for GLP-1, glucose and insulin were calculated as total area under the curve (tAUC) using the trapezoid rule. The primary outcome of weight change between the inulin and cellulose groups was calculated using an ANCOVA with baseline weight as a covariate. The delta change between the insulin and cellulose groups (between group difference) for glucose, inulin, GLP-1, and measures of adiposity and ectopic fat were compared using ANCOVAs, with change in weight as a covariate. Non-parametric tests were used for variables not normally distributed. A p value of less than 0.05 was considered significant. Analyses were performed using GraphPad Prism Version 5.0 (GraphPad Software, San Diego, CA) and ANCOVA was performed using SPSS 20.0 (SPSS Inc. Chicago, IL USA). The homeostatic model assessment of insulin resistance (HOMA-IR) and Matsuda index were used to measure fasting and postprandial insulin sensitivity [25, 26].
Results Subject characteristics
The baseline characteristics of the subjects are shown in Table 1. There were no differences between the inulin and cellulose groups in any of the baseline characteristics. A total of 44 subjects were recruited and randomised of whom five withdrew from the study before week nine, including one taking inulin and one taking cellulose who dropped out due to side-effects. An additional subject withdrew following the week nine visit. See CONSORT Table 1 Subject characteristics for each arm of the study Inulin (n = 20)
Cellulose (n = 19)
p value
Gender (M:F)
13:8
11:9
0.66
Age (years)
58.2 ± 12.0
59.7 ± 8.9
0.53
Weight (kg)b
88.2 ± 14.0
83.4 ± 19.7
0.28
BMI (kg/m2)
30.8 ± 4.1
30.0 ± 2.3
0.41
FPG (mmol/L)
5.7 ± 0.5
5.9 ± 0.6
0.20
2hPG (mmol/L)
7.3 ± 2.3
7.3 ± 2.0
0.99
HbA1c (%) and (mmol/mola)
5.9 ± 0.1 (41.3 ± 1.4)
5.7 ± 0.1 (38.8 ± 0.9)
0.78
Fasting insulin (pmol/L)
95.4 (116.8)b
114.1 (132.9)b
0.17
Values are means and SD. Gender is expressed as a ratio of males to females. There were no significant differences between the groups for any of the baseline variables. FPG fasting plasma glucose; 2hPG 2-hour plasma glucose a SI units for HbA1c shown in brackets b Fasting insulin was not normally distributed so values given are for median (interquartile range)
diagram (Additional file 1). Furthermore, due to a dropout (n = 1) scheduling difficulties (n = 2), withdrawal of consent for MRI (n = 1) and no longer being eligible for MRI (n = 1) five subjects who underwent baseline and week nine MRI scans did not have a scan at 18 weeks. Therefore 19 subjects completed a follow-up MRI at 9-weeks (inulin group: three females and seven males; cellulose group: four females and five males), and 14 subjects completed a follow-up MRI at 18 weeks insulin group: three females, six males; cellulose group: three females and two males). Compliance
On average, ten out of 189 sachets (5 %) were returned at week 18. The breath hydrogen levels increased by 15.0 ± 6.3 ppm (n = 20) in the inulin group vs 2.3 ± 1.6 ppm (n = 19) in the cellulose group at week nine (p = 0.07), a difference which reached significance at week 18 (14.8 ± 3.7 ppm, n = 20 vs 0.19 ± 0.8 ppm, n = 18, p < 0.001). Anthropological outcomes Weight
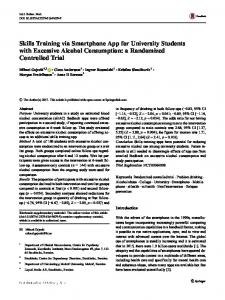
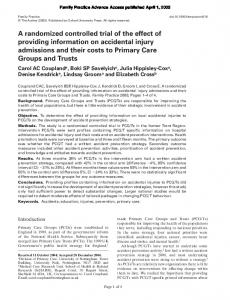
As intended by the study design, both groups lost similar amounts of weight during the weight loss phase (−5.3 ± 0.1 %, n = 20 vs −4.3 ± 0.4 %, n = 19, p = 0.13). Measured as absolute weight loss: −4.6 kg ± 0.6 kg vs −3.61 ± 0.3 kg. However, during the weight maintenance phase (weeks 9–18), the inulin group lost significantly more weight compared to the control (−2.3 ± 0.5 %, n = 20 vs −0.6 ± 0.4 %, n = 18, p = 0.012). Measured as absolute weight loss: −1.8 ± 0.4 kg vs −0.5 ± 0.3 kg (Fig. 2). Body composition
Body fat percent as analysed by BIA at week 9 and 18 showed a greater reduction in the inulin group compared to the cellulose group (−2.8 ± 0.4 %, n = 20 vs −1.2 ± 0.4 %, n = 19, p < 0.01) and (−3.7 ± 0.6 %, n = 20 vs −1.1 ± 0.6 %, n = 18, p = 0.01) respectively (Fig. 2). In the sub-group of subjects who underwent MRI, the percentage body fat measurements at 9-weeks showed a similar trend towards a reduction in body fat (−1.7 ± 0.6 %, n = 10 vs −0.1 ± 0.6 %, n = 9, p = 0.08) although this did not reach statistical significance. The delta change was not different at 18 weeks (−2.4 ± 1.2 %, n = 9 vs −2.2 ± 3.1 %, n = 5, p = 0.93). The delta change in other fat depots was not different at 9 or 18 weeks (Additional file 1). Intrahepato- and intramyocellular lipid
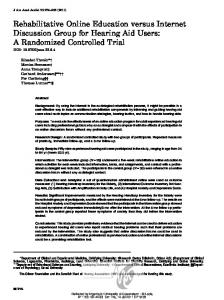
Intrahepatocellular lipid was reduced in the inulin group, and the delta change was significant when compared to the cellulose group at 9 and 18 weeks even after controlling for weight loss (9 weeks: −9.6 ± 2.8 %, n = 10
Guess et al. Nutrition & Metabolism (2015) 12:36
Page 5 of 10
Fig. 2 Percentage weight loss and body fat loss measured by BIA at week nine and week 18 in inulin and cellulose groups. Analysis was done by ANCOVA with baseline weight as a covariate. Weight loss at week nine was not significantly different between inulin and cellulose groups (−5.3 ± 0.1 %, n = 20 vs −4.3 ± 0.4 %, n = 19, p = 0.13). Between weeks 9–18 the inulin group lost significantly more than the cellulose group (−2.3 ± 0.5 %, n = 20 vs −0.6 ± 0.4 %, n = 18, p = 0.012). Analysis for body loss was done by ANCOVA with baseline weight as a covariate. The inulin group lost a greater percentage of body fat as measured by BIA at 9 (−2.8 ± 0.4 %, n = 20 vs −1.2 ± 0.4 %, n = 19, p < 0.01) and 18 weeks (−3.7 ± 0.6 %, n = 20 vs −1.1 ± 0.6 %, n = 18, p = 0.01). ANCOVA: analysis of covariance; BIA: bioelectrical impedance
vs −0.5 ± 2.7 %, n = 9, p < 0.04); (18 weeks: −10.0 ± 2.6 %, n = 9 vs −2.3 ± 2.5 %, n = 5, p = 0.02) (Fig. 3). The fat content of the soleus muscle was also significantly reduced at 9 and 18 weeks (9 weeks: −0.7 ± 0.3 %, n = 10 vs 0.8 ± 0.3 %, n = 9, p < 0.005); (18 weeks: −1.3 ± 1.4 %, n = 9 vs 4.8 ± 3.0 %, n = 5, p < 0.05) (Fig. 4) but not the tibialis muscle (9 weeks: −1.4 ± 1.0 % n = 10 vs −1.0 ± 1.4 %, n = 9, p = 0.82); (18 weeks: −2.2 ± 0.8 %, n = 9 vs −2.5 ± 2.7 %, n = 5, p = 0.93).
There was no difference in tAUC for the question “How much do you think you could eat right now?” (prospective food consumption) at week nine (−62.9 ± 58.2, n = 20 vs −117.8 ± 44.2, n = 19, p = 0.46) but subjects in the cellulose reported significantly greater tAUC for the prospective food consumption question than the inulin group at week 18 (4.5 ± 37.9, n = 20 vs 774.5 ± 86.97, n = 18) p =