bs_bs_banner
Austral Entomology (2018) 57, 220–227
A rapid, precise and low-cost method to quantify silicon for the determination of food intake and utilisation for insect herbivores Fiona J Clissold,1*
Ximonie Clark,1 Tom Savage2 and Stephen J Simpson1
1
School of Life and Environmental Sciences, Charles Perkins Centre, The University of Sydney, Sydney, NSW 2006, Australia. School of Geosciences, The University of Sydney, Sydney, NSW 2006, Australia.
2
Abstract
Determining intake and subsequent digestion and absorption of nutrients is fundamental for understanding host plant quality for insect herbivores. This typically involves considerable time spent weighing leaf material, with various associated sources of error and inaccuracy. Biomarker techniques based on silicon (Si) for estimating food intake and utilisation are well described, but rarely used, because there is no standard technique to either extract or quantify Si, there is a lack of congruence regarding the efficacy of existing techniques, and these techniques rely on large sample sizes, slow and laborious procedures, highly hazardous chemicals and/or expensive specialized equipment. To determine Si in milligram plant and faecal samples, we adapted the molybdenum blue assay to a microplate technique. This assay determines silicon (Si in 2% NaOH) over the range 0.3–1.5 μg Si/0.18 mL (1.7–8.3 μg/mL) and was able to detect changes of 1.0 × 10 9 g Si. Four of the most commonly used digestion techniques were compared, and we found that a technique based on the autoclave-induced digestion method allowed the rapid and precise extraction and determination of silicon found in concentrations greater than 0.001% from ca. 2.5 mg of dry ground leaf material, a level of precision that far exceeds the 0.1–10% that silicon typically contributes to dry leaf matter. Using silicon as a biomarker reduced the weighing effort involved in traditional gravimetry by up to 95% and improved the precision (±SE) of estimates of food utilisation. Both the extraction and quantification steps require relatively inexpensive equipment that is available in most laboratories, uses micromasses of plant material and chemicals and is amenable to automation and high-throughput processing.
Key words
gravimetry, herbivory, host plant quality, plant–herbivore dynamics.
I N T R O DU C T I O N Terrestrial biodiversity is dominated by plants and the animals that eat them, an evolutionary relationship that is more than 350 million years old. Over this time, plants have gained a plethora of defensive traits to limit leaf loss (e.g. Agrawal 2011; Mithofer & Boland 2012) and reduce insect fitness (e.g. Awmack & Leather 2002; Leather 1994; Scriber & Slansky 1981; Wetzel et al. 2016). Increasingly, it is being understood that the continued arms race between plants and their herbivores has resulted in complex interactions that require detailed mechanistic understanding and cannot be explained by simple correlative models (e.g. Agrawal & Weber 2015; Carmona et al. 2011; Loranger et al. 2012). For example, neither the concentration of specific nutrients in a leaf (typically leaf nitrogen) or the amount of a given plant secondary metabolite (PSM) are predictive of herbivore performance or leaf area removed (e.g. Berner et al. 2005; Carmona et al. 2011; Fischer & Fiedler 2000; Loranger et al. 2012; Pearse 2011). Central to gaining a mechanistic understanding of the relationship between plant quality and herbivore performance is the need to measure the intake and post-ingestive utilisation of natural plant material. Current techniques are based on gravimetry which involves weighing leaves daily, which is both *fi
[email protected] Conflict of interest: We declare no conflicts of interest. © 2018 Australian Entomological Society
tedious and incredibly time consuming. For example, 60 grasshoppers fed for the duration of their last nymphal stadium (typically 8 days) involves 1520 weighing events, each taking ca. 1 min, equates to ca. 25 h (8 days × (10 control samples + 60 leaf samples + 60 remaining food + 60 faeces)). Also, any gravimetric measure of intake relies on the imperfections of estimating initial dry mass of samples from their wet mass (van Loon et al. 2005). The use of silicon (Si) as a biomarker has the potential to address these limitations of gravimetry. As Si is indigestible to most animals and is found in all terrestrial plants in varying amounts from 0.1 to 10% of shoot dry weight (Epstein 1999; Hodson et al. 2005), it can be used as a marker to determine intake (Barbehenn 1993; Kogan 1986; Waldbauer 1968), a technique that is well described but is rarely used (Hare 1998), at least in part because assays to determine Si require large amounts of leaf and faecal material and/or expensive equipment (Liang et al. 2015). Also, despite increasing interest in Si across multiple disciplines, there is as yet no universally accepted test for determining Si in plant tissues, nor is there any consensus on the efficacy of available techniques (e.g. Liang et al. 2015). Analysis of reference plants (National Institute of Standards and Technology) has yielded Si concentrations for these samples that differ by up to 350% (Bell & Simmons 1997; Hogendorp et al. 2011; Le Blond et al. 2011; Taber et al. 2002) with the added complication that these differences are plant species specific (e.g. Haysom & Ostatek-Boczynski 2006 and references therein). doi: 10.1111/aen.12335
Silicon quantification at the leaf level Our research is focussed on grasshoppers and grasslands, which are characterized by having numerous grass and herbaceous species, most of which have very small leaves, with dry weight averaging ca. 25 mg per leaf (range 4–68 mg; unpublished data). Current wet digestion Si techniques require between 100 and 500 mg. Although X-ray fluorescence spectroscopy initially appeared promising as Si is determined non-destructively, and thus, the plant material could be used in other analyses, when describing the potential of this method (Reidinger et al. 2012), sample sizes of 700 mg were used, a 30 plus-fold difference in the mass we use to conduct all our analyses (ca. 20 mg to determine protein (PROT) and soluble carbohydrate (CARB)) (e.g. Clissold et al. 2010). Thus, we required a method of determining Si rapidly from very small masses ( 0.06) (Fig. 1c). This corresponds to 0.02% Si for a 5 mg sample of plant material.
Silicon determination: optimising extraction conditions
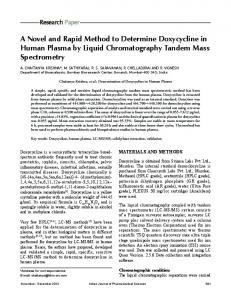
extracted all the Si mixed within the cellulose spiked matrix (SiM) (ANCOVA: F3,20 = 0.43, P = 0.657), where SiM = 0.99 × SiAF + 0.06 (r2 = 0.99, F1,22 = 5,470.52, P < 0.001) (Fig. 2b). To investigate the repeatability and evaluate the precision of each method, the coefficient of variation (standard deviation/mean) for each extraction technique was compared. Levene’s test (F = 3.29, P = 0.025) showed that the variation was different across the methods. Box plots of these values indicated that method 1(i) showed less variation, compared with the other methods (Fig. 2c). Unlike that of Krask and Breitenbeck (2010) who found that the addition of even a small amount of NH4F increased the amount of Si detected by the MBSA, we could not detect a difference (Fig. 2b). While we did not find any difference in the amount of Si determined by any of the tests, for future Si determination, we chose to use method 1(i), the AID method with modifications (Elliott & Snyder 1991; Kraska & Breitenbeck 2010) as it consistently recorded slightly higher Si values and had the highest precision (Fig. 2c).
Comparison of methods and validation
The relationship between Si solubilized from SiO2 (#S5631, Sigma-Aldrich) using AF (SiAF) and the certified silicon standard (SiC) (#16259, Fluka) was SiAF = 0.978 SiC + 0.008 (r2 = 0.999) (Fig. 2a). We used this relationship to set the amount of Si for all further analyses. Although the plant and faecal samples contained different amounts of Si (nested ANOVA: F32,72 = 291.95, P < 0.001), no significant difference was found between the methods used to quantify the amount of Si (Fig. 2b) (nested ANOVA: F3,72 = 0.05, P = 0.984). For method 1ii, the time the plant and faecal samples were autoclaved did not alter the amount of Si quantified (20 min: 2.06 ± 0.37% and 60 min: 2.11 ± 0.41%; paired t-test: P = 0.404). The AID methods and OID method © 2018 Australian Entomological Society
Optimisation of solvent volume and mass
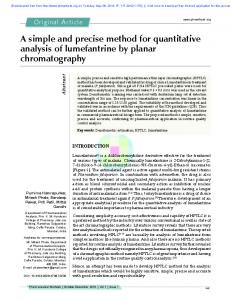
The percentage of Si extracted from 3.5 ± 0.09 mg samples of either plant or faeces was not affected by solvent volume (mean ± SE; F5,12 = 0.86, P = 0.533) (Fig. 3a). We found no significant difference between the amounts of Si extracted from 2 to 8 mg (Tukey’s post hoc test P > 0.99) of T. triandra; however, significantly less Si was found for a 10 mg sample (F4,10 = 15.17, P < 0.001) (Fig. 3b), presumably because there was insufficient solvent (50% NaOH) to solubilize all the Si. The results from both experiments suggest the ratio of solvent (50% NaOH)/solute (sample containing up to 2% Si) should be at least 7.5. Thus, we suggest using sample masses between 2 and 8 mg with 100 μL 50% NaOH (w/v) with the AID technique 1(i).
Silicon quantification at the leaf level
225
(a) 3.5 Method
1i
1iii
1ii
P = 0.984
2
Silicon (%)
3.0 2.5 2.0 1.5 1.0 0.5 0.0 1
2
3
4
5
6
7
trees
8
9
10
11
herbs
12
13
monocots
Sample
(b)
(c) 0.1 8
12
P < 0.001
Coefficient of variation
Measured percentage silicon
0.1 6 10 8 6 4
0.1 4 0.1 2 0.1 0 0.0 8 0.0 6 0.0 4
2 0.0 2 0 0
2
4
6
8
10
12
0.0 0 1i
1ii
Silicon in cellulose matrix
1iii
2
Method
Fig. 2. (a) Bar graph showing the relationship between the four extraction methods for 13 different plant and faecal samples. Refer to materials and methods section for the explanation of each method. 1 = NCS ZC, 2 = Bauhinia variegate, 3 = Cinnamomum verun, 4 = Macadamia integrifolia, 5 = Pinus radiata, 6 = Sonchus sp., 7 = Taraxacum officinale, 8 = Mentha spicata, 9 = Tradescantia sp., 10 = Avena sativa, 11 = Astrebla lappacea, 12 = Themeda triandra, 13 = faeces. No difference in the Si extracted was found between methods (P = 0.984). (b) Comparison between the known amount of Si in the SiO2–cellulose mix and that measured using the AID and OID extraction methods. The dotted line shows the 1:1 relationship, and the dashed lines are for the 95% confidence interval around the regression line (not shown). Regardless of the method, all the Si from the SiO2–cellulose mix (SiM) was digested. Combining the values obtained from each test (SiM = 0.99 × SiAF + 0.06 (r2 = 0.99, F1,5 = 5367.6, P < 0.001)). Values are the mean ± SE calculated from the value for that Si dilution from each extraction assay (where n = 3 samples per assay per dilution). Values are the mean ± SE (where n = 3). (c) Box plots of the coefficients of variation from the samples reported in (a) and (b). [Colour figure can be viewed at wileyonlinelibrary.com]
(a)
(b) 1.9 P < 0.001
P = 0.533 1.8
a
a
a
a
1.0 Silicon (%)
Silicon (%)
1.7
0.8
b
1.6 1.5 1.4
0.6
0.0
0.0 0
50 100 150 Volume of NaOH (µL)
200
2.0
4.0
6.0 8.0 Sample (mg)
10.0
Fig. 3. (a) The effect of the volume of 50% NaOH (w/v) on the amount of Si extracted from 3.5 ± 0.09 mg (mean ± SE; F5,12 = 1.50, P = 0.262) samples of finely ground leaf material (n = 3 per volume). (b) The effect of varying masses of finely ground leaf material extracted with 50 μL of 50% NaOH on the percentage of Si measured (n = 3 per volume). Values are mean ± SE, and means with different letters are different (P < 0.05). © 2018 Australian Entomological Society
226
F J Clissold et al. 3.0
Sample size and sampling
Comparison of ingestion values determined via wet/dry weight ratios and silica/dry weight ratios Silicon was not absorbed (99.4 ± 0.1% of Si recovered) by either locust species regardless of diet or sex (t = 0.599, df = 23, P = 0.555). No difference was found in estimated intake between the three methods used (F2,53 = 0.56, P = 0.5738; homogeneity of slopes P = 0.722) (Fig. 5). Although the coefficient of variation (mean/standard deviation) was highest for the gravimetrically derived measure of intake (7.67, 7.33, 6.67 for intake derived gravimetrically, Sicombined and Siday, respectively), these were not statistically different (Levene’s test: F = 0.14, P = 0.868). Nor was any difference found when comparing the variance of the residuals generated from regressions of dry weight against wet weight and dry weight against Si (Levene’s test: F = 0.91, P = 0.751). The gravimetric measure of intake was 2.0% higher than that estimated from the Siday method. Barbehenn (1993) found an extremely similar result (2.4%) using the same estimation of intake for a synthetic diet with a known percentage of Si by larval gypsy moths (Lymantria dispar). Although the use of an inert marker, such as Si, should give a more accurate estimation of intake, we like others (Hare 1998) found that all methods gave similar estimates of intake. However, using Si as a biomarker
2.0
1.5
1.0 0.8
1.0
1.2
1.4
1.6
1.8
2.0
Faeces (g)
Fig. 5. Comparison of the relationship between faecal production by male L. migratoria nymphs over the entire fifth instar and intake calculated using the ‘traditional’ gravimetric measure, and two estimates based on using silicon (Si) as an indigestible marker, Siday and Sicombined. Refer to materials and methods section for details. The insert shows the ANCOVA-adjusted mean intake (±SE) for the three methods (n = 19). No difference was found between the three methods used to determine intake (F2,53 = 1.02, P = 0.573).
2.0
rather than traditional gravimetry increases the precision of the measures of ingestion (and digestion), and significant time is saved not having to weigh leaves when performing feeding assays. Intake determined using the Si biomarker method on a daily basis reduced the weighing effort by 35% (using the initial example, from 1520 to 1120 weighing efforts (480 faeces + 480 (for Si determination) + 80 (Si determination in controls)). Combining the faeces from the entire stadium and using the Si value averaged over the 8 days of the experiment would reduce the weighing effort by a further 90% to 160 weighing events, with no loss of precision to the measurement of intake.
1.8
CO NC LUSI ON
2.2
bootstrapped values mean SE
2.5
Predicted Intake (g)
The 20 samples showed a mean ± SE, of 1.73 ± 0.07. The mean did not change with decreasing sample size, but as expected, the variance around that mean increased (Fig. 4). The standard error was three times more with a sample size of two and double for a sample size of three. As the mean was not altered by the number of subsamples assayed, we subsequently took duplicate faecal and leaf tissue samples as any Si appears to be evenly distributed throughout the sample.
1.6
1.4
0.0 0
5
10
15
20
Number of 2.5 mg samples
Fig. 4. The Si (%) mean ± SE of the original entire sample (20 subsamples) and that estimated by bootstrapping (1000 repetitions, with replacement) of the original 20 samples by taking sample sizes of 2, 3, 5 and 10. © 2018 Australian Entomological Society
Using the technique described in the preceding text, Si can be determined quickly, cheaply and with high precision at the leaf level. Our technique requires relatively inexpensive laboratory equipment (an autoclave and 96-well plate reader) that is available in most chemical laboratories, and both the extraction and quantification techniques use microamounts of plant material and thus chemicals. The final method (1i) uses ca. 50-fold less volume of chemicals than existing extraction techniques, and the MBMSA ca. 250-fold less. Although we were unable to authenticate the final method, we did recover 99% of the Si (as SiO2) in a cellulose mixture. This assay could be used to determine Si from individual leaves and get an understanding of Si both within and between plants because of the sensitivity of the assay (1.7–8.3 μg of Si can be detected).
Silicon quantification at the leaf level When running insect feeding assays using plant material in a laboratory setting, the time savings are considerable (up to 95%). Accurately determining the weight of fresh grass material is quite difficult as detached leaves continue to lose weight (water), and although we have established protocols to minimize the difference between wet weight and the estimated dry matter, the use of a Si as a biomarker improved precision, and potentially accuracy. We hope that the development of this technique will encourage more researchers to ascertain the digestibility of nutrients along with other plant traits such as leaf water, cell wall, Si content and toughness, so that we gain a better understanding of which combination of plant traits influences the efficiency with which chewing insect herbivores can digest the available nutrients (and any PSM).
ACKNOWLEDGEMENTS We thank Naz Soren for general assistance. S. J. Simpson was supported by an Australian Research Council Laureate Fellowship.
REFERENCES Agrawal AA. 2011. Current trends in the evolutionary ecology of plant defence. Functional Ecology 25, 420–432. Agrawal AA & Weber MG. 2015. On the study of plant defence and herbivory using comparative approaches: how important are secondary plant compounds. Ecology Letters, n/a-n/a. 18, 985–991. Awmack CS & Leather SR. 2002. Host plant quality and fecundity in herbivorous insects. Annual Review of Entomology 47, 817–844. Barbehenn RV. 1993. Silicon: An indigestible marker for measuring food consumption and utilization by insects. Entomologia Experimentalis et Applicata 67, 247–251. Bell PF & Simmons TF. 1997. Silicon concentrations of biological standards. Soil Science Society of America Journal 61, 321–322. Berner D, Blanckenhorn WU & Korner C. 2005. Grasshoppers cope with low host plant quality by compensatory feeding and food selection: N limitation challenged. Oikos 111, 525–533. Carmona D, Lajeunesse MJ & Johnson MTJ. 2011. Plant traits that predict resistance to herbivores. Functional Ecology 25, 358–367. Clissold FJ, Brown ZP & Simpson SJ. 2013. Protein-induced mass increase of the gastrointestinal tract of locusts improves net nutrient uptake via larger meals rather than more efficient nutrient absorption. The Journal of Experimental Biology 216, 329–337. Clissold FJ, Sanson GD & Read J. 2004. Indigestibility of plant cell wall by the Australian plague locust, Chortoicetes terminifera. Entomologia Experimentalis et Applicata 112, 159–168. Elliott CL & Snyder GH. 1991. Autoclave-induced digestion for the colorimetric determination of silicon in rice straw. Journal of Agriculture and Food Chemistry 39, 1118–1119. Epstein E. 1999. Silicon. Annual Review of Plant Physiology and Plant Molecular Biology 50, 641–664. Fischer K & Fiedler K. 2000. Response of the copper butterfly Lycaena tityrus to increased leaf nitrogen in natural food plants: evidence against nitrogen limitation hypothesis. Oecologia 124, 235–241. Fox RL, Silva JA, Plucknett DL & Teranish DY. 1969. Soluble and total silicon in sugarcane. Plant and Soil 30, 81–91.
227
Guntzer F, Keller C & Meunier JD. 2010. Determination of the silicon concentration in plant material using Tiron extraction. New Phytologist 188, 902–906. Hare JD. 1998. Bioassay methods with terrestrial invertebrates. In: Methods in Chemical Ecology. Bioassay Methods (eds KF Haynes & JG Millar), pp. 212–270. Springer, Boston, MA. Haysom MB & Ostatek-Boczynski ZA. 2006. Rapid, wet oxidation procedure for the estimation of silicon in plant tissue. Communications in Soil Science and Plant Analysis 37, 2299–2306. Hodson MJ, White PJ, Mead A & Broadley MR. 2005. Phylogenetic variation in the silicon compostion of plants. Annals of Botany 96, 1027–1046. Hogendorp BK, Swiader JM & Cloyd RA. 2011. Plant alkaline fusion technique followed by colorimetric procedure for the detection and quantification of total silicon in ornamental plants. Communications in Soil Science and Plant Analysis 42, 75–92. Kogan, M. 1986. Bioassays for measuring quality of insect food. In: Insect-Plant Interactions (eds JR Miller & TA Miller), pp. 155–189. Springer-Verlag, New York, Bioassays for Measuring Quality of Insect Food. Kraska JE & Breitenbeck GA. 2010. Simple, robust method for quantifying silicon in plant tissue. Communications in Soil Science and Plant Analysis 41, 2075–2085. Le Blond JS, Strekopytov S, Unsworth C & Williamson BJ. 2011. Testing a new method for quantifying Si in silica-rich biomass using HF in a closed vessel microwave digestion system. Analytical Methods 3, 1752–1758. Leather SR. 1994. Life history traits of insect herbivores in relation to host quality. In: Insect-Plant Interactions (ed EA Bernays). CRC Press Inc, Bota Raton, Florida. Liang Y, Nikolic M, Bélanger R, Gong H & Song A. 2015. History and introduction of silicon research. In: Silicon in Agriculture. From Theory to Practice. Springer, Netherlands. Loranger J, Meyer ST, Shipley B et al. 2012. Predicting invertebrate herbivory from plant traits: evidence from 51 grassland species in experimental monocultures. Ecology 93, 2674–2682. Mithofer A & Boland W. 2012. Plant defense against herbivores: chemical aspects. In: Annual Review of Plant Biology, Vol. 63 (ed SS Merchant), pp. 431–450. Annual Reviews Inc, Palo Alto, CA, USA. Pearse IS. 2011. The role of leaf defensive traits in oaks on the preference and performance of a polyphagous herbivore, Orgyia vetusta. Ecological Entomology 36, 635–642. Reidinger S, Ramsey MH & Hartley SE. 2012. Rapid and accurate analyses of silicon and phosphorus in plants using a portable X-ray fluorescence spectrometer. New Phytologist 195, 699–706. Scriber JM & Slansky F. 1981. The nutritional ecology of immature insects. Annual Review of Entomology 26, 183–211. Simpson SJ & Abisgold JD. 1985. Compensation by locusts for changes in dietary nutrients: behavioural mechanisms. Physiological Entomology 10, 443–452. Taber HG, Shogren D & Lu G. 2002. Extraction of silicon from plant tissue with dilute HCl and HF and measurement by modified inductive coupled argon plasma procedures. Communications in Soil Science and Plant Analysis 33, 1661–1670. van Loon JJA, Casas J & Pincebourde S. 2005. Nutritional ecology of insectplant interactions: persistent handicaps and the need for innovative approaches. Oikos 108, 194–201. Waldbauer GP. 1968. The consumption and utilization of food by insects. Advances in Insect Physiology 5, 229–288. Wei-min D, Ke-qin Z, Bin-wu D et al. 2005. Rapid determination of Silicon content in rice. Rice Science 12, 145–147. Wetzel WC, Kharouba HM, Robinson M, Holyoak M & Karban R. 2016. Variability in plant nutrients reduces insect herbivore performance. Nature 539, 425–427.
Accepted for publication 22 February 2018.
© 2018 Australian Entomological Society