A rate controller for long-lived TCP flows? Peter Dorfinger1 , Christof Brandauer2 , and Ulrich Hofmann2 1
Fachhochschule Salzburg, Schillerstrasse 30, A-5020 Salzburg, Austria
[email protected] 2 Salzburg Research, Jakob Haringer Str. 5/III, A - 5020 Salzburg, Austria {brandauer,hofmann}@salzburgresearch.at
Abstract. In this paper a new mechanism for providing an assured rate to a longlived TCP flow is proposed. The mechanism is called TCP rate controller (TRC) and operates as a traffic conditioner at the edge of a network. The TRC seeks to achieve the requested rate by imposing well directed drops and (artificial) delays on the flow’s packets. The choice of drop probability and delay is based on an analytical model of TCP sending behavior. It is shown in a simulation study that the TRC performs well over a broad range of requested rates and network RTTs. Keywords: Quality of Service, TCP rate control, TCP rate assurance
1
Introduction
In the recent years there has been a growing interest in IP Quality of Service (QoS). New applications that have high requirements on network performance are being developed. Some of those applications, for example video conferencing or IP telephony, require some minimum network quality to be useful at all. From the operator’s point of view it is hoped that services that deliver high QoS can be profitable. Currently, a lot of research work is based on the paradigm of Differentiated Services (DiffServ) [1, 2]. DiffServ seeks to provide QoS in IP networks in a simple and scalable fashion. It is tried to remove complex tasks from the core and shift them to the edges of the network instead. As an example, traffic controllers that operate on single flows are only acceptable at the ingress/egress of a DiffServ domain. The focus of this paper is on the topic of rate assurance for TCP flows. Given that TCP is the number one transport protocol [3] in today’s Internet, we believe that such a service could be of interest. The topic of assuring TCP rates has been investigated in several other publications, e.g. [4–6]. The goal of this work is to develop a traffic conditioning mechanism that can be used to assure a certain level of goodput to long-lived TCP flows. The proposed conditioner could be used in a DiffServ network to enable such a service class. We propose a TCP rate controller (TRC) that regulates the goodput of a TCP flow by controlling packet drops and the round trip time (RTT) of the flow’s packets. The TRC is based on a model of TCP sending behavior. ?
The authors are funded by the IST project AQUILA by contract IST-1999-10077
(c) Copyright Springer-Verlag
The remainder of this paper is organized as follows: Section 2 discusses related work. Section 3 summarizes the essential network environment for the TRC. The TRC is described in Section 4. Exemplary simulation results for a variety of network parameter settings are presented in Section 5. Section 6 concludes the paper.
2
Related Work
The Capped Leaky Bucket (CLB) as proposed in [6] is an improved Leaky Bucket traffic conditioner. To take the behavior of TCP into account it is tried to estimate the RTT by measuring the time between two bursts. If the input rate is higher than the target rate one packet each two RTTs is marked as out-profile. Simulations in [6] show performance that is not appropriate to give assurances and a bias against big reservations. In [4] equations how to set the parameters of a token bucket marker for achieving a requested rate are proposed. The parameter setting depends on the requested rate (Rreq ), drop probability of out-profile packets (p2 ) and the RT T . With the equations in [4] it is possible to make correct goodput assumptions for a known value of RT T and p2 . But the crucial aspect in the application of this model is that the RT T and p2 are not constant for different connections and also strongly vary over time due to changes in the level of congestion. We therefore believe that it is very difficult, if not impossible, to assure TCP rates by employing a token bucket marker that is configured with a static parameter set. A very interesting adaptive marking algorithm has been proposed recently in [5].
3
Network Environment
The TCP rate controller essentially requires some conditions from the network. The first aspect is that at the network edge the TRC must exclusively control single longlived TCP flows that are not multiplexed with a different kind of traffic (e.g. short-lived TCP flows or UDP flows) [7]. Second, some kind of admission control framework must ensure that the sum of requested rates over all accepted reservations is in fact available. This condition provides an over-provisioned network. Further the used code-point can be different in different domains. In the core netowkr the traffic can be multiplexed with any kind of traffic, but it has to be ensured that drop probability (p) is zero and the network RT T (RT Tnet ) is known and nearly constant. The TRC does not need any special queue management mechanism, because no packet should be dropped in the network. It has to be established that a few packets can be buffered in the queue. The receiver window has to be larger than the maximum congestion window (Wmax ) otherwise the achieved rate will be controlled by the receiver and not by the TRC. Further also TCP’s Slow Start threshold (ssthresh) should be larger than Wmax otherwise the performance during Slow Start will be worse. The TRC has to be placed at the ingress point of the network. Rate controlling has to be done on a per-flow basis, therefore every flow has to be extracted from an aggregate. Only one TRC can be applied to one flow, because if two TRCs are working on the same flow two times the packets needed to control the flow are dropped.
It has to be ensured that from the receiver to the sender there is no congestion, because RT Tnet is assumed to be small and constant. Consequently also ACKs have to be marked with the same code-point than packets from the sender to the receiver.
4 TCP rate controller 4.1
Goal of the TRC
The goal of the TRC is it to provide the TCP sender with a goodput that was requested (by some means of QoS request) in a prior step. The TRC tries to achieve that goal by imposing well directed drops and delays on the flow’s packets. The choice of drop probability p and (artificial) delay RT TT RC is based on an analytical model of TCP sending behavior. We performed our study using the well-known ns-2 simulator, version 2.1b6, and realized that existing TCP models [8, 9] do not accurately predict the sending behavior of the TCP SACK implementation we used. In order to exclude errors in the TCP model and to focus on the feasibility of the TRC approach itself, we derived our own model which describes the TCP sending behavior by equations 1-4. 5 Wmax + 2 2
(1)
3 5 1 = ∗ Wmax 2 + ∗ Wmax − 2 p 8 4
(2)
time per cycle = data per cycle =
Wavg =
data per cycle == time per cycle
3 8
∗ Wmax 2 + 5 2
+
5 4 ∗ Wmax Wmax 2
−2
(3)
Wavg ∗ M SS (4) RT T Thus the sending rate (BW ) of the TCP sender depends on the average congestion window (Wavg ) multiplied with the maximum segment size (M SS) divided by the RT T . The TCP model does not need to take into account timeouts, because losses are exclusively controlled by the TRC and do not force any timeout. From Equation 2 and 3 it is obvious that Wmax and thus Wavg only depend on p and that RT T does not influence Wmax . BW =
4.2
Principal idea of the TCP rate controller
Now, the basic idea of the TRC is that by controlling the amount of dropped packets and the RTT, the rate of the TCP flow can be pruned to the requested rate. The simple algorithm that has to be executed upon each packet arrival is shown in pseudo code in Figure 1. The TRC drops packets at the network ingress and thereby enforces the rate of the TCP flow to oscillate around the requested level. Consequently, assuming proper functioning of the resource control framework, TRC-controlled flows experience no
for each packet arrival: if (packets since drop >= 1/p + E) drop packet else delay packet for RT TT RC Fig. 1. Pseudo-code for each packet arrival
sustained congestion but merely small and transient queuing delays inside the network. Therefore, the RT T is mainly comprised by RT Tnet and can thus be well estimated. Besides dropping, the TRC can add an (artificial) delay RT TT RC in order to control the achieved rate of the TCP flow. The total RT T can then be approximated as the sum of RT Tnet and RT TT RC . Consequently for a known value of RT Tnet the TRC exclusively controls p and RT T . Based on the underlying TCP model the TRC is thus able to make correct assumptions of the achieved rate of a TCP connection. For a given requested rate there exist several combinations of p and RT T which achieve the same rate. The tradeoffs in the choice of the two parameters are discussed in Section 4.3. The term E in Figure 1 is used to compensate the drop in the last cycle and has a value of 1. The TRC can however be equally operated in ECN mode which means that packets are not dropped but marked instead. In that case, the term E has a value of 0.
4.3
Tradeoffs in Parameter setting for each request
It has to be ensured that after a drop there are enough packets in the network to receive three duplicate acknowledgements and trigger further packet transmissions during fast retransmit. Therefore the maximum window Wmax has to be at least 5 packets (1 loss, 3 duplicate ACK, 1 to trigger further transmissions). Clearly, the accuracy of the TRC is mainly influenced by the ability of the TCP model to accurately predict the flow’s sending behavior. The deviation between the model’s prediction and the real sending rate increases with the drop probability. A Wmax of 5 corresponds to a drop probability of 0.0735; we have seen that any p greater than this value results in unacceptably large deviations from the model. Even for some values smaller than 0.0735 (and thus Wmax larger than 5) we noticed significant deviations in the ns-2 simulations. We tried to find values for p such that the corresponding Wmax achieves at least the rate that’s estimated by the model. We found that if Wmax is set as an even number plus 0.5 this condition is fulfilled and that the achieved rate is at most 3% higher than estimated. The second parameter which can be tuned is the RT TT RC and consequently the RT T . As explained above there exist a lot of combinations of setting p and RT T to achieve a requested rate. One choice would be to fix p so that Wmax is 6.5 and enable different requested rates by imposing different packet delays inside the TRC. This would mean that the greater the requested rate the smaller the RT T would be. For big
requests this could lead to the problem that i) small deviations in RT Tnet have a significant influence on the achieved goodput see Section 5.4 for details or ii) that RT Tnet is even greater than the total RT T should be. To avoid this, a lower bound for the RTT, called RT Tmin , has to be fixed. If the required RT T (RT Treq ) is smaller than RT Tmin the next greater value of Wmax , i.e. Wmax + 2 as discussed above, has to be used. To impose a delay of RT TT RC , packets have to be stored in a buffer. The greater the delay for the same rate the greater must the buffer be. Thus on the one hand the delay should be kept high to keep the influence of a deviation the RT T small; on the other hand the delay should be kept small to keep buffer requirements low. This is a tradeoff that an operator must take into account when choosing RT T and p for a requested rate. It will be further discussed in the next section. Figure 2 shows the pseudo code of the algorithm that computes p and RT TT RC upon each request.
for each request: ∗ set RT Tmin min(RT Tmin , RT Tnet ) calculate RT Treq for Wmax = 6.5 if RT Treq > RT Tmin set drop probability to achieve Wmax of 6.5 set RT TT RC to (RT T − RT Tnet ) else set RT T to RT Tmin calculate an appropriate Wmax recalculate RT T based on appropriate Wmax set drop probability to achieve appropriate Wmax set RT TT RC to (RT T − RT Tnet ) Fig. 2. Pseudo-code for parameter computation
4.4
Tradeoffs in network parameter configuration
An operator has to provide two parameters for the initial configuration of the TRC. One is called RT Tdev and denotes an operator’s estimate on the maximum deviation between RT Tnet and the real RTT. The second one is called gputerror which is the error in the achieved goodput that should be compensated by the TRC. In order to be on the safe side, the rate that is requested by the user is increased by gputerror + 1 percent. The smaller RT Tdev , the smaller is RT TT RC and thus the smaller the buffer can be. On the other hand, if RT Tdev is high, this requires a large buffer space due to the high RT TT RC . Due to the bursty sending behavior of TCP sources a few packets will be queued at the bottleneck leading to a slight variance in RTT. This occurs especially in high load scenarios. Consequently, RT Tdev can generally not be zero. ∗ Equation 5 can be used for determining RT Tmin . As an example assume that a 5% error in the achieved rate is taken into account for TRC configuration and the error in
∗ the RTT estimation is not greater than 10ms. In that case RT Tmin would be 200ms. ∗ Throughout the rest of the paper this value is used for RT Tmin . ∗ RT Tmin =
RT Tdev gputerror
(5)
Thus lower bounds for drop probability and for delay are fixed. The other aspect which has to be taken under consideration is the buffer size needed by each connection. The higher the requested rate and the higher the delay the higher the demand of buffer is. The buffer has to be able to store ceil(Wmax ) packets from each flow. To keep RT Tdev small not the whole available bandwidth can be sold. We propose that the network is over-provisioned by some amount. In our case using ns-2 it should be over-provisioned by at least 6%. Further the maximum error of the TCP model which is 3% has to be taken into account. To compensate a RT Tdev of 5% the achieved goodput is increased by 6%. The sum of requested rates has to be smaller than ρ ∗ BW . Where ρ for the above case must not be greater than 0.85 (6% over-provisioned, 3% TCP model error and 6% compensate RT Tdev ). In the core network the queue has to be able to store at least one half of the maximum window of the largest possible request. Because during Slow Start packets at the queue are arriving in a burst with a rate that is twice the bandwidth of the bottleneck. Further a few packets have to be stored when a burst of packets from two or more connections arrives at the same time. It is proposed that the buffer size is 50 packets plus one half of the largest Wmax . This is a topic of further research.
for each network: ∗ set RT Tmin to RT Tdev /gputerror set rate_increase to gputerror + 1% Fig. 3. Pseudo-code for initial configuration
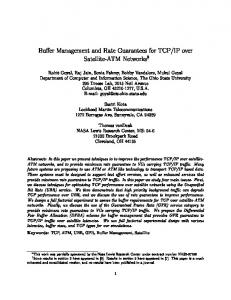
Figure 3 shows the pseudo code of the initial parameterization of the TRC done by each operator. Figure 4 shows examples how to set p and RT TT RC for Rreq between 50kbps and 600kbps. RT Tnet is assumed to be zero and RT Tdev is assumed to be 10ms. RT Tmin is set to 200ms. 4.5
Control of Slow Start
Despite the TRC is designed for long-lived TCP flows the Slow Start phase can not be neglected in general. We try to control the Slow Start phase such that the achieved goodput is not significantly lower or higher than during congestion avoidance. At the beginning of Slow Start the window is small. This results in low goodput which has influence on the overall achieved goodput. If the connection stays too long in Slow Start the window will increase significantly above Wmax . This will have the effect that there is more traffic in the network than estimated and packets of all other TRC-controlled connections might be dropped. Dropping packets inside the network would destroy the
"RTT" "p"
RTT
0.05 0.045
0.8
0.04
0.7
0.035
0.6
0.03
0.5
0.025
0.4
0.02
0.3
0.015
0.2
0.01
0.1 100
200
300 400 requested rate [kbps]
500
drop probability
1 0.9
0.005 600
Fig. 4. Exemplary setting of p and RT TT RC based on Rreq
whole concept because drops would then be no longer exclusively controlled by the TRC. Consequently an appropriate parameter setting for Slow Start would be to control packet losses so that the window does not exceed Wmax . The RT T has to be controlled such that as long as the congestion window is smaller than Wmax /2 the TCP sender sends with a constant rate which equals the requested rate. Analyzing the window behavior during Slow Start shows that when f loor(Wmax ) packets are forwarded and then one packet is dropped the window will be ceil(Wmax ) when the loss is detected. Therefore the buffer for delaying packets has to be able to store ceil(Wmax ) packets. If both algorithms work adequately then the Slow Start phase does not significantly influence a connection’s performance. This theoretical approach has some restrictions: first, it is not possible to reduce the RT T below RT Tnet and for small windows it may thus be impossible to achieve the requested rate. Nevertheless this approach of controlling the Slow Start phase is superior to an approach where the Slow Start phase is not particularly taken care of. Second, the influence of the retransmission timeout (RTO) during Slow Start has to be evaluated, because the RT TT RC is increased over time. And thus during Slow Start phase a RTO may occur yielding to a retransmit and a congestion window of one segment. Consequently the rate during Slow Start will be smaller than estimated and thus may influence the overall goodput. This is left for further study. When Slow Start is taken into account the code executed for each packet arrival is slightly modified and can be found in Figure 5.
5 5.1
Simulation study Simulation Topology
The behavior of the TCP rate controller is studied by means of network simulations using ns-2 [10]. The simulations were run on a simple dump-bell topology shown in Figure 6(a). FTP senders start sending data from hosts S1-Sn at a random point of time within the first 10 seconds to hosts R1-R5. The bottleneck bandwidth, access delay and requested rate of the TCP senders are varied for the different scenarios to evaluate different effects. Both routers are using a DropTail queue. Traffic conditioning is done by
init_slowstart=1; for each packet arrival if init_slowstart //connection is in early Slow Start phase if packets since drop >= Wmax drop packet init_slowstart=0 else queue packet to achieve requested rate else code like during congestion avoidance Fig. 5. Pseudo-code of TRC with Slow Start
the TRC on a per-flow basis at each sending host. Unless noted otherwise, simulations last for 1100 seconds where the first 100 seconds are not taken into consideration for the statistics. The purpose of the simulation study is it to investigate over a broad range of scenarios to what extent the TRC is able to provide TCP rate assurances. Especially the effect of a mixture of different RTTs and requested rates under maximum load is analyzed. All simulations are run with and without ECN showing equal results.
1.03
"Estimation" "Simulation"
R1
S1 S2
router 0
router 1
R2 R3
Sn
x Mbps, x = 2, 10, 50, 200 0.5 ms 200 Mbps y ms, y=0.5,1.5,4,14,24,34,49,124,249ms
R4
normalized achieved goodput
1.025 1.02 1.015 1.01 1.005
R5 1 0.995
200 Mbps 0.5ms
100
(a) Simulation topology
1000 requested rate [kbps]
10000
(b) Simulation results for exact parameter setting
Fig. 6. Simulation topology and first results
5.2
Performance evaluation for RT Tdev = 0
In this section we demonstrate that for an exact knowledge of RT Tnet the TRC is able to give goodput assurances for a wide range of requested rates. Simulations are run on a 200Mbps bottleneck link so that queuing delay can be neglected. All links have a delay of 0.5ms consequently RT Tnet is 3ms. The requested rates vary between 50 – 104 kbps.
Figure 6(b) shows the normalized achieved goodput over the requested rate. Each flow achieves at least the requested rate. The maximum deviation between simulation and estimation is about 3%. 5.3 Slow Start behavior This section provides simulation results for evaluation of the mechanism introduced to control the Slow Start phase. Simulations are run on the topology shown in Figure 6(a) where all links have a capacity of 200Mbps and a delay of 0.5ms. Simulations are run until the second drop is detected by the sending host. This is chosen for two main reasons. On the one hand the transition from control of Slow Start to Congestion Avoidance should be shown. On the other hand if simulations were stopped after Slow Start only a few packets were transmitted. There are three packets (triggering 3 dupACKs) that have already arrived at the receiver but were not taken into account for statistics, because they are not acknowledged. These packets have great influence on the achieved goodput. The more packets are transmitted the smaller the influence will be. Figure 7(a) shows normalized achieved goodput for several requested rates. A few earlier discussed effects can be seen in this graphs. The marks in the lower left corner are flows that had a RTO during Slow Start because increasing the RT TT RC during Slow Start does not take into account the value of the RTO. The marks above the estimated goodput come from the effect that for moderate loss rates the achieved goodput is underestimated by about 3%. Simulation results providing values between 0.98 and 1 show the influence of mainly two aspects. The one is that the three packets arrived at the receiver but not yet acknowledged ones, have influence on the achieved goodput. The second aspect is that for a large W in the early phase of Slow Start with small congestion window it is not possible to reduce the RTT so far that the requested rate is achieved. If RT Tnet increases the achieved rate during Slow Start will decrease.
1.01
1.1
1.05 normalized achieved goodput
normalized achieved goodput
1 0.99 0.98 0.97 0.96
1
0.95
0.9
0.85
0.95 "Estimation" "Simulation"
0.94 100
1000
0.8 10000
"Est." "0ms" "+5ms" "+10ms" "+15ms" "+20ms" "+30ms" "-5ms" "-10ms" 100
requested rate [kbps]
1000
10000
requested rate [kbps]
(a) Simulation Results during Slow Start
(b) Simulation results for deviations in RTT
Fig. 7. Simulation results
5.4
Simulations with RT Tdev greater than 0
Simulation results in this section should show the influence of a deviation in the RTT on the achieved goodput. Simulations were run on a 200Mbps bottleneck link consequently the queuing delay can be neglected. The access delay is varied to achieve different deviations. The TRC is configured with an RT Tmin of 200ms. The parameters of the TRC are not adapted to compensate the RT Tdev . Figure 7(b) shows the normalized achieved goodput over different requested rates for a few RT Tdev . RT Tmin has direct influence on the goodput error for big requests. For an error of 10ms and a RT Tmin of 200ms the deviation for big requests is 5%. For small requests the influence is smaller, because small requests have a much higher RTT than RT Tmin . The maximum deviation between simulation results with no RTT error and with RTT error can be approximated by RT Tdev /RT Tmin . 5.5
Simulations under maximum load
This section provides simulation results for maximum load scenarios. The network parameters were set according to Section 4.3 which means that ρ is set to 0.85. The bottleneck bandwidth is set to 2Mbps, 10Mbps and 50Mbps respectively. The access delay is varied to achieve the desired network behavior. Simulations are run 100 times. The first simulation study should analyze if the TRC has some bias against Rreq . For evaluating the influence of requested rates the RTT is homogeneous and varied for different scenarios. Simulations are run for an access delay of 0.5, 1.5, 4, 24, 49, 124, 249ms. The requested rates are varied from 50kbps up to 10Mbps within one scenario. Table 1 provides simulation results for several selected scenarios. Each line shows results from one scenario. It can be seen that there is no bias against big requests. All flows achieve the requested rate. The rate of a TCP sender is in general heavily influenced by the RTT. Flows with lower RTT are more aggressive. For evaluating the influence of different RTTs the access delays for link S1 router0 is set to 0.5ms up to 249ms for link S7 router0. Table 2 shows simulation results for different RTTs. It can be seen that the TCP flows achieve nearly the same rate. Thus, the achieved rate of a TRC policed TCP flow has no bias against any RTT and the TRC is able to provide goodput assurances for a wide range of RTTs. Further simulations are run to evaluate the influence of mixed RTTs and mixed Rreq . Therefore the bottleneck bandwidth is set to 50Mbps. Table 3 shows simulation results where the parameters are set so that the higher the target rate the higher the RTT and Table 4 for a parameter setting where the higher the target rate the lower the RTT. Each combination of requested rate and RTT achieves the requested rate.
6
Conclusion
In this paper a TCP rate controller (TRC) is proposed. The TRC seeks to achieve goodput assurances for long-lived TCP flows.
1.5 124
50
50
100 [kbps] 105.64 105.633-105.647 106.353 106.345-106.361 106.238 106.23-106.246 107.234 107.217-107.251 108.055 108.037-108.073
50
10
10
500 [kbps] 517.38 517.348-517.412 526.374 526.343-526.405 525.35 525.316-525.384 533.844 533.690-533.998 532.422 532.195-532.649
750 [kbps] X X 786.818 786.756-786.88 787.662 787.6-787.724 799.138 798.9-799.376 798.072 797.839-798.305
4ms [kbps] 105.225 105.172-105.278 107.257 107.171-107.343 1048.21 1047.69-1048.73 105.547 99.899-111.195
24ms [kbps] 105.225 105.172-105.278 107.256 107-170-107.342 1048.19 1047.68-1048.7 105.546 99.898-111.194
49ms [kbps] 105.222 105.169-105275 107.254 107.168-107.340 1048.21 1047.7-1048.72 105.546 99.898-111.194
Table 3. Simulation results (The higher the requested rate, the higher the RTT)
1.5ms [kbps] 105.225 105.172-105.278 107.256 107.170-107.342 1048.22 1047.7-1048.74 105.546 99.898-111-194
124ms [kbps] 105.217 105.165-105.269 107.249 107.163-107.335 1049.13 1048.52-1049.74 105.538 99.890-111.186
249ms [kbps] 106.601 106.566-106.636 108.101 107.998-108.204 1052.94 1052.06-1053.82 106.301 100.612-111.190
1000 2500 5000 10000 [kbps] [kbps] [kbps] [kbps] 1024.87 X X X 1024.81-1024.93 X X X 1043.61 X 5156.98 X 1043.53-1043.69 X 5156.4-5157.56 X 1047.22 X 5179.03 X 1047.14-1047.3 X 5178.28-5179.78 X 1063.5 2638.91 5261.22 10495.9 1063.18-1063.82 2638.08-2639.74 5259.42-5263.02 1049.24-10499.4 1061.36 2639 5263.32 10504.5 1061.07-1061.65 2638.23-2639.77 5261.77-5264.87 10500.8-10508.2
Table 2. Simulation results for different RTTs
250 [kbps] X X 265.035 265.019-265.051 266.73 266.716-266.744 268.824 268.753-268.895 270.198 270.133-270.263
0.5ms [kbps] 105.231 105.179-105.283 100 107.263 107.176-107.350 1000 1048.22 1047.7-1048.74 100 105.55 99.901-111.198
BW Rr eq [Mbps] [kbps] 2 100
50 [kbps] 53.229 53.222-53.237 53.518 53.516-53.519 53.475 53.472-53.478 53.746 53.743-53.75 53.718 53.713-53723
50k 100k 250k 500k 750k 1M 2.5M 5M 10M 500ms 250ms 100ms 70ms 50ms 30ms 10ms 5ms 3ms achieved 53.715 107.22 268.794 533.786 799.047 1063.37 2638.58 5260.43 10494.9 rate [kbps] 53.711-53.720 107.2-107-24 268.705-268.883 533.592-533.98 798.751-799.343 1062.97-1063.77 2637.53-2639.63 5258.21-5262.65 10491.2-10498.6
scenario
Table 4. Simulation results (The higher the requested rate, the lower the RTT)
50k 100k 250k 500k 750k 1M 2.5M 5M 10M 3ms 5ms 10ms 30ms 50ms 70ms 100ms 250ms 500ms achieved 53.719 107.115 268.21 532.809 797.508 1061.19 2631.05 5256.47 10337.9 rate [kbps] 53.712-53.725 107.086-107.144 268.078-268.342 532.531-533.087 797.078-797.938 1060.62-1061.76 2629.49-2632.61 5252.28-5260.66 10270.3-10405.5
124
10
scenario
1.5
10
BW delay [Mbps] [ms] 2 1.5
Table 1. Simulation results for different requested rates
The task of the TRC is it to control the achieved goodput of a TCP connection by controlling a connections RT T and p. The TRC is based on a TCP model which predicts the sending behavior for known values of RT T and p. The idea of the TRC is it to fix RT T and p of a connection. Therefore the TRC drops packets to control the window size of the TCP connection and delays packets to increase the RTT. Consequently the achieved rate of the connection is controlled. The TRC is a traffic conditioner which has to be placed at the ingress point of the network. A TCP model for ns-2 TCP SACK implementation was derived. Based on this model the TRC is constructed. The TRC is evaluated by simulations using ns-2. It is shown that the TRC has no bias against any requested rate or RT T . The requested rate is achieved with a very high probability and confidence intervals for the achieved goodput are small. Overall concluding from the simulation results it seems promising to drop packets already at the ingress point of the network. The whole concept of the TRC is based on simulations in ns-2. So the TRC has to be evaluated by real measurements in TCP/IP networks, because the accuracy of the TRC depends on the TCP model. In real TCP/IP networks there exist a lot of slightly different TCP implementations [11]. Consequently the applicability of the TRC in such an environment has to be evaluated. The TRC rate controller does not need more suppositions as needed in QoS networks. The diversity of TCP implementations is a general problem of all attempts that try to control or estimate TCP rates based on a TCP model. There are still open issues which have to be investigated in more detail. For example the dependence of RT Tdev on link bandwidth and requested rates has to be analyzed.
References 1. Nichols, K., Blake, S., Baker, F., Black, D.: RFC 2474: Definition of the Differentiated Services Field (DS Field) in the IPv4 and IPv6 Headers (1998) 2. Blake, S., Black, D., Carlson, M., Davies, E., Wang, Z., Weiss, W.: RFC 2475: An architecture for differentiated services (1998) 3. (2002), K.: (Workload Characterization) http://www.caida.org/analysis/workload (May 15, 2002). 4. Sahu, S., Nain, P., Towsley, D., Diot, C., Firoiu, V.: On Achievable Service Differentiation with Tocken Bucket Marking for TCP. In: Proc. of the ACM SIGMETRICS’2000 Int. Conf. on Measurement Modeling of Computer Systems, Santa Clara, CA, USA. (2000) 5. Chait, Y., Hollot, C., Misra, V., Towsley, D., Zhang, H., Lui, J.: (Providing Throughput Differentiation for TCP Flows Using Adaptive Two-Color Marking and Two-Level AQM) to be presented at INFOCOMM 2001. 6. Elizondo-Armengol, A.: TCP-Friendly Policy Functions: Capped Leaky Buckets. In: Seventeenth International Teletraffic Congress (ITC17). (2001) 7. Yilmaz, S., Matta, I.: On Class-based Isolation of UDP, Short-lived and Long-lived TCP Flows. Technical Report BU-CS-2001-011, Boston University (2001) 8. Mathis, M., Semke, J., Mahdavi, J., Ott, T.: The Macroscopic Behavior of the TCP Congestion Avoidance Algorithm. ACM Computer Communication Review 27 (1997) 9. Padhye, J., Firoiu, V., Towsley, D., Kurose, J.: Modeling TCP Throughput: A Simple Model and its Empirical Validation. In: ACM SIGCOMM‘98. (1998) 10. Network Simulator ns-2, see http://www.isi.edu/nsnam/ns/. 11. TBIT The TCP Behavior Inference Tool, see http://www.icir.org/tbit/.