peculiarities of vehicular mobility and urban radio transmis- sion, especially .... StreetMap (OSM) is a collaborative project to create a free editable map of the ...
A Realistic Simulation Framework for Vehicular Networks Manuel Fogue, Piedad Garrido, Francisco J. Martinez
Juan-Carlos Cano, Carlos T. Calafate, Pietro Manzoni Universitat Politècnica de València, Spain
University of Zaragoza, Spain
{m.fogue, piedad, f.martinez}@unizar.es
ABSTRACT Research in Vehicular Networks (VNs) has found in simulation the most useful method to test new algorithms and techniques. This is mainly due to the high cost of deploying such systems in real scenarios. When simulating vehicular environments, two different issues must be addressed: mobility and wireless communications. Regarding mobility, several mobility pattern generators have been proposed so far. However, all of them present important drawbacks from the point of view of reproducing realistic mobility over real roadmaps. As for the wireless communications, ns-2 has become one of the most widely used network simulators for wireless communications researchers. However, simulating VNs requires using environments behaving as realistically as possible, and ns-2 presents some deficiencies that make it difficult to obtain accurate vehicular simulations. In this work, we present a realistic simulation framework which combines vehicular mobility over real roadmaps and ns-2 optimizations to obtain more accurate and meaningful results when simulating vehicular environments.
Categories and Subject Descriptors C.2.1 [Computer-Communication Networks]: Network Architecture and Design—Wireless communication
General Terms Experimentation, Measurement
Keywords Vehicular networks, simulation, inter-vehicular communication, 802.11p
1.
INTRODUCTION
Deploying and testing Vehicular Networks (VNs) involves high cost and manpower, since realistic testbeds may require using vehicles moving at high speeds and integrated wireless 3HUPLVVLRQ�WR�PDNH�GLJLWDO�RU�KDUG�FRSLHV�RI�DOO�RU�SDUW�RI�WKLV�ZRUN�IRU SHUVRQDO�RU�FODVVURRP�XVH�LV�JUDQWHG�ZLWKRXW�IHH�SURYLGHG�WKDW�FRSLHV Permission to make digital or hard copies of all or part of this work for DUH�QRW�PDGH�RU�GLVWULEXWHG�IRU�SURILW�RU�FRPPHUFLDO�DGYDQWDJH�DQG�WKDW personal or classroom use is granted without fee provided that copies are FRSLHV�EHDU�WKLV�QRWLFH�DQG�WKH�IXOO�FLWDWLRQ�RQ�WKH�ILUVW�SDJH��7R�FRS\ not made or distributed for profit or commercial advantage and that copies RWKHUZLVH��WR�UHSXEOLVK��WR�SRVW�RQ�VHUYHUV�RU�WR�UHGLVWULEXWH�WR�OLVWV� bear this notice and the full citation on the first page. To copy otherwise, to UHTXLUHV�SULRU�VSHFLILF�SHUPLVVLRQ�DQG�RU�D�IHH� republish, to post on servers or to redistribute to lists, requires prior specific 6LPXWRROV�������0DUFK��������'HVHQ]DQR�GHO�*DUGD��,WDO\ permission and/or a fee. &RS\ULJKW�k������,&67������������������ SIMUTools 2012 March 19–23, Desenzano, Italy. '2,���������LFVW�VLPXWRROV������������ Copyright 2012 ICST, ISBN 978-X-XXXXX-XXX-X/XX/XX.
��
{jucano, calafate, pmanzoni}@disca.upv.es
devices to support communication among them. Moreover, obtaining representative scenarios to evaluate the operation of a VN system could become a complex matter as these systems are usually large and heterogeneous, and they depend on the behavior of the surrounding vehicles. Hence, relying on simulation is an useful methodology prior to actual implementation. One of the important issues when creating a vehicular simulation environment is to correctly model how vehicles move, providing an accurate and realistic vehicular mobility description at both macroscopic and microscopic levels. Regarding other features, such as using real topologies, or the effect of radio signal absorption due to obstacles, they are rarely included, and, therefore, obtained results are far from being realistic. Unlike other previous works, we seek to fully address the peculiarities of vehicular mobility and urban radio transmission, especially when buildings interfere with radio signal propagation. With this purpose, we developed a more accurate and realistic vehicular simulation framework by improving the process to obtain both: (i) realistic mobility traces, and (ii) accurate radio propagation models. Our approach offers a solution that allows integrating real roadmaps into the simulation process, while obtaining more accurate and meaningful results. VN simulations are greatly dependent on the simulated environment. The position and effect of the obstacles that could interfere with the radio signal, as well as the presence and behavior of other vehicles, produce notable differences in the obtained results [19]. In addition, the topology of the map used to constrain vehicle movement is a key factor [9]. In this paper we present a complete simulation framework specially designed to simulate vehicular networks, in order to assess novel proposals. Specifically, we have designed and implemented Citymob for Roadmaps (C4R), a mobility generator for vehicular networks. Moreover, we have introduced several enhancements to ns-2 [8], a widely used network simulator. All these enhancements allow simulating vehicular networks using real maps while reducing the time required to prepare the simulated scenarios. Compared to other similar proposals, such as VERGILIUS [11], Veins [24], or TraNS [21], our vehicular simulation framework accounts for the effect of obstacles (e.g. buildings) in radio signal propagation when using the IEEE 802.11p in real urban maps. The rest of the paper is organized as follows: Section 2 introduces the problem of modeling mobility when simulating vehicular networks. Section 3 presents our Citymob for Roadmaps (C4R) mobility generator. Section 4 shows the
which makes it possible to account for areas with different vehicle densities since, in a real town, traffic is not uniformly distributed; instead, there are downtowns or points of interest that may attract vehicles, or points that repel vehicles (e.g., residential areas when people go to work).
limitations of ns-2 when simulating vehicular scenarios. In Section 5 we elaborate on the enhancements we developed for the ns-2 simulator. Section 6 presents some similar simulation tools currently available. Finally, Section 7 concludes this paper.
2.
MODELING MOBILITY IN VEHICULAR NETWORKS
A critical issue in VN simulation studies is the need for a mobility model reflecting the real behavior of vehicular traffic. Vehicular mobility generators are needed to increase the level of realism in VN simulations. They use previously defined mobility models to generate realistic vehicular mobility traces to be used as an input for a network simulator. The inputs of the mobility generator include the road model and the scenario parameters (i.e., maximum vehicular speed, rates of vehicle arrivals and departures, etc). The output of the trace details the location of each vehicle at every time instant for the entire simulation time, along with their mobility profiles. Examples are VanetMobiSim [12], SUMO [14], FreeSim [1], CityMob [17] and STRAW [2]. A wide variety of mobility models has been proposed for vehicular simulations. They try to closely represent the movement patterns of users. The Simulation of Urban MObility (SUMO) mobility generator supports several mobility models, such as the Krauss mobility model [15] with some modifications to allow multi-lane behavior [14], and the Wagner mobility model [26]. The Krauss model is based on collision avoidance among vehicles by adjusting the speed of a vehicle to the speed of its predecessor. The Wagner model, unlike most driving models which assume an instantaneous or even delayed reaction of the driver to the surrounding situation, considers two important features of human driving and of human actions in general. Firstly, humans usually plan ahead, and secondly, the type of control that humans apply is not continuous, but discrete in time: they act only at certain moments in time. Saha and Johnson [22] modeled vehicular traffic with a random mobility of vehicles over real road topologies extracted from the maps of the US Census Bureau TIGER database. In that work, vehicles select one point over the graph as their destination, and then compute the shortest path to get there. The edges sequence is obtained by weighting the cost of traveling on each road at its speed limit, and the traffic congestion. Choffnes et al. [6] designed STRAW, a street mobility model that models real traffic conditions by incorporating a simple car-following model with traffic control to introduce vehicular congestion. STRAW relies on street plans to build a roadmap for the specified target region. It also provides at least one lane in each direction on which vehicles can move. Mahajan et al. [16] presented three different models: (i) Stop Sign Model (SSM), (ii) Probabilistic Traffic Sign Model (PTSM), and (iii) Traffic Light Model (TLM). The main difference between these models is basically the algorithm used to reproduce stop signs. All roads are modeled as bidirectional roads; SSM and PTSM assume a single lane in each direction of every road, whereas TLM provides the option for modeling multiple lanes. Our proposal provides some of the aforementioned mobility models (see Section 3.1), including our Downtown Model
��
3. C4R: CITYMOB FOR ROADMAPS In this section we present our novel mobility pattern generator for vehicular networks called Citymob for Roadmaps (C4R)1 , a software which allows simulating vehicular traffic in different locations using real maps. C4R has been implemented using the Java programming language, and it is distributed under the GNU/GPL license.
3.1 C4R’s features C4R has been proposed to simulate more realistic vehicular scenarios based on real roadmaps from all over the world. C4R relies on both the OpenStreetMap [3] tool to get the real roadmaps, and SUMO [14] to generate the vehicles and their movements within these scenarios. OpenStreetMap (OSM) is a collaborative project to create a free editable map of the world, which is being built largely from scratch, and released with an open content license. The Simulation of Urban MObility (SUMO) is an open source, microscopic, space-continuous traffic simulator designed to handle large road networks. The functionality provided by C4R is twofold: it constrains vehicle movements to the streets defined in the roadmap, and it limits their mobility according to the vehicular congestion and traffic rules. C4R has the following features: • Ease of use. Unlike other previously proposals, users can generate several mobility traces from scratch in just a few minutes. This process, which is necessary to test and validate every novel scientific proposal, usually took us several hours, even for simple scenarios. • Highly portable system (MAC, Windows and Linux compatibility) since it has been implemented in Java. • It is possible to work with real maps from all over the world imported from OpenStreetMap. They can be selected graphically or by manually providing the coordinates. By using a digital roadmap as input, C4R obtains the topology of roads and their speed limits. The speed limit is assigned according to the road types defined in its map database. The traffic lights are also modeled by C4R automatically. • Users can easily change the number of simulated vehicles. • C4R distinguishes among different types of vehicles (cars, trucks, taxis, etc.) which usually have different mobility characteristics, hence increasing the level of realism of the simulations. • Vehicle routes can be defined either by the user or randomly. • Attraction and repulsion points in the roadmap can be defined graphically or by providing the coordinates manually. 1 C4R’s source code http://www.grc.upv.es/software/
is
available
at
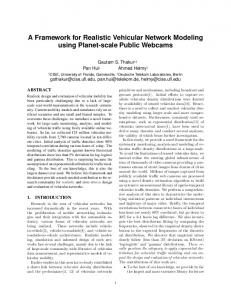
Figure 1: Downtown definition (Step 2 out of 5 of the C4R wizard).
• Vehicles movements are defined according to the selected mobility model. C4R provides the following mobility models: (Krauss [15], Krauss modified [14], Wagner [26], Kerner [13], Intelligent driver model (IDM) [25], and the Downtown model [17]).
Table 1: C4R System Requirements Component
• It is possible to visualize simulations. Users can rapidly visualize mobility traces once they are generated. • C4R allows users to obtain multiple ns-2 compatible mobility traces at once. • All the necessary steps in the trace creation process can be taken using a user-friendly wizard (see Figure 1), making the use of C4R very simple. We only have to execute the wizard and follow the five steps required, i.e., (1) obtain real roadmap data, (2) define the attraction or repulsion points if they are required, (3) insert vehicles into the scenario, (4) select a mobility model from the different available ones, and (5) indicate the simulation time and the number of traces desired.
Processor Hard disk RAM Screen resolution Platform Java runtime version SUMO version Internet connection
Minimum requirements Pentium IV 1 GB 512 MB 1024×768 MAC/Linux/Windows Java 6 SE 0.11.1 56K connection
• Attraction rate. As previously mentioned, traffic is not uniformly distributed; there are special areas that may attract or repel vehicles. Users can assign different rates to the attraction/repulsion areas. Values near 0 will define repulsion points, and values near 1 will define attraction points.
Table 1 presents the minimum system requirements to run our C4R application. The minimum capacity of the hard disk could be greater for some tasks. In some circumstances, when working with big maps and many vehicles, the trace file size could be greater than 5 GB, but this is unusual.
• Downtown rate. Using this parameter, the user can define the probability for a vehicle to be within an attraction/repulsion area, and the probability of traveling to/from this area.
3.2 C4R’s parameters
• Departure (in seconds). It is the time when the vehicles are deployed in the scenario. The user can deploy different vehicles at different time instants.
C4R can be tuned by the user in order to adapt the different possibilities to the user needs. In this subsection we review some of the most important parameters available in our C4R tool.
• Maximum simulation time (in seconds). It is the total duration of the simulation.
��
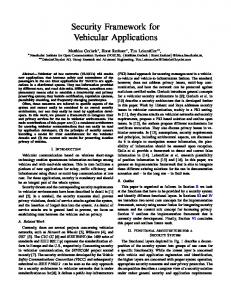
• Number of traces. One important aspect when simulating novel proposals is to launch several executions with different generated mobility scenarios in order to obtain reasonable confidence intervals, thus increasing the reliability of the obtained results. Hence, researchers usually need to generate several different traces from the same roadmap. C4R makes it possible; users only need to define the required number of traces. Additionally, there is another set of parameters that can be tuned for the different mobility models available: • Acceleration, which defines the maximum acceleration of the vehicles. By default, it is set to 1.4 m/s2 . • Deceleration, which defines the maximum deceleration of the vehicles. By default, it is set to 2 m/s2 . • Sigma, which indicates the driver’s imperfection (between 0 and 1). By default, it is set to 0.5. This parameter is only used in the Krauss and modified Krauss models. Figure 2: Simulated scenario of San Francisco, USA.
• Tau, which defines the driver’s reaction time. By default, it is set to 0.3 s. This parameter is used in all models except the IDM model.
3.4 Quantitative Comparison of Mobility Generators
• k. This parameter is only used in the Kerner model, and defines the vehicle density measured in vehicles per kilometer. By default, it is set to 20 vehicles/km.
To evaluate the realism and effectiveness of existing VANET mobility generators, we performed the simulation of a generic Warning Message Dissemination (WMD) protocol on ns-2 over SUMO, VanetMobiSim, and C4R traces. WMD protocols are useful when an accident occurs since they can help to prevent new accidents (by warning other vehicles about the accident), and alleviate congestion [18]. Figure 2 shows the simulated topology for the map layout, and Table 3 shows the simulation parameters used. As shown, C4R is the only mobility generator which includes the Downtown mobility model; it considers that there is an area where the density of vehicles is slightly higher (as the downtown in the cities usually presents higher traffic densities). SUMO and VanetMobiSim use the Krauss model, and the IDM with Lane Changes, respectively. The rest of parameters are the same for the three mobility generators. The performance metrics we measured include: (i) the percentage of vehicles receiving the warning messages, (ii) the warning notification time, which is the time required by vehicles to receive the warning messages, and (iii) the number of packets received per vehicle. Each simulation run lasted for 450 seconds. In order to achieve a stable state, we only collect data after the first 60 seconds. Since the performance results are highly related to the scenarios, and due to the random nature of the mobility models used, we repeated the simulations to obtain reasonable confidence intervals. As shown in Figure 3 and Table 4, the shortest warning notification time2 is achieved when using C4R traces, followed by SUMO and VanetMobiSim. In terms of percentage of vehicles informed, using C4R traces resulted in the largest percentage of vehicles receiving the warning messages. Finally, in terms of number of packets received, experiments
• Phi. This parameter is only used in the Kerner model, and defines the flow rate measured in vehicles per time interval. • Headway, which sets the desired time headway to the vehicle in front. This parameter is only used in the IDM model. By default, it is set to 1.5 s. • MinGap, which expresses the minimum net distance that is kept even at a complete stand-still in a traffic jam. This parameter is only used in the IDM model. By default, it is set to 2 m.
3.3 Qualitative Comparison of Mobility Generators Table 2 presents a summary of some of the most widely used vehicular mobility generators focusing on their main characteristics. We have grouped the comparison parameters into five different categories: (a) Software characteristics, (b) Map types, (c) Mobility models supported, (d) Traffic models implemented, and (e) Trace formats supported. As shown, Freesim exhibits good software characteristics but it is limited in other functions. VanetMobiSim, SUMO, CityMob, STRAW and C4R all have good software features and traffic model support. However, only VanetMobiSim provides excellent trace file support. C4R is excellent in software features, mobility, and traffic model support. Regarding map types and traces, C4R is clearly oriented to simulate real maps in the ns-2 simulator. Its most important feature is allowing to generate realistic mobility traces graphically (using real maps), easily (by means of the wizard), and quickly (in only a few minutes).
2 The data presented for warning notification time, is the time needed to inform at least 40% of the vehicles.
��
Table 2: A comparison of the studied mobility generators VanetMobiSim SUMO FreeSim CityMob STRAW Opensource Console
-
GUI Available examples
-
Continuous development
-
Wizard Real User defined
-
Random Manhattan Voronoi Random WayPoint STRAW Manhattan Downtown Krauss model Wagner model Kerner IDM Multilane roads
-
Lane changing
-
Separate directional flows
-
Speed constraints Traffic signs
-
Intersections management
-
Large road networks
-
-
Collision free movement
-
-
-
Different vehicle types
-
Hierarchy of junction types
-
Route calculation Ns-2 trace support GloMoSim support Qualnet support SWANS support XML-based support
��
C4R
Table 3: Parameters used for performance simulation of different VANET mobility generators VANET mobility generator
SUMO
VanetMobiSim
network simulator
C4R
ns-2.31
number of vehicles
300 2000m × 2000m
map area size
-
downtown size downtown probability
1000m × 1000m
-
number of warning mode vehicles
0.6 3
warning packet size
256B
normal packet size
512B
packets sent by nodes
1 per second
warning message priority
AC3
normal message priority
AC1
MAC/PHY
802.11p
maximum transmission range
400m
mobility models
Krauss
IDM with Lane Changes
Krauss and Downtown
100
% of vehicles receiving the warning messages
Table 4: Performance of the WMD protocol under the different mobility generators 80
Performance 60
VMobiSim
0.80
1.90
C4R 0.50
% of vehicles informed
56.51
39.12
86.75
Number of packets received
309.03
685.73
1153.50
40
20 C4R SUMO VanetMobiSim 0 0
5
10
15
20
25
30
Warning notification time (s)
Figure 3: Cumulative histogram for the time evolution of disseminated warning messages using different mobility generators.
using C4R show a higher packet delivery rate, being the lowest results achieved with SUMO. Results show that the effect of the Downtown concept included in our C4R mobility generator is crucial, since the higher density of vehicles, the easier becomes the warning message dissemination process. We consider that SUMO, and VanetMobiSim in particular, underestimate the performance of the WMD protocol in urban scenarios. Overall, our investigation shows that, when simulating the same WMD protocol with the same network simulator over different VANET mobility generators, different performance results may be obtained.
4.
SUMO
Warning notification time (s)
as the effect of obstacles in the radio signal propagation. Ns-2 is a discrete event simulator targeted at networking research which has become a widely used tool to simulate the behavior of wired and wireless networks. When simulating radio signal transmission, we use a mathematical formulation of the radio wave propagation as a function of parameters such as distance between vehicles and radio frequency. This formulation is called Radio Propagation Model (RPM). The ns-2 simulator offers some RPMs to account for wireless signal strength. These models assume a flat surface, where the simulation environment contains no objects that could block the signal (mostly buildings in urban environments), and thereby they do not accurately simulate the radio propagation process in vehicular environments. The RPMs included in ns-2 v2.35 are: 1. Free Space model: The received power is only dependent on the transmitted power, the antenna gains, and on the distance between sender and receiver. Obstacles are not modeled. 2. Two-ray Ground (TRG) model: Assumes that the received signal energy is the sum of the direct line-ofsight path and the reflected path from the ground. It does not account for obstacles, and sender and receiver have to be on the same plane.
LIMITATIONS OF THE NS-2 SIMULATOR
3. Rayleigh and the Ricean fading models: Both models describe the time-correlation of the received signal power. The Rayleigh model considers indirect paths between the sender and the receiver, while the Ricean fading model applies when there is one dominant path and multiple indirect signals.
We now address the problem of improving the radio propagation models provided by one of the most used network simulator, i.e. the ns-2. In particular, we developed some improved models dealing with the 802.11p standard as well
��
5.2 Enhanced Radio Propagation Models proposed for the ns-2 simulator
4. Nakagami fading model: Signal reception power is determined using a probability distribution dependent on distance. Configuration parameters are used to simulate different levels of fading. This model can be interpreted as a generalization of the Rayleigh distribution.
We also modified the ns-2 simulator to include four additional RPMs that increase the level of realism in simulations, thereby allowing us to obtain more accurate and meaningful results. Three of these RPMs are designed to be used in synthetic Manhattan-style grid scenarios: (i) the Distance Attenuation Model (DAM), (ii) the Building Model (BM), and (iii) the Building and Distance Attenuation Model (BDAM). The fourth one, the Real Attenuation and Visibility Model (RAV), is designed to be used in real map scenarios.
5. Shadowing model: usually defined as a log-normal shadowing model, it consists of two parts: the first one is known as the path loss model, which predicts the mean received power at a distance d in different environments, and the second one adopts a Gaussian random variable to reflect the variation of the received power at a certain distance.
5.2.1 Distance Attenuation Model
Although the latest version of ns-2 (version 2.35) provides some changes to include the 802.11p standard [5], existing RPMs found in ns-2 do not support obstacle modeling within the network. In fact, for the Free Space and the Two-ray Ground models, only the power level is taken into account. Hence, determining whether a packet reaches its destination or not is a deterministic process. The other three models included are based on probabilistic distributions that do not use information about the specific scenario. Therefore, situations where two vehicles are in line-of-sight are handled exactly in the same way as situations where there are obstacles between them, which cannot be considered realistic.
5.
ENHANCEMENTS TO THE NS-2 SIMULATOR
Our efforts to improve the realism of Vehicular Network (VN) simulations using ns-2 derived in two parts: (i) improving the models to represent the features of the 802.11p standard in terms of frequency, data rate, etc., and (ii) developing new Radio Propagation Models to model Packet Error Rate and fading due to obstacles in a realistic manner.
The Distance Attenuation Model (DAM) considers the impact of signal attenuation due to the distance between the vehicles on packet loss. To estimate such impact we relate the BER (bit error rate) or PER (packet error rate) to distance under specific channel conditions. It allows us to simplify calculations and thus significantly reduce simulation run-time.
5.2.2 Building Model The Building Model (BM) takes into consideration that, at a frequency of 5.9 GHz (i.e., the frequency band of the 802.11p standard), the signal is highly directional and will experience a very low depth of penetration. Hence, in most cases, buildings will absorb radio waves at this frequency, making communication only possible when the vehicles are in line-of-sight. Other previous works [4, 20, 23] also consider these premises.
5.2.3 Building and Distance Attenuation Model
5.1 IEEE 802.11p MAC/PHY layers We modified the simulator to follow the upcoming WAVE standard closely. Achieving this requires extending the ns-2 simulator to implement the IEEE 802.11p. In terms of the physical layer, the data rate used for packet broadcasting was fixed at 6 Mbit/s, i.e., the maximum rate for broadcasting in 802.11p when using 20 MHz channels. The MAC layer is based on the IEEE 802.11e Enhanced Distributed Channel Access (EDCA) Quality of Service (QoS) extensions [27]. Therefore, application messages are categorized into different Access Categories (ACs), where AC0 has the lowest and AC3 the highest priority. The contention parameters used for the Control Channel (CCH) are shown in [7]. Authors in [7] and [5] use a theoretical maximum transmission range of 250 m for 802.11p in their experiments. However, our own real experimental results using 802.11a devices (which employs almost the same PHY layer as 802.11p, with extended sampling rate and clock rate) showed a maximum transmission range of 400 m in an obstacle-free environment, and also demonstrated the high impact of obstacles in radio signal propagation. Other published works regarding 802.11p-based real testbeds obtained very similar results [4, 20, 23]. Hence, we modified the PHY layer configuration used in ns-2 to represent this behavior. Table 5 contains part of the ns-2 Tcl configuration file that provides the IEEE 802.11p configuration parameters.
��
The Building and Distance Attenuation Model (BDAM) combines both DAM and BM models. Communication will only be possible, in most cases, when the received signal is strong enough and vehicles are within line-of-sight. BDAM can be considered more realistic than both DAM and BM, but it still has lack of realism since it is designed for Manhattan-based scenarios alone. The Real Attenuation and Visibility model, presented in the next subsection, solves this problem.
5.2.4 Real Attenuation and Visibility model for real roadmap scenarios A wireless signal propagation model can be characterized by: (a) attenuation schemes (signal power loss due to distance), and (b) visibility schemes (presence of obstacles interfering with signal propagation). The combination of these schemes makes up our Radio propagation model, called Realistic Attenuation and Visibility (RAV) model. Our model implements signal attenuation due to the distance between vehicles as closely to reality as possible. In general, ns-2 offers deterministic RPMs, i.e., the selected function determines the maximum distance a packet could reach. If the receiver is within this range, the packet will be successfully received; on the contrary, if the distance is greater, it will be lost. In order to increase realism, we use a probabilistic approach to model packet losses due to channel noise and other situations. We use a probability density function to determine the probability of a packet being successfully received at any given distance. With respect to other attenuation schemes, such as TwoRay Ground and Nakagami, our scheme, instead of being
Table 5: NS-2 Tcl file for the IEEE 802.11p #Configuration for 802.11p PHY layer Phy/WirelessPhy Phy/WirelessPhy Phy/WirelessPhy Phy/WirelessPhy Phy/WirelessPhy Phy/WirelessPhy Phy/WirelessPhy Phy/WirelessPhy
set set set set set set set set
CPThresh_ CSThresh_ RXThresh_ Rb_ Pt_ freq_ L_ bandwidth_
10.0 1.559e-11 3.652e-10 2*e6 3.57382 5.9e9 1.0 54e6
;# Maximum tx range = 400 meters ;# 5.9 GHz
#Configuration for 802.11p MAC layer (based on 802.11e MAC layer) Mac/802_11p Mac/802_11p Mac/802_11p Mac/802_11p Mac/802_11p Mac/802_11p Mac/802_11p Mac/802_11p Mac/802_11p Mac/802_11p Mac/802_11p Mac/802_11p
set set set set set set set set set set set set
CWMin_ CWMax_ SlotTime_ SIFS_ PreambleLength_ PLCPHeaderLength_ PLCPDataRate_ RTSThreshold_ ShortRetryLimit_ LongRetryLimit_ basicRate_ dataRate_
15 1023 0.000009 0.000016 96 40 6.0e6 3000 7 4 6e6 6e6
;# ;# ;# ;# ;# ;# ;# ;# ;#
9 us 16 us 96 bit 40 bits 6 Mbps 3 Kbytes retransmissions retransmissions 6 Mbps
the wireless signal can experience the effects of reflection, refraction and diffraction due to the presence of solid obstacles in urban scenarios. Hence, some situations where vehicles are not in line-of-sight can still result in effective communication between them.
theoretical, is obtained directly from experimental data. Regarding visibility, the main objective that a realistic visibility scheme should accomplish is to determine if there are obstacles between the sender and the receiver which interfere with the radio signal. In most cases, when using the 5.9 GHz frequency band (used by the 802.11p standard), buildings absorb radio waves, and so communication is not possible. As previously mentioned, the Building and Distance Attenuation Model (BDAM) was designed to work in Manhattanstyle grid layouts, where simple calculations were used to determine if two vehicles were in line-of-sight. RAV goes one step forward by adapting the algorithm to support more complex and realistic layouts. Given a real reference map containing the street layout, our proposal determines whether two different vehicles can communicate using the following strategy:
5.3 Quantitative Comparison of the RPMs
• Two vehicles in the same street are always in line-ofsight. We consider that a vehicle is in a street (s) when the minimum distance (dmin ) between its position (P (x, y)) and the line (r) formed as a extension of the street is less than a threshold (ths ). • When a vehicle is at a junction (j), we consider that this vehicle may potentially communicate with all the vehicles present in the streets which start from the junction j, i.e., the vehicle is considered to be at all the neighbor streets simultaneously. A threshold distance (thj ) is used to determine if a vehicle is close enough to a junction for this rule to apply. • Two vehicles in adjacent streets (labeled i and j) can communicate if the angular difference (α) between their streets is below a threshold tha . This property can be extended if there is a series of linked streets between vehicles, and, for every street in the chain, the angular difference with the rest of streets is less than tha . We consider this, since the electromagnetic waves forming
��
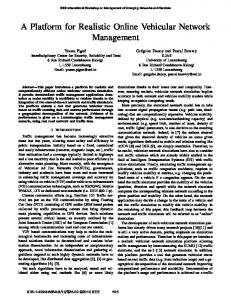
In this section, we evaluate the impact of some of the presented RPMs on the performance of a Warning Message Dissemination application, typically used in VANETs. Specifically, we compared the performance of TRG, Nakagami, and our RAV proposal. Our intention is to evaluate the effect that the different radio propagation schemes have over the network performance, and measure the differences appearing when we increase the level of realism of the simulations. Results in Figure 4 are obtained using a real map from San Francisco as the simulation topology (see Figure 2). As shown, when using TRG and Nakagami RPMs, and when obstacles are not accounted for (as in the majority of VANET simulators), information reaches more vehicles (98.26% and 94.37%, respectively). However, the same models only achieved 63.24% and 55.37% of the vehicles being informed when the effect of obstacles in signal transmission is considered. Our RAV model, although accounting for the effect of obstacles, still considers that 86.75% of the vehicles are aware of the dangerous situation. Table 6 presents a summary of the average performance results obtained when simulating the different attenuation schemes. As shown, the effect of obstacles can also be observed in the warning notification time, since the protocol requires more time to warn the same percentage of vehicles (e.g. TRG and Nakagami required much more time to inform 40% of the vehicles when accounting for the presence of obstacles). Regarding the number of packets received per vehicle, when ignoring obstacles, TRG considers that more messages are received compared to Nakagami. When obstacles are present, results show that RAV considers that
Table 6: Performance of the WMD protocol under the different radio propagation models Performance
Two-Ray w/o obs.
Nakagami w/o obs.
% of vehicles receiving the warning messages
Nakagami w/ obs.
0.60
0.62
0.7
1.25
3.80
% of vehicles informed
98.26
94.37
86.75
63.24
55.37
2224.70
1092.00
1153.50
461.17
234.70
100
80
60
40
20
Two-Ray Ground (w/o obstacles) Nakagami (w/o obstacles) RAV Two-Ray Ground (w/ obstacles) Nakagami (w/ obstacles)
0 5
Two-Ray w/ obs.
Warning notification time (s) Number of packets received
0
RAV
10
15
20
25
30
be modeled and complex interactions between both domains examined. The simulation of the radio propagation is based on empirical measures based on the 802.11p standard. However, unlike our proposal, Veins uses a deterministic radio propagation model (Free-space with some modifications), it requires to know the exact position of the buildings, and it considers that communications are possible even at very large distances, since it uses very high transmission power. Finally, TraNS [21] (Traffic and Network Simulation Environment) is a Graphical User Interface (GUI) tool that integrates traffic and network simulators (SUMO and ns2) to generate realistic simulations of VANETs. As Veins, TraNS allows the information exchanged in a VANET to influence the vehicle behavior in the mobility model, although it does not account for the effect of obstacles (e.g. buildings) in radio signal propagation.
Warning notification time (s)
7. CONCLUSIONS
Figure 4: Warning notification time when varying the attenuation scheme.
vehicles receive more packets compared to the TRG and Nakagami RPMs since the maximum transmission range is higher and communication effectiveness improves.
6.
SIMILAR SIMULATION TOOLS
In this section, we present some other similar VANET simulation tools. VERGILIUS [11] is a VANET simulation tool which uses the Tiger digital maps to generate highly tunable city-based scenarios for both SUMO and Corsim microscopic-mobility simulators. In addition, the VERGILIUS propagation tool computes the attenuation-matrix using the city-block and road map information extracted from the Tiger digital map database by using the CORNER algorithm [10]. The simulation of the radio propagation is based on theoretical data and validated with empirical measures, and it does not need to know the exact location of the buildings since it approximates them by using the streets width. However, unlike our proposal, the CORNER algorithm implies very complex calculations and it is only valid for Manhattan-based topologies where the streets are arranged orthogonally. Therefore, real maps are not correctly simulated by VERGILIUS. In addition, it uses a Rayleigh fading propagation model, and it was only validated with 802.11b-based testeds. Veins [24] is an Inter-Vehicular Communication (IVC) simulation framework composed of an event-based network simulator and a road traffic microsimulation model. Both domains’ models are bi-directionally coupled and simulations are performed on-line. This way, not only the influence of road traffic on network traffic can be modeled, but also vice versa. In particular, the influences of IVC on road traffic can
��
In this paper we presented a complete simulation framework specially designed to simulate vehicular networks. Specifically, we have addressed two different issues: (i) we designed and implemented Citymob for Roadmaps (C4R), a mobility generator for vehicular networks, and (ii) we proposed and included several Radio Propagation Models into the ns-2 simulator, which are specially designed to support realistic vehicular communications. All these enhancements allow researchers to simulate vehicular networks using real maps, thus obtaining far more accurate results than using other available simulation frameworks. In addition, C4R allows to significantly reduce the time required to prepare the simulation scenarios. In the future we will improve C4R’s features by integrating mobility and network communications, since the information exchanged among vehicles should influence their mobility patterns.
Acknowledgments This work was partially supported by the Ministerio de Ciencia e Innovaci´ on, Spain, under Grant TIN2011-27543C03-01, and by the Diputaci´ on General de Arag´ on, under Grant “subvenciones destinadas a la formaci´ on y contrataci´ on de personal investigador”.
8. REFERENCES [1] FreeSim, 2008. Available at http://www.freewaysimulator.com/. [2] STRAW - STreet RAndom Waypoint - vehicular mobility model for network simulations (e.g., car networks), 2008. Available at http://www.aqualab.cs.northwestern.edu/projects/ STRAW/index.php.
[16] A. Mahajan, N. Potnis, K. Gopalan, and A. Wang. Evaluation of mobility models for vehicular ad-hoc network simulations. In IEEE International Workshop on Next Generation Wireless Networks (WoNGeN 2006), Bangalore, India, December 2006. [17] F. J. Martinez, J.-C. Cano, C. T. Calafate, and P. Manzoni. Citymob: a mobility model pattern generator for VANETs. In IEEE Vehicular Networks and Applications Workshop (Vehi-Mobi, held with ICC), Beijing, China, May 2008. [18] F. J. Martinez, J.-C. Cano, C. T. Calafate, P. Manzoni, and J. M. Barrios. Assessing the feasibility of a VANET driver warning system. In Proceedings of the 4th ACM workshop on Performance monitoring and measurement of heterogeneous wireless and wired networks, PM2HW2N’09, pages 39–45, New York, NY, USA, 2009. ACM. [19] F. J. Martinez, M. Fogue, M. Coll, J.-C. Cano, C. T. Calafate, and P. Manzoni. Assessing the Impact of a Realistic Radio Propagation Model on VANET Scenarios Using Real Maps. In 9th IEEE International Symposium on Network Computing and Applications (NCA), pages 132–139, Boston, USA, July 2010. [20] R. Meireles, M. Boban, P. Steenkiste, O. Tonguz, and J. Barros. Experimental study on the impact of vehicular obstructions in VANETs. In IEEE Vehicular Networking Conference (VNC), pages 338–345, December 2010. [21] M. Pi´ orkowski, M. Raya, A. L. Lugo, P. Papadimitratos, M. Grossglauser, and J.-P. Hubaux. TraNS: realistic joint traffic and network simulator for VANETs. SIGMOBILE Mob. Comput. Commun. Rev., 12:31–33, January 2008. [22] A. K. Saha and D. B. Johnson. Modeling mobility for vehicular ad hoc networks. In ACM Workshop on Vehicular Ad Hoc Networks (VANET 2004), Philadelphia PA, October 2004. [23] C. Sommer, D. Eckhoff, R. German, and F. Dressler. A computationally inexpensive empirical model of IEEE 802.11p radio shadowing in urban environments. In Eighth International Conference on Wireless On-Demand Network Systems and Services (WONS), pages 84–90, January 2011. [24] C. Sommer, Z. Yao, R. German, and F. Dressler. Simulating the Influence of IVC on Road Traffic using Bidirectionally Coupled Simulators. In 27th IEEE Conference on Computer Communications (INFOCOM 2008): IEEE Workshop on Mobile Networking for Vehicular Environments (MOVE 2008), pages 1–6, Phoenix, AZ, April 2008. IEEE. [25] M. Treiber, A. Hennecke, and D. Helbing. Congested traffic states in empirical observations and microscopic simulations. Physical Review E, 62:1805, 2000. [26] P. Wagner. How human drivers control their vehicle. The European Physical Journal B - Condensed Matter and Complex Systems, 52:427–431, 2006. [27] S. Wietholter and C. Hoene. Design and Verification of an IEEE 802.11e EDCF Simulation Model in ns-2.26. Technical report, Technical Report TKN-03-019, Telecommunication Networks Group, Technische Universitat Berlin, November 2003.
[3] OpenStreetMap, collaborative project to create a free editable map of the world, 2009. Available at http://www.openstreetmap.org. [4] A. Bohm, K. Lidstrom, M. Jonsson, and T. Larsson. Evaluating CALM M5-based vehicle-to-vehicle communication in various road settings through field trials. In IEEE 35th Conference on Local Computer Networks (LCN), pages 613–620, October 2010. [5] Q. Chen, F. Schmidt-Eisenlohr, D. Jiang, M. Torrent-Moreno, L. Delgrossi, and H. Hartenstein. Overhaul of IEEE 802.11 Modeling and Simulation in ns-2. In MSWiM’07: Proceedings of the 10th ACM Symposium on Modeling, analysis, and simulation of wireless and mobile systems, pages 159–168, New York, NY, USA, 2007. ACM. [6] D. R. Choffnes and F. E. Bustamante. An integrated mobility and traffic model for vehicular wireless networks. In ACM Workshop on Vehicular Ad Hoc Networks (VANET 2005), Cologne, Germany, September 2005. [7] S. Eichler. Performance evaluation of the IEEE 802.11p WAVE communication standard. In Proceedings of the Vehicular Technology Conference (VTC-Fall), Baltimore, MD, USA, September 2007. [8] K. Fall and K. Varadhan. ns notes and documents. The VINT Project. UC Berkeley, LBL, USC/ISI, and Xerox PARC, February 2000. Available at http://www.isi.edu/nsnam/ns/nsdocumentation.html. [9] M. Fogue, P. Garrido, F. J. Martinez, J.-C. Cano, C. T. Calafate, and P. Manzoni. Analysis of the most representative factors affecting Warning Message Dissemination in VANETs under real roadmaps. In 19th annual meeting of the IEEE International Symposium on Modeling, Analysis and Simulation of Computer and Telecommunication Systems (MASCOTS), Singapore, July 2011. [10] E. Giordano, R. Frank, G. Pau, and M. Gerla. CORNER: a step towards realistic simulations for VANET. In Proceedings of the seventh ACM international workshop on VehiculAr InterNETworking, VANET’10, pages 41–50, New York, NY, USA, 2010. ACM. [11] E. Giordano, E. D. Sena, G. Pau, and M. Gerla. Vergilius: A scenario generator for VANET. In IEEE 71st Vehicular Technology Conference-Spring, 2010. [12] J. Haerri, M. Fiore, F. Fethi, and C. Bonnet. VanetMobiSim: generating realistic mobility patterns for VANETs. Institut Eur´ecom and Politecnico Di Torino, 2006. Available at http://vanet.eurecom.fr/. [13] B. S. Kerner. Experimental features of self-organization in traffic flow. Phys. Rev. Lett., 81(17):3797–3800, October 1998. [14] D. Krajzewicz, G. Hertkorn, C. Rossel, and P. Wagner. SUMO (Simulation of Urban MObility) An open-source traffic simulation. In Proceedings of the 4th Middle East Symposium on Simulation and Modelling (MESM2002), pages 183–187, Sharjah, United Arab Emirates, September 2002. [15] S. Krauss, P. Wagner, and C. Gawron. Metastable states in a microscopic model of traffic flow. Physical Review E, 55(5):5597–5602, 1997.
��