Cytometry Part B (Clinical Cytometry) 72B:49–62 (2007)
A Relational Database for Management of Flow Cytometry and ELISpot Clinical Trial Data James S. Cavenaugh,1,2* Paul Snell,1 David Jeffries,1 Pauline A. Waight,1 and Samuel J. McConkey1,2 1
Nuffield Department of Clinical Medicine, John Radcliffe Hospital, University of Oxford, Oxford, UK 2 Medical Research Council Laboratories, Banjul, The Gambia
Background: Although relational databases are widely used in bioinformatics with deposited and finalized data, they have not received widespread usage among immunologists for managing raw laboratory data such as that generated by ELISpot or flow cytometry assays. Almost no published guidance exists for immunologists to design appropriate and useful data management systems. Methods: We describe the design and implementation of a Microsoft Access relational database used in a clinical trial in which the primary immunogenicity measures were ELISpot and intracellular cytokine staining. Results: Our data management system enabled us to perform sophisticated queries and to interpret our data as quantitatively as possible. It could easily be used without modification by other researchers using automated plate reading of ELISpot plates or four color flow cytometry. Conclusions: We illustrate in detail the use of a flexible data management system for two of the most widely used immunological techniques. Minor modifications for more colors or other outputs can easily be implemented. Based on this example, other modifications could be easily envisaged for any other quantitative output. q 2006 Clinical Cytometry Society Key terms: LIMS; ELISpot; Microsoft Access; relational database; FCS; FACS; flow cytometry; clinical trial
Although relational databases have evolved greatly over the last couple of decades, they have received very little use by immunologists for managing their primary laboratory data. For example, a search on PubMed for \immunology cytometry database" yields 37 articles, of which only two deal with the actual issues involved with designing the database (1,2). The consequence of this paucity is that immunologists have very little guidance by way of example for managing their increasingly complex data with modern software tools. This is evidenced by the observation that none of the flow cytometry or ELISpot counting software of which we are aware can output data directly to a database, although many do for Excel output (which can then be imported into a database). The reason for this lack is probably historical: in the past the quantitative assays available for immunologists were rather limited, and were often only semiquantitative as well, and the numerical values that were generated have typically been managed using spreadsheet programs. In addition, although relational databases have certain indisputable advantages over spreadsheets, they are more difficult to master and the benefits may not be immediately apparent to many immunologists, since after all, spreadsheets do work. The result is
q 2006 Clinical Cytometry Society
that the wrong tool may be used for the job: databases are intended to manage data, whereas spreadsheets are intended to perform convenient and flexible calculations \on the fly" for arrays of data. So if spreadsheets do work, then what are the advantages of using databases in their place? Quite simply, databases are designed to help ensure the integrity of the data that go in, and to have queries as useful tools to easily retrieve the desired information back out. The purpose of a database is to organize, store, and retrieve data as effectively as possible, whereas the purpose of a spreadsheet is to analyze and present data without regard to the underlying structure and inherent relation-
Grant sponsor: The Wellcome Trust. *Correspondence to (current address): James S. Cavenaugh; Department of Biostatistics and Computational Biology, School of Medicine and Dentistry, University of Rochester, 601 Elmwood Avenue, Box 630, Rochester, NY 14642, USA. E-mail:
[email protected] Received 7 December 2005; Revision 18 May 2006; Accepted 1 August 2006 Published online 1 November 2006 in Wiley InterScience (www. interscience.wiley.com). DOI: 10.1002/cyto.b.20146
50
CAVENAUGH ET AL.
ships that may be present in the data. The underlying critical difference is that the fundamental unit of data in a spreadsheet is the cell, whereas the fundamental unit of data in a database is the record. Accidental mismatch of fields across records is therefore far easier in spreadsheets than in databases. Databases also help to ensure data integrity by easy enforcement of referential integrity between related tables. Conducting a clinical trial only to have data that are not entirely trustworthy is a very costly mistake, and data management using spreadsheets is far more prone to errors creeping in over time as new data get added and occasional mistakes are found. Furthermore, spreadsheets are not designed to easily formulate queries of the data, which is an extremely useful feature of databases. In the present paper we describe a database that we developed and used in the course of two Phase II clinical trials for a therapeutic vaccine for chronic hepatitis B virus infection. The study participants were expected to come for the scheduled visits and sometimes came for unscheduled visits. Samples were taken at the beginning and throughout the study. Clinical information relevant to the study was double entered in an encrypted database. A tool was developed in house for comparing two versions of a database that have identical data structures (3), and this was used for reconciling differences between the double entries. Our primary measures of immunogenicity were ELISpot and intracellular cytokine staining (ICCS). These laboratory data were managed using a separate, nonencrypted database, described herein, that linked to the clinical database by donor number and sample harvest date. We first discuss general features of relational databases in the context of a longitudinal study such as a clinical trial, then illustrate in depth an implementation of these principles in our particular database handling ELISpot and flow cytometry data, and finally describe how they could be extended to other experimental techniques or to different trials. METHODOLOGY General Considerations for Immunological Database Design Tables. There are common entities for which any clinical trial or immunological database is likely to need tables or sets of tables: there are subjects (animals, patients, or donors), samples from the subjects, and potentially multiple assays (experiments) on the samples. Each of these entities must be uniquely identified and can have associated data. The so-called primary keys are fields which uniquely identify a record. (Duplicates and null entries are not allowed for primary keys. The primary key is useful for indexing, which speeds up queries.) While combinations of fields can be used as primary keys, it is often a good idea to use a single field as the primary key. The subjects’ data will usually be static information (e.g., gender, identification numbers, birth dates, fingerprints, HLA haplotypes), although some data (e.g., telephone numbers) could be allowed to change. Some subjects’ data may be confidential and
thus may require password protection. Measured subject data (e.g., weights) are better considered as experimental data and should appear in a separate table even if they do not arise from a sample. Samples should be identified uniquely by a serial number for simplicity and to speed queries, but they are characterized by their source, type (qualitative nature, e.g., plasma, serum, or cell type), collection time, and possibly special sampling details or their stage in processing. Data for the assays can include both the actual experimental results as well as metadata such as the experimenter, date, and relevant conditions (lot numbers of reagents, instrument settings, concentrations of cells or reagents, and so on). Finally there is also the issue of sample storage, which ought to be on the lowest level possible (e.g., at the level of individual cryovials’ exact locations and remaining contents). Relationships between tables. After defining the tables one must define the relationships between them. Figure 1 shows a generic relational schema that could be used with modifications to suit many immunologists’ needs. A subject can give more than one sample, but each sample must come from one subject (as one does not normally mix samples together), so there is a one to many relationship between subjects and samples, which is depicted in Figure 1 by the 1 and ? symbols on either side of the line joining the tables tblSubject and tblSample, respectively. Various things can be done with samples: they can be stored, used in experiments, discarded or given away, and they can be used to take further, smaller samples from them, as shown by tables in Figure 1. In general a sample can be used in more than one assay, and any one assay can include multiple samples. This results in a many to many relationship between the samples and the experiments in which they are used. This type of relationship is handled by a linking table for which both of the other tables linked by it are in a one to many relationship with it. In this table tblSampleExperimentUse is a linking table for tblSample and tblExperiment. This logically separates information pertinent to the sample itself (tblSample) from information pertinent to the usage of a sample in an experiment. Tables for sample storage should have links reflecting the usage history of the samples in experiments, as shown here in tblVialStorage. Input and output. After defining tables and relationships, one typically populates the tables with data and makes queries to retrieve the data. Forms which provide a structured means for manual data entry are highly recommended for reducing mistakes. Whenever possible, raw machine output should be imported automatically and stored directly to save time and to minimize errors. Derivable data should usually be calculated as needed from stored raw data rather than stored separately, unless that becomes problematic due to speed or memory considerations. Forms and reports can also be helpful by providing a current snapshot for items of interest in a polished format. The database will grow in complexity as needs arise, and often it is necessary to write code
Cytometry Part B: Clinical Cytometry DOI 10.1002/cyto.b
DATABASE FOR IMMUNOLOGICAL CLINICAL TRIAL DATA
51
FIG. 1. Hypothetical relationships table for many immunological needs. Starting from the left, a subject (tblSubject) can have multiple samples taken (tlbSample) and can also have repeated measurements taken that do not involve a sample (tlbSubjectAssay). The samples are distinguished from their usages, which can be as part of an experiment (the linking table tblSampleExperimentUsage), storage (tblVialStorage, which also links to tblExperiment, thereby allowing one to see in what experiment a stored sample was used), some other assay not counted as part of an experiment (tblSampleUsage1), or simply disposal (tblDisposal). In general, many things can be done with a sample and corresponding tables added as needed, including further sampling from existing samples. For example, tblSampleExperimentAssay represents a small sampling (such as for a cell count) from a larger sample taken from a subject. Primary keys are shown in bold font. (The primary keys refer to those quantities in a table which uniquely identify each record of that table. Duplicates and null entries are not allowed for primary keys. The primary key is useful for indexing, which speeds up queries.) [Color figure can be viewed in the online issue, which is available at www.interscience.wiley.com.]
to do exactly what one wants. The reader is referred to other texts for details particular to the software used [e.g., (4,5) for Access 2000, for which one can write code in Visual Basic for Applications (VBA)]. An Implementation for Our Clinical Trial Data Figure 2 shows the structure of our database illustrating the above principles. There are 17 tables shown, besides others used internally for forms. Since we were dealing with healthy volunteers, our subjects are called donors. The additional fields in tblDonor specify the cohort (Group), the day on which treatment was initiated or otherwise starting value for time (Day 0), and a field for any additional comments. A donor has an associated HLA haplotype (tblHLA) and gives multiple samples (tblSample). Each sample can be uniquely specified by the combination of donor, the time it was collected (i.e., the HarvestDate), and its qualitative type. Since we only took whole blood from subjects and no other sample types
Cytometry Part B: Clinical Cytometry DOI 10.1002/cyto.b
such as saliva or urine, we ignored the type as a field in tlbSample. Since the processing of whole blood produces PBMCs, serum, and plasma, Type does appear as a field in tblExperimentSampleUse, which pertains to the usage of a sample in an experiment and also represents further processing from the initial whole blood. Likewise, tblExperimentSampleCellCount is a small sampling from a larger sample in order to assay PBMC samples (count the cells) in tblExperimentSampleUse. A processed sample can be stored in one or more cryovials, as depicted by the one-to-many relationship between tblExperimentSampleUse and tblVialStorageUsage. A sample can have its cells counted more than once, so there is a one-to-many relationship between tblExperimentSampleUse and tblExperimentSampleCellCount. The latter table has the additional field CountNumber. This was based on manual counting using a hemacytometer, hence the fields for the number of small squares counted. The count number refers to which counting was done (first count, second count, etc.). A form was used to compute the cell count in millions.
52
CAVENAUGH ET AL.
FIG. 2. Relationships table for our clinical trial immunological data. The bottom panel shows the tables seen by scrolling the top panel to the right; they are a single set of relationships. The primary keys for each table are depicted in bold font. The upper right set of tables in the bottom screenshot depicts the flow cytometry tables, the lower right set depicts the ELISpot tables. Additional sets for other techniques could be included as necessary, branching off tblExperiment as these two do. Note that because tblExperiment does not include sample information itself, it is necessary to establish links between tblExperimentSampleUse and the appropriate levels of the respective techniques tables (tlbFACS_tubes and tblWellCount). [Color figure can be viewed in the online issue, which is available at www.interscience.wiley.com.]
Cytometry Part B: Clinical Cytometry DOI 10.1002/cyto.b
DATABASE FOR IMMUNOLOGICAL CLINICAL TRIAL DATA
53
FIG. 3. This is the frmPlateImport form. The first tab is used for importing the Excel data generated from AID EliSpot and allows specification of the count settings, the second tab allows specification of the samples and their locations in a 96-well plate, and the third tab allows specification of the peptide layout used for stimulating the samples. Validation rules prevent the importation of a plate if it has previously been imported, prevent the entry of a donor if it does not already exist in tblDonor, and prevent the entry of a sample if it does not already exist in tblSample. frmDonor allows entering new donors and samples. [Color figure can be viewed in the online issue, which is available at www.interscience.wiley.com.]
Cytometry Part B: Clinical Cytometry DOI 10.1002/cyto.b
54
CAVENAUGH ET AL.
FIG. 3. (continued)
Several samples (or rather their usages) can be used in an experiment, so there is a one-to-many relationship between tblExperiment and tblExperimentSampleUse. Alternatively, a sample can be stored for later use, as in tblVialStorageUsage. An experiment consists of various techniques performed on one or more samples. For our clinical trial two immunology techniques were commonly used: ELISpot and flow cytometry. (HLA typing was outsourced so we had only results.) Each of these methods is successively divided from the more general to the more specific level of detail. Each also lacks a direct chain of information from the sample to the most specific level of detail. This necessitates links from tblExperimentSampleUse to the appropriate levels of detail.
ELISpot Tables Design The highest level of ELISpot data pertains to the plate, as shown by the fields in tblPlate. The Quality field was used for general comments related to the overall plate quality (e.g., low or high background). Our plates had a standardized pattern for the samples, but the database was designed for greater flexibility in that different patterns could be chosen (reflected by the fields DonorPattern and PeptidePattern), and also different types of plates could be chosen, such as for plate brands or for designating cultured or ex vivo ELISpot. The next level
of ELISpot data is the reading (photography) of a plate on a particular plate reader. The fields associated with this table (tblPhotoSet) have names that hopefully are self-explanatory, as shown in Figure 2. After this, the next level of detail is the settings for which a given photograph is counted (tblCountSetting) using EliSpot 3.0c software (AID Autoimmun Diagnostika GmbH, Germany). The \Best" field is a yes/no data type that allows all readings to be stored but flags the data as to whether or not it should be used in queries or reports (in cases of multiple settings and hence different count outputs). Finally, the most important level of detail for the ELISpot data is at the level of the individual wells (tblWellCount). WellPos is the position of the wells in a 96-well plate layout. The SampleUsageID field identifies the well contents and links back to tblExperimentSampleUse in a many to one relationship. The Peptide field refers to the pool of peptides that were used to stimulate the cells in a particular well. The fields Spots, Av_surface, Av_intensity, Ov_Surf, Cytokine, and Saturation refer to the output values from the EliSpot 3.0c software, which can export the results in Excel format. These are then imported into the database using a form that has code attached to it for this purpose (Fig. 3). The fields Artifacts, Edited, and Comments are used in deciding whether or not the results of a particular well are acceptable as counted or if that well needed manual editing prior to exporting the data to Excel. Artifacts are a
Cytometry Part B: Clinical Cytometry DOI 10.1002/cyto.b
55
DATABASE FOR IMMUNOLOGICAL CLINICAL TRIAL DATA
Table 1 Statistics Exported for Batch Analysis
yes/no field for whether artifacts existed. Edited is a field for whether any actions were taken. Flow Cytometry Tables Design The flow cytometry branch of the experiments data is analogous to the ELISpot branch in that it progresses from the general to the specific. The database reflects the experimental steps performed in ICCS. Prior to staining, cells are first stimulated with peptides of interest, a positive control, or a negative control (medium). These stimulation details are in tblStimulation. Unlike in ELISpot, which has a well-defined plate layout, cell stimulations in ICCS occur in small containers (e.g., test tubes) without a well-defined geometric pattern. It is necessary to specify which stimulation was used for a given tube, which is done in tblFACS_tubes by the field StimulationID. SampleUsageID identifies the contents of each tube just as in tblWellCount for the ELISpot data. FL1Volume,. . ., FL4Volume refer to the volumes of stains used for the four fluorescent channels. (This obviously could be easily extended for instruments with more colors.) The other field names are self-explanatory. Although a single FACS tube normally is used to generate a single FCS file, it is possible to generate more than one such file from a single tube, so again there is a one-to-many relationship between tblFACS_tubes and tblFCS_files. In our project we used FCS Express version 2.0 (De Novo Software) to analyze the flow cytometry data generated by a four-color FACSCalibur machine (BD Biosciences). This software can export data as Excel files in report mode (i.e., using predefined cells for positioning the data) or in column mode as was done in our study, or as text files (which would also be easy to import) (Table 1). A form with code attached to it imports these files into the database. Because one cannot readily import flow cytometry data directly without first generating intermediate Excel or text files derived from plots, plots should be made for every relationship which would conceivably be of interest. Our instrument generated seven dimensional data (four colors, forward scatter, side scatter, and time). Any two of these could be plotted against each other. Obviously not all of these combinations are equally interesting, but deciding upon the choice in advance forces one to reimport and reanalyze the entire data set if one changes one’s mind. We found it easiest and most flexible to make dot plots for all possible interesting combinations (each color against every other color, and forward scatter versus side scatter) and then to use gates within these graphs and constraints on the queries or forms for retrieving the data of interest. For a four-color instrument there are six possible pair-wise color combinations. Each of these plots can be divided into four quadrants based on threshold values. Hence, the quadrant (or other defined region) is the lowest level of flow cytometry data, analogous to the well level of information in ELISpot data.
Cytometry Part B: Clinical Cytometry DOI 10.1002/cyto.b
Variable $Tot Patient ID Sample ID $Com Panel name Tube name $Fil $Date x-axis y-axis Gate Region (or quadrant) X mean (geometric) Y mean (geometric) Number of events
FCS keyword X X X X X X X X
Statistic (on plot basis)
X X X
Statistic (on region basis)
X X X X
The FCS keywords are static and could be derived from any graph of the data in an FCS file, so they are only output once for each FCS file. For each FCS file, we exported 8 FCS keywords. We also exported statistics from 13 plots: 12 fluorescence plots (each divided into 4 quadrants) and 1 plot for FSC vs. SSC, which is also divided into 4 regions (R1, R2, R3, R4). Each plot has 3 output statistics at the plot level and 4 statistics at the plot region (or quadrant) level. The total number of tracked items for each batch analysis for an FCS file is therefore 255 (¼ 8 keyword stats þ 13 plots*(3 stats/ plot þ 4 stats/region*4 regions/plot)). This is coincidentally the maximum number of columns that Excel permits.
Normally one uses forward or side scatter to define the coarsest level of cell population of interest, e.g. lymphocytes, and then gates on this population in subsequent graphs. We used a lymphocyte gate (called R1) based on forward and side scatter, but we also included the large granular lymphocytes in another gate (R2). Hence, the total lymphocyte population can pass through either gate R1 or R2 and is denoted 1o2. If one is interested in, say, IFN-g cytokine output, then one can choose the upper quadrants of a plot of IFN-g vs. some other antigen (e.g., CD3) and define a gate (R3) based on the upper quadrants of this graph. This uses one color as a gate. A remaining color can also be chosen as a gate (R4), and in our study we used the color for the next most common antigen to vary across the panels of stains. (If necessary, further gates can be defined and further graphs can be derived from them and the data from these regions imported into the lowest level of flow cytometry data in the database.) One can then make further plots of the above six color combinations, but with the additional restriction of the events being further gated by R3 or by R4. Representative plots are shown in Figure 4. A total of 13 plots were used for each FCS file: One of FSC vs. SSC for all cells, six of the different colors against each other for lymphocyte gating applied (1o2), and another six of the different colors against each other with the additional R3 or R4 applied, i.e., [(1o2)a3] or [(1o2)a4].
56
CAVENAUGH ET AL.
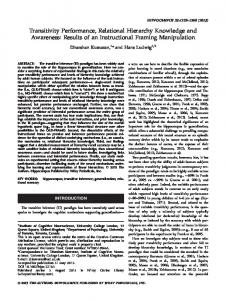
FIG. 4. Typical graphs used by FCS Express V.2.0 in generating the data for export to Excel. (This was for donor 077 in our experiment 221.) By our convention the X axis was always the lower of this list: FL1 > FL2 > FL3 > FL4 > SSC > FSC > time. For example, in plotting FL2 vs. FL3, FL3 would be the X axis and FL2 would be the Y axis, whereas in plotting FL3 vs. FL4, FL4 would be the X axis and FL3 would be the Y axis. FL1 can never be the X axis and time can never be the Y axis. FITC is an FL1 stain, PE an FL2 stain, PerCP an FL3 stain, and APC an FL4 stain. [Color figure can be viewed in the online issue, which is available at www.interscience.wiley.com.]
FCS Express V.2.0 allows one to collect three types of batch tracking information: pictures, keywords, and statistics. The keywords level of information exists at the level of the FCS file (6), so they are independent of a particular graph one may generate from
that file. Examples include the name of the file, the total number of data points collected, comment fields in the filename containing the patient or sample identification, and so on. These data were saved in tblFCS_files.
Cytometry Part B: Clinical Cytometry DOI 10.1002/cyto.b
DATABASE FOR IMMUNOLOGICAL CLINICAL TRIAL DATA
57
FIG. 4. (continued)
What is plotted in a graph is defined by the identities of the X and Y axes, the data source (indicated by the file name), and the gate information. This information belongs in tblGraphInfo. Since FCS Express V.2.0 lacks the ability to export axis identity (matching the quantity graphed to the x or y axis), we adopted a convention in order to avoid confusion when picking out quantities to be graphed using the FACS graphing tool (discussed below). Our convention is illustrated in Figure 4. The most detailed, lowest level of flow cytometry information that we considered was the region (or quadrant) of a graph. This appears in tblRegion_stats, as well as the associated statistics for the population of cells (i.e., cytometric events) inhabiting the region. The associated statistics are the number of events in the region and their X and Y means (arithmetic for linear scale used for time, FSC, and SSC; geometric for logarithmic scale used for FL1–FL4). The lowest level of cytometric information that is theoretically possible is at the level of the individual event, but importing that information would make the database size unnecessarily enormous. RESULTS Example of ELISpot Output The value of a database lies not only in the quality of the data that go into it but also in the ease of retrieving information back from it. Stored queries which summarize data for individual donors or entire cohorts allow easy retrieval and display of desired information. Forms can be used not only to input data but also to display in-
Cytometry Part B: Clinical Cytometry DOI 10.1002/cyto.b
formation. Reports typically are used for printed information. Figure 5 shows frmPatient, a form which displays summary information for a given donor. Besides stored samples and plate metadata for a given experiment, it also calculates the putative epitopes from pools of overlapping peptides in which each peptide is represented in two pools, assuming that the spot distribution between the wells containing peptide and the average of the background wells is purely by chance (the null hypothesis). It also shows the ELISpot results to date (net spots versus time). Flow Cytometry Output An especially useful form is the FACS graphing tool (frmRunPlotData), shown in Figure 6. This form allows one to pick from a pulldown list the cell phenotype quantities one wishes to graph versus time. It then automatically generates these graphs in Excel along with a query showing the graphed data. These quantities pertain to the cell counts in tblRegion_stats from the four quadrants in the FCS Express graphs. The \Select group" pulldown allows one to pick the cohort of interest to be graphed. The cell population of interest is a quotient in which the numerator and the denominator are derived from a series (in time) of some particular flow cytometry dot plots. These plots are defined by their X and Y axes and by their gates. The combination of quadrants defines the cell population of interest. It is assumed that the axes for the flow cytometry dot plots for the numerator and for the denominator are the same, but the gates may be different. The small squares next to the numerator
58
CAVENAUGH ET AL.
FIG. 5. Three tabs of frmPatient are shown. This form quickly summarizes the sample locations and ELISpot results for a given donor. The middle tab displays any putative epitopes at a given confidence level. The final tab shows ELISpot response kinetics for a given donor. [Color figure can be viewed in the online issue, which is available at www.interscience.wiley.com.]
Cytometry Part B: Clinical Cytometry DOI 10.1002/cyto.b
DATABASE FOR IMMUNOLOGICAL CLINICAL TRIAL DATA
59
FIG. 5. (continued)
and denominator are tick boxes, which correspond to the four quadrants from the FCS plots. Selecting these boxes includes cells from the corresponding quadrants. The stimulus pulldown restricts the cells to those of the desired stimulus. For example, if one wanted to display a plot versus time of total lymphocytes expressing IFN-g, one would choose for the denominator all the squares (corresponding to all the quadrants, i.e. all gated lymphocytes) and 1o2 as the gate. (Recall that this would select all cells satisfying either gate 1 (small lymphocytes gate) or 2 (large lymphocytes gate), hence all lymphocytes.) For the numerator one could again select all the quadrants but choose (1o2)a3 as the gate. This gate restricts the cells to those also satisfying gate 3, which is set by cells expressing IFN-g (see Fig. 4). For this particular example it would not matter which flow cytometry X and Y axes were chosen (as long as those antigen, stain combinations were faithfully performed over time and the results were flagged as acceptable in tblRegion_stats). Alternatively, for the numerator one could select some IFN-g, stain combination for the Y axis and then pick only the upper quadrants in the numerator region checkboxes. As another example one may be interested in what fraction of NKT cells express INF-g over the course of the trial. Anti-CD3, APC and anti-CD16, PE were commonly used in the panels of stains across the trial. (NKT cells will be operationally defined as CD3þCD16þ.) For
Cytometry Part B: Clinical Cytometry DOI 10.1002/cyto.b
this particular stain combination, the FCS X axis will be with the APC stain, hence CD3 and the Y axis will be CD16. Therefore the NKT cells will be in the upper right quadrant only (positive for both antigens). Choosing 1o2 as the gate for the graph restricts the cells only to lymphocytes, but choosing (1o2)a3 as the gate further restricts the cells to those expressing IFN-g, which is the defining characteristic for region 3. Therefore the NKT cells expressing IFN-g are those with the upper right box checked for both the numerator and the denominator but with the gates different, as shown in Figure 6, top panel. The bottom panel of Figure 6 shows the Excel graph that is generated. Archived Sample Tracking Anyone removing samples from liquid nitrogen or other cold storage wants to do so as quickly as possible and without the unpleasant surprises of not finding samples where they belong and finding samples where they do not belong. A printout showing all of the used and available spaces is a very useful tool in maintaining the accuracy of records for stored samples. Figure 7 is a report showing a tray layout of cryovials. This is convenient for checking off samples as they are used right at the place of storage and immediately seeing whether the actual available spaces are the same as those in the database.
60
CAVENAUGH ET AL.
FIG. 6. FACS graphing tool. VBA code was attached to frmRunPlotData which allows it to generate time series plots of cell populations defined by various antigen stains and gates in the course of a clinical trial. New graphs can be generated easily by simply clicking the pulldowns for the desired cell populations and pressing the Go button. [Color figure can be viewed in the online issue, which is available at www.interscience.wiley.com.]
Cytometry Part B: Clinical Cytometry DOI 10.1002/cyto.b
DATABASE FOR IMMUNOLOGICAL CLINICAL TRIAL DATA
61
FIG. 7. Stored samples at a glance. This screenshot of a report shows some of the locations of cryovial samples and available slots in the format of their tray layout. [Color figure can be viewed in the online issue, which is available at www.interscience.wiley.com.]
DISCUSSION Laboratory management information systems (LIMS) have traditionally been designed for managing data in analytical chemistry laboratories (including food and beverage, environmental, pharmaceutical, and quality control labs). They have evolved with computing and are an industry in their own right. They typically interface directly with sophisticated instruments. [http:// www.limsource.com/intro.html]. A full-featured commercial LIMS is involved from every step from initial receipt and logging of a sample to generation of final reports. Nevertheless, LIMS have not caught on in many immunology laboratories, whether from lack of marketing effort on the part of LIMS sellers, from inertia and continued use of spreadsheets for data management on the part of immunologists, or for other reasons. In those instances in which LIMS have been used in immunology laboratories, they have primarily been restricted to flow cytometry data only (e.g., flowLIMS from Fox Chase Cancer Center). Probably a major reason is that many LIMS are sold by instrument vendors without much concern for nondata intensive assays common in immunology labs (such as graft rejection or Western blotting, for example). These qualitative and semiquantitative assays are typically recorded in notebooks and are not
Cytometry Part B: Clinical Cytometry DOI 10.1002/cyto.b
integrated with the rest of the overall project. However, from a database point of view, it is these disparate techniques that are performed on samples, which often generate the complicated and interesting relationships, and which would still be useful if maintained in a projectoriented database. In this article we have described a relational database, which has proven useful for managing immunology laboratory data in the context of a clinical trial. The paradigm we have followed is that of a single project (the trial itself). This is composed of various cohorts, donors within those cohorts, samples from the donors, cell counts, and uses of those samples, including a frozen inventory, and a series of individual assays (the \experiments", although the trial itself is a single grand experiment). This paradigm is very widely useful even outside the context of a clinical trial, since every experimental study involving samples and numerical data derived from one or more techniques will fit this description. Hence, our database is easily extensible through the experiment table for additional techniques, such as quantitative PCR, microarray analysis, ELISA readings, and so on; each technique would engender a set of tables that mirrors the protocol actually followed, just as our tables for ELISpot and flow cytometry analyses do.
62
CAVENAUGH ET AL.
While it is somewhat difficult to give blanket advice that is generally useful to other scientists wanting to make a database for their projects, there are some lessons learned that are likely to be generally useful. The subtle distinction we made between a sample itself and the uses of a sample is likely to be broadly relevant. The fact that there is no direct connection between a sample and its appearance at the lowest experimental level (the tube in flow cytometry or the well in ELISpot), which necessitates a directly specified relationship between the usage of a sample and its experimental appearance, is also extremely likely to be relevant to other techniques as well. While each technique has its own subtleties, sample processing for most techniques typically follows a general to specific hierarchy in which initial steps are the same for many (or all) samples in an assay, but final data results must be taken at the level of individual wells, tubes, spots on an array, etc. A good rule is to break down the technique into tables which logically mirror the actual steps which an experimentalist would follow, paying special attention to the one-to-many and many-to-many relationships which can arise between these steps, just as we did for the ELISpot and flow cytometry techniques. Finally, for multiple readings of a sample, we recommend using a Best field (of yes/no data type) to flag its use in queries. Our database allows complicated SQL queries, has VBA code for both data import and data representation, and gives the user great freedom for modification as needed. It is not intended as a full-featured LIMS particular to some instrument, but it worked well for ELISpot and FACS data generated from an AID plate reader and a BD Biosciences FACSCalibur 4-color instrument, respectively. It allowed us to catch errors, greatly save time and greatly reduce errors by automatically importing data (tens of thousands of flow cytometry records that had been analyzed with flow cytometry software and 185 ELISpot plates that had been analyzed with ELISpot software, with perhaps roughly 2 min per sample in
data entry), inventory frozen cells, interface to our clinical and virological (quantitative PCR) databases, and generate sophisticated queries for identifying epitopes and graphical reports showing the longitudinal results for our volunteers. In summary, we have illustrated the design and implementation of a sophisticated yet low cost relational database aimed at managing two of the most common data-rich techniques that immunologists use. This example should be directly useful and should serve as a guide for immunologists wanting to make their own improvisations for other data, even for users of other database software (e.g., MySQL, which is free, nonproprietary, and has a facility called triggers which allows one to make an audit trail of any amendments to the database (inserts, deletions or changes to existing data) back to the person and time they were made; an audit facility is now part of good clinical practice). ACKNOWLEDGMENTS We thank Oxxon Therapeutics for providing the vaccines used in the clinical trials to which this database refers. We thank Rachel K. Richard for reading the manuscript and making suggestions, and we thank the reviewers for very helpful comments. LITERATURE CITED 1. Asare AL, Huda H, Klimczak JC, Caldwell CW. Integrating molecular diagnostic and flow cytometric reporting for improved longitudinal monitoring of HIV patients. Proc AMIA Symp 1998;952–956. 2. Jeffries D, Donkor S, Brookes RH, Fox A, Hill PC. Design and implementation of relational databases relevant to the diverse needs of a tuberculosis case contact study in The Gambia. Int J Tuberc Lung Dis 2004;8:1095–1099. 3. Kaye P, Jeffries D. Association of Clinical Data Management (ACDM) newsletter, Vol. 45. 2003. pp 14–16. 4. Andersen V. Access 2000: The Complete Reference. Berkley, CA: Osborne/McGraw-Hill; 1999.1319 pp. 5. Smith R, Sussman D. Beginning Access 2000 VBA. Birmingham, UK: Wrox Press; 1999. 6. Seamer LC, Bagwell CB, Barden L, Redelman D, Salzman GC, Wood JC, Murphy RF. Proposed new data file standard for flow cytometry, version FCS 3.0. Cytometry 1997;28:118–122.
Cytometry Part B: Clinical Cytometry DOI 10.1002/cyto.b