A Relational Database for Student Course Evaluation. Dr. Khaled Nassar ..... Furthermore, File Maker is a relatively robust and easy database system to learn.
A Relational Database for Student Course Evaluation Dr. Khaled Nassar Associate Professor, Department of Architectural Engineering University of Sharjah Sharjah, UAE
Dr. Amir Al-Khafaji Professor and Chairman Department of Civil Engineering and Construction Bradley University Peoria, IL
Evaluating the teaching performance of the faculty is an integral part of the academic process with major implications on the careers of the faculty and institutions involved. Student course evaluation represents an important metric for assessing the teaching performance of the faculty. However, evaluating the teaching performance of the faculty through student course evaluations poses several challenges and issues. It is important to accurately assess the faculty teaching, while minimizing grade inflation. The process of evaluating teaching performance through student course evaluations should be fair and rational, in addition to being carried out as promptly as possible. This paper presents a computerized system for the collection and analysis of student course evaluations. The different issues and problems involved in the course evaluations process are discussed. The various metrics that can be used to assess the student course evaluations are also presented. Keywords : Teaching Evaluation, Student Course Evaluation, Relational Databases
Introduction An American Society of Civil Engineers Task Force proposed a "wheel" model for faculty work and evaluation purposes (Al-Khafaji, A. W., et al., 1998). The model provides complete flexibility through interfaces that allow for scholarly work to be integrated into research, teaching, and service and professional development activities (Al-Khafaji, A., & Rebholz, E. F., 2000, Al-Khafaji, A., & Seckler 2000). One of the cornerstones of the model used for partially assessing faculty’s teaching performance is student course evaluation, which are handed out to students at the end of a course and used to assess the teaching performance of a faculty member. In order to compute the specific metrics to assess teaching quality, faculty course evaluations have to be collected and analyzed. However, even in an average size department, the amount of data analyzed can be overwhelming (ASCE 1995). For example, in a department with 15 faculty members, each teaching an average of 3 courses with an average of 20 students per course, there would be 900 student evaluation forms per semester. Furthermore, in order for the faculty evaluation process to be comprehensive, fair, and consistent, the process must assess the longterm performance of the faculty and not just for a specific semester (Boyer 1990, Hall et al 1988). Clearly, the amount of data that needs to be collected and stored increases significantly with each passing year. Most academic departments therefore consider only the faculty performance over a single year (ENR 1996, Diamond and Adam 1993, Eugene 1991). In addition only basic measures are calculated and used to evaluate the faculty, usually in terms of average scores of the data analyzed. Faculty have always complained of the short slightness and rigidity of average scores of course evaluations. Actually, average scores alone fail to capture
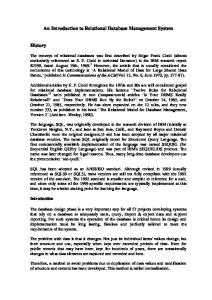
several of the essential evaluation aspects and suffer from several problems. For example, the effect of the number of students in the class is not shown in the average (a class with two students and a low faculty evaluation score, versus a larger class with a better faculty evaluation score). In addition, unethical grade inflation may turn the process into a popularity contest instead of an actual measure of the faculty performance. However, several more meaningful metrics can be calculated from the student course evaluations are used to assess faculty teaching performance in any academic department. These metrics can provide a consistent and rational basis for evaluating the faculty teaching performance. In addition, the process of calculating teaching performance metrics can be computerized to save time and to enhance its utilization in other facets of the assessment and evaluation functions of academic departments. Relational Databases provide a very well suited model for automating the process described above. This paper presents the implementation of a faculty teaching evaluation model using relational databases to automate data collection and analysis. A software tool is developed to aid in calculating and analyzing the faculty course evaluations. In this paper, a description of the developed assessment tool is provided. The tool is implemented using a commercial database management system (DBMS) and is packaged as a stand-alone package that can be used by any academic department that implements the proposed model. Furthermore the DBMS selected is platform independent and therefore can be used more flexibly in academic departments using different computer platforms. The Student Course Evaluation Model In this section, the adopted student course evaluation model is presented. This is followed by a description of the computer implementation then conclusions and recommendations for future extensions. Given the evaluation forms, a number of metrics can be computed from these forms. The raw average score can be converted into a simple weighted average, a normalized average or a composite average, as described next. Usually the first step in analyzing the student course evaluations is to calculate an average score for each course based on the individual scores given by every student for each of the questions on the evaluation form for a specific course. This is a straightforward process where the average score for each student is calculated, and then an overall average for all the students in a particular course is determined.
x STUDENT EVALUATIONS
RAW AVERAGE
=
NORMALIZED SCORE
COMPOSITE SCORE
AVEGARE STUDENT GRADES
Figure 1: The Three Course Evaluation Performance Measures
The second step in analyzing the student course evaluations for each faculty is to calculate an aggregated average for all the courses that each of the faculty members taught in a particular semester. This can be calculated as a simple average for all the courses taught. However a simple average does not take into consideration two important aspects of the evaluation. Courses with a larger number of students generally require more time and effort to teach and therefore should be assigned more weight. In addition courses that carry a higher credit hour should also be accounted for. Therefore, a more realistic score is calculated by determining a weighted average in terms of the number of students and the credit hours for each course. This is calculated as:
∑
N
Weighted Score for a Faculty =
Where, AES NOS CH N
i =1
AESi × NOS i × CHi
∑i =1 NOSi × CHi N
(1)
average evaluation score (raw) number of students Credit Hour number of courses that a faculty taught in a semester
The weighted score tends to reflect more closely the faculty performance in a particular semester or year. Nevertheless, the weighted score still is susceptible to grade inflation and it is very easy to slip into a grade inflation situation. Unfortunately, the use of the weighted score by itself may cause grade inflation. Therefore a normalized score can be used. The normalized score takes into account the average grade that a faculty member gave to his/her students in a particular score as well as the average student evaluations score in that course. For example, suppose a certain faculty was evaluated by his student and was given an average score of 3 (out of 4). In the same the average grade for the students was a B (i.e. 3 out 4), then the normalized score for that faculty for that course would be 3/3 = 1. Another faculty in the same section was evaluated by his students and also given a score of 3. However, the second faculty inflated his grades and gave all his/her students an “A” grade (i.e. 4 out 4). The second faculty would then ha ve a lower normalized score of ¾ = 0.75.
The normalized score for a particular faculty is then calculated as the average student course evaluation divided by the average grade given by the faculty in a particular course. The normalized score standardizes the evaluation of faculty based on the grade they assign to their students and is determined for a faculty member in a particular semester or year as: N AESi ∑ i =1 AGi × NOS i × CHi Normalized Score for a Faculty = (2) N NOS i × CH i ∑i=1 Where
(
)
AGi = Average grade for course i Thirdly, a composite score that averages out both scores can be calculated as:
∑
N
Composite Score for a Faculty =
i =1
[(AES AG )× AES ]× NOS × CH i
∑
N
i
i
NOS i × CHi i =1
i
i
(3)
Although these metrics provide a comprehensive picture of the faculty teaching performance, these metrics may not be suitable for all the departments all the time. Different departments may choose to adopt different metrics. In fact, a department may vote to adopt a particular metric (or a set of metrics) and upon re-evaluation may decide to consequently change the decision at a later time. The use of these metrics provides a comprehensive picture of the faculty teaching performance based on student course evaluation, while attempting to minimize grade inflation. It is also important to note that student course evaluation is only one measure in assessing the teaching performance of a faculty member.
Figure 2: The Main Menu of the Evaluation Manager As was mentioned earlier, in an average size department, determining various course evaluation metrics for the different faculty require significant time to compute. To address this limitation a
computerized tool that automates the collection and calculation of these metrics was developed as described in the next section. Computer Implementation A computerized tool, the Assessment Manager, was developed to automate the process of calculating the different metrics and scores. The tool has several functionalities that aid administrators in academic departments to analyze course student evaluations. Course evaluations forms for the different faculty can be entered and stored in the system as well as faculty information and schedules. Using the Assessment Manager, administrators can select a particular semester or academic year and the different metrics will be automatically calculated. Assessment Manager is useful for keeping track of the long-term performance of the faculty as the user can filter and track faculty performance over a particular semester or a period. In addition the system allows for all the traditional database sorting and filtering capabilities. The user can sort for faculty according to a certain metric for a particular semester, year or cumulatively over the their tenure. In addition the system allows for automatically generating and printing memos to communicate the results with the faculty on a semester on annual basis.
Figure 3: Entering course evaluations Assessment Manager also allows users to print course evaluation forms with summarized averages for each of the question on the evaluation form. This can be done for every course and
given to the faculty for in order to pin point areas of weakness in certain questions across and consequently suggest areas of improvement. This is helpful to faculty and chairpersons in that it allows them to identify the weakest areas in a given a course by considering the lowest scores on any given question. One of the benefits of the software is that previous faculty performance can be stored for the duration of his tenure and faculty performance can be analyzed on the long term and not just for a specific semester. Therefore, improvement and consistent performance can be encouraged and appropriately measured. This information can also be retrieved and used when making decisions on course assignments. Decisions can be made not only on the previous semester performance but also for any period of time. If a faculty historically tends to perform well on a specific course versus another faculty member then the decision on assigning the course to a particular faculty can be made more rationally. Faculty teaching effectiveness and ranking can be computed using any of the three metrics identified earlier. That is, faculty rank can be computed in terms of simple average, normalized average to identify easy graders, and composite scores to assess the best performers in the department. When designing the student course evaluation form, a number of topics need to be covered. These topics include preparation and grasp of the covered material, the availability and the office of hours of the faculty, fairness and grading procedures, as well as presentation and communication skills. The course work throughout the semester is a major component in the overall assessment of students as well as their final grades, and therefore, a question about the grade the students expects is commonly included in the course evaluation form. It is generally preferred that in order to maintain consistency, the same questions on the evaluation forms for all courses are maintained. In addition, all the forms should have the same evaluation scale (i.e. from 1 to 4 or from 1 to 5, etc). However, it might be necessary to add or delete certain questions in specific courses. Therefore, the Assessment Manager tool is versatile enough to permit students to skip answering any of the questions provided and the metrics are also reevaluated. The tool was developed using File Maker Developer and its scripting language, which is a relational database management system that can be used to store up to 10,000 records. It is a multiplatform system, which means the system can be shared among different users without limitations of operating system. Furthermore, File Maker is a relatively robust and easy database system to learn.
Figure 4: The Summary View
Conclusions and Recommendations This paper offers a method to more accurately assess teaching effectiveness. To measure teaching ability, a model has been introduced that normalizes the student course evaluation scores. This compensates for the grade inflation in a course and lessens its impact on faculty performance. The method is adjusted for the obvious difference in grading expected for graduate level courses when compared to undergraduate courses. Teaching effectiveness is often considered in a very subjective manner. Student evaluation rankings are often utilized in programs, but there are some obvious weaknesses in using only this method. Common criticisms are that a faculty member may be awarding high grades or using other popularity factors to influence the rankings. These abuses make it difficult to get meaningful quantifiable data for assessment. The long-term distribution of the scores for the particular course gives more accurate picture of the faculty performance. That is why, a system such as the one described here should allow for two things: Firstly, the performance of a faculty member is plotted for the last few years he/she was teaching the course. Secondly, the calculations should take into effect the average score for that particular class over its teaching history. What this does is normalizes the score for each particular class and thus takes into effect the class rank (freshman, sophomore, junior, senior), the difficulty level of the class, as well as type (required or elective course). An important limitation of the system is the presence of outliers. The number of D and F students would result in outlier score, (especially if they are mapped to an extreme GPA scores, e.g. an F = 0). A possible solution would be to report the
number of D and F students along with the composite score, to give a better idea about the class and instructor performance. The other point to note is that the composite score actually lessens the effect of student grades in the class by essentially weighting it against the actual teacher evaluation. It is especially important to help new faculty with the necessity of good teaching, as they are often hired without teaching experience. Junior faculty members may pursue research because of their most recent educational experience, and may seldom possess the tools to effectively teach a course. A senior faculty member who can be a role model for teaching excellence chairs the committee and meets regularly with the group to address common issues such as course outline developme nt, grading practices, homework expectations, and other concerns in teaching. This paper also offers suggestions to benefit the experienced faculty member in their quest to excel. Each faculty member makes a self-reporting critique after examining the student evaluations. The faculty makes a response for each course taught. The response, as a minimum, includes addressing the lowest rated categories as well as improvement plans for the future. Comparisons are provided for each faculty member on their evaluation scores versus the department as a whole. Easy grading could be problematic in fairly assessing faculty teaching performance. The issue is obviously improving quality rather than just popularity. An effective teaching evaluation tool can permit a faculty to receive guidance and to introduce improvements. Finally, senior faculties also receive encouragement to realistically examine their accomplishments and needs by comparison to others as well as studying trends. In this paper, different metrics for assessing the teaching performance of faculty members through student course evaluations were presented. In addition, Assessment Manager, a database tool developed to assist administrators in analyzing student course evaluations was presented. Possible future extensions to the Assessment Manager include, integration with other outcomes and assessment procedures and tools as well as adding charting capabilities to enhance the presentation of the analyzed data.
References
Al-Khafaji Amir, Samuel Clemence, Vincent P. Drnevich, Michael Kupferman, Thomas A. Lenox, William F. Marcuson, Iii, Gayle Mitchell, James T.P. Yao (1998). The Scholarship Landscape in Civil Engineering: A Bridge Between Rhetoric and Reality, Report of the ASCE Task Force on Redefining Scholarly Work, Reston, VA, 46p. Al-Khafaji, A., & Rebholz, E. F. (2000, Spring). The quest for excellence and faculty assessment, Journal of Construction Education, 5(1), 43-56
Al-Khafaji, A., & Seckler, J. G. (2000). The challenges and rewards of outcome assessment, Journal of Construction Education, 5(1), 30-42 American Society of Civil Engineers ASCE, (1995). Summary Report of the Civil Engineering Education Conference, ASCE (Sponsored in cooperation with the National Science Foundation, Denver, Colorado. Boyer, Ernest L., (1990) Scholarship Reconsidered: Priorities of the Professorate. Princeton, NJ: Carnegie Foundation for the Advancement of Teaching. Diamond, Robert M. and Bronwyn E. Adam, (1993) Recognizing Faculty Work: Reward Systems for the Year 2000. San Francisco: Jossey-Bass. Engineering News-Record (September, 1996). Shaking Up Education. Publication of the McGraw-Hill Companies. Hall W. J., Focht J. Jr, Michael H., Paulson B., Saville T., and Lowe, (1988). Civil Engineering in the 21st Century: A vision and a challenge for the Profession. Prepared by the Task Committee to plan conference on Civil Engineering Research Needs. Produced by the American Society of Civil Engineers. Rice, R. Eugene, (1991). The New American Scholar: Scholarship and the Purposes of the University. Metropolitan Universities Journal, 1 (4): 7-18.