WORKING PAPER 131
A Review of Hydrology, Sediment and Water Resource Use in the Blue Nile Basin Seleshi Bekele Awulachew, Matthew McCartney Tammo S. Steenhuis and Abdalla A. Ahmed
Postal Address P O Box 2075 Colombo Sri Lanka Location 127, Sunil Mawatha Pelawatta Battaramulla Sri Lanka Telephone +94-11 2880000 Fax +94-11 2786854 E-mail
[email protected] Website http://www.iwmi.org
SM
International Water Management I n s t i t u t e
IWMI is a Future Harvest Center supported by the CGIAR
ISBN: 978-92-9090-699-5
International Water Management I n s t i t u t e
Working Paper 131
A Review of Hydrology, Sediment and Water Resource Use in the Blue Nile Basin
Seleshi Bekele Awulachew Matthew McCartney Tammo S. Steenhuis and Abdalla A. Ahmed
International Water Management Institute
IWMI receives its principal funding from 58 governments, private foundations and international and regional organizations known as the Consultative Group on International Agricultural Research (CGIAR). Support is also given by the Governments of Ghana, Pakistan, South Africa, Sri Lanka and Thailand. The CGIAR Challenge Program on Water and Food (CPWF) supported the work reported here; the Cornell University (CU), USA, and the Omdurman Islamic University, UNESCO Chair in Water Resources (OIU, UNESCO-CWR), Sudan, have contributed to this paper.
The authors: Seleshi Bekele Awulachew is IWMI’s regional representative for the Nile Basin and Eastern Africa and Senior Researcher, Matthew McCartney is a Senior Researcher at IWMI, Tammo Steenhuis is a Professor at Cornell University, USA, and Abdella A. Ahmed is a Professor at OIU, UNESCO-CWR.
Awulachew, S. B.; McCartney, M.; Steenhuis, T. S; Ahmed, A. A. 2008. A review of hydrology, sediment and water resource use in the Blue Nile Basin. Colombo, Sri Lanka: International Water Management Institute. 87p. (IWMI Working Paper 131)
/ hydrology / sedimentation / river basins / water supply / water demand / climate / models / runoff / erosion / irrigation programs / reservoirs / Africa / Sudan / Ethiopia /
ISBN 978-92-9090-699-5
Copyright © 2008, by IWMI. All rights reserved. Please direct inquiries and comments to:
[email protected]
ii
Contents Acknowledgment ......................................................................................................................... iv Summary ................................................................................................................................ v 1. INTRODUCTION ................................................................................................................ 1 1.1. COOPERATIVE MANAGEMENT OF TRANSBOUNDARY BASINS-GLOBAL CONTEXT ..................... 1 1.2. THE STATE OF TRANSBOUNDARY BASINS IN AFRICA AND THEIR POTENTIAL ........................ 1 1.3. THE NILE RIVER BASIN ................................................................................................... 3 1.4. THE PROJECT RATIONALE ................................................................................................. 6 1.5. SPECIFIC PROJECT COMPONENTS OF MODELING SEDIMENT AND WATER SUPPLY, AND DEMAND AND SUPPLY ............................................................................................... 7 1.6. OVERVIEW
OF THIS
REPORT .............................................................................................. 7
2. BLUE NILE PHYSIOGRAPHY .......................................................................................... 8 2.1. CLIMATE ........................................................................................................................ 11 2.2. GEOLOGY ....................................................................................................................... 16 2.3. SOILS ............................................................................................................................ 16 2.4. LAND COVER AND VEGETATION ....................................................................................... 18 3. HYDROLOGY OF THE BLUE NILE .............................................................................. 19 3.1. FLOW ............................................................................................................................ 19 3.2. HYDROLOGICAL MODELS ................................................................................................ 23 3.3. RUNOFF MECHANISMS ..................................................................................................... 24 3.4. PROPOSED MODELING STRATEGY FOR THIS STUDY .............................................................. 25 4. SOIL EROSION AND SEDIMENTATION ...................................................................... 27 4.1. BACKGROUND ................................................................................................................. 27 4.2. EROSION AND SEDIMENT PROBLEMS IN THE BLUE NILE ................................................... 28 4.3. EROSION AND SEDIMENT DATA ........................................................................................ 29 4.4. ESTIMATE OF SEDIMENT INFLOW TO SUDAN ..................................................................... 32 4.5. SUMMARY OF SEDIMENT RESULTS FROM PREVIOUS STUDIES ON THE BLUE NILE ................. 32 4.6. RESERVOIR SEDIMENTATION AND POTENTIAL MITIGATION MEASURES ................................ 33 4.7. SEDIMENTATION OF IRRIGATION NETWORKS ...................................................................... 35 4.8. THE CHALLENGES .......................................................................................................... 37 4.9. PROPOSED MODELING STRATEGY FOR THIS STUDY .............................................................. 37 5. WATER RESOURCES DEVELOPMENT ....................................................................... 39 5.1. CURRENT SITUATION ....................................................................................................... 39 5.2. FUTURE DEVELOPMENT ................................................................................................... 41 5.3. PAST MODELING OF THE wATER RESOURCES OF THE BLUE NILE ...................................... 44 5.4. PROPOSED MODELING STRATEGY FOR THIS PROJECT ........................................................ 45 6. DISCUSSION/RECOMMENDATIONS ........................................................................... 47 7. APPENDICES .................................................................................................................... 49 7.1. APPENDIX 1: LIST OF METEOROLOGICAL DATA STATIONS IN ABAY-BLUE NILE .................. 49 7.2. APPENDIX 2: LIST OF HYDROLOGICAL STATIONS IN BLUE NILE ........................................ 54 7.3. APPENDIX 3: MODELS FOR BLUE NILE AND NILE ............................................................ 60 7.4. APPENDIX 4: LIST OF SEDIMENT STATIONS AND DATA AVAILABILITY (ETHIOPIA AND SUDAN) .................................................................................................. 73 References .............................................................................................................................. 76
iii
Acknowledgement This report is based on an output of the project, “Improved water and land management in the Ethiopian highlands and its impact on downstream stakeholders dependent on the Blue Nile”, funded by the CGIAR Challenge Program on Water and Food (CPWF) and implemented by the International Water Management Institute (IWMI) in collaboration with the International Livestock Research Institute (ILRI), Cornell University (CU), Addis Ababa University (AAU), Bahir Dar University (BDU), Omdurman Islamic University-UNESCO Chair in Water Resources (OIU, UNESCO-CWR), Amhara Regional Agricultural Research Institute (ARARI) and the Forum for Social Studies (FSS) with further cooperation from the Ethiopian and Sudan institutions and the Nile Basin Initiative. We are very grateful to the CPWF and its staff members for providing us with the opportunity to do this work. We hope that the report and accompanying outputs will be useful to the CPWF and to others considering investment in water management for improved livelihood and environment in river basins in general and the Nile Basin in particular. IWMI is also grateful to officials from the various institutions in Ethiopia and Sudan as well as the Nile Basin Initiative, particularly the Eastern Nile Technical Regional Organization. A number of officials from regional/provincial governments also took a lot of time to provide information and we are grateful to all of them. With all this input, however, the authors remain responsible for the contents of this report.
iv
Summary This report presents a comprehensive literature review and broad-based analysis of the water resources of the Blue Nile (Abay) River. This work was undertaken as the initial phase in a study to evaluate approaches for improved land and water management in the Ethiopian highlands and assess the likely implications for downstream stakeholders in Sudan. Data and information have been compiled in relation to hydrology, sediment and water use in the basin. Section 1, Introduction, provides a context through the consideration of water resources both in Africa and the whole of the Nile Basin. Section 2, Blue Nile Physiography, presents an overview of the characteristics of the Blue Nile Basin, including a description of the meteorological monitoring network and the availability of historic data. It also reviews the geology, soil and land-use, and land-cover of the basin based on secondary sources. Section 3, Hydrology of the Blue Nile, describes the hydrology of the Blue Nile, including seasonal variation and trends over time. A summary of past hydrological modeling in the Nile and the Blue Nile is also presented. Section 4, Soil Erosion and Sedimentation, focuses on erosion and sediment transport and presents an overview of sediment in the major tributaries, including seasonal variations and trends over time. Section 5, Water Resource Development, reviews existing water resource development in both Ethiopia and Sudan and discusses the future potential with respect to major water uses (i.e., irrigation and hydropower). Section 6, Discussion/ Recommendations, provides a summary of the research methods and models to be used in the study. The reference materials collated and listed at the end of this report provide an important resource for water management and future research to be undertaken in the basin.
v
vi
1. INTRODUCTION The project “Improved water and land management in the Ethiopian highlands and its impact on downstream stakeholders dependent on the Blue Nile” is being undertaken as part of the CGIAR Challenge Program on Water and Food (CPWF). The aim of the project is to provide insight into the likely downstream impacts of upstream development and watershed management options. The project is being conducted through a collaboration of partners from global institutions, advanced universities from the north and institutions in both Ethiopia and Sudan, including IWMI, ILRI, Cornell University, Addis Ababa University, Omdurman Islamic University-UNESCO Chair in Water Resources, Bahir Dar University Forum for Social Studies and Amhara Regional Agricultural Research Institute. The aim of this report is to provide a context for the study and baseline information on the basin as well as a rationale and description of the methods to be used.
1.1. Cooperative Management of Transboundary Basins - Global Context The world’s 263 transboundary basins cover nearly half of the earth’s surface (excluding Antarctica), produce around 60% of global freshwater flow and are home to approximately 40% of the world’s human population. In the past, much of the political interest in transboundary basins has focused on their potential to increase international tension and conflict. However, it is increasingly recognized that transboundary rivers can serve as a focal point for cooperation and security between riparian states and act as an engine for shared economic growth and poverty alleviation. In fact, it is now widely recognized that the cooperative potential of transboundary basins is far greater than their potential to increase conflict. Nonetheless, achieving this cooperation requires overcoming tension between the water use desires of upstream and downstream riparians. One method by which this tension may be overcome is to move thinking, negotiations and actual practice beyond the zerosum game of water allocation and towards the broader concept of sharing water benefits (Sadoff and Grey 2002). There are now numerous examples from around the world of the formation of transboundary institutions to facilitate benefit sharing between riparians. However, the institutional framework which best facilitates cooperation within any particular basin, depends on the specific hydrologic, economic and political nature of the basin as well as the goals and desires of the basin governments and their populations.
1.2. The State of Transboundary Basins in Africa and Their Potential Africa is the world’s second-largest and second most-populous continent, after Asia. At about 30,221,532 square kilometers (km²), it covers 6.0% of the Earth’s total surface area, and 20.4% of the total land area. With more than 900,000,000 people (as of 2005) in 61 territories, it accounts for about 14% of the world’s human population. The continent is surrounded by the Mediterranean Sea to the north, the Suez Canal and the Red Sea to the northeast, the Indian Ocean to the southeast, and the Atlantic Ocean to the west. There are 46 countries including Madagascar, and 53 including all the island groups (Wikipedia 2007). In Africa, the potential for using benefit sharing in transboundary water management and development is tremendous. With the exception of island states, every African country has territory in at least one transboundary river basin. Transboundary basins cover 62% of Africa’s total land area, and virtually every basin greater than 50,000 km2 crosses at least one national boundary. Because of the transboundary nature of most of the continent’s rivers, most African water management is, by definition, transboundary water management (Lautze and Giordano 2006).
1
The continent of Africa is rich in natural resources including water resources. Yet, the exploitation of water is shrouded in complex parameters ranging from boundaries demarcated by colonial powers in response to political, military and economic interests to a bewildering diversity of factors relating to unstable rainfall regimes, annual and seasonal flow variations and numerous basins and catchments. Despite the abundance, water resources, they are (like most other natural resources) not exploited to the full extent possible or properly developed, managed and utilized (UNECA 2000). Nearly 80 major transboundary rivers/lake basins are located in Africa. Seventeen of these have catchment areas of more than 100,000 km2 and some are shared by as many as ten countries. The entire surface area of some fourteen African countries falls within one or more transboundary river/ lake basin (UNECA 2000) (Figure 1). The central rain forest belt, lying on either side of the equator, has high annual precipitation and is the source of some of the largest river systems in the world (e.g., the Congo, the Nile and the Zambezi). In contrast, some of the driest parts of the world (e.g., the Sahara and Kalahari deserts) are also found in Africa. Much of the continent faces the challenge of recurrent drought, severe flood and desertification, a challenge which is likely to be exacerbated by climate change.
FIGURE 1. River and lake basins in Africa (Source: UNECA 2000).
Therefore, Africa needs to adopt the integrated water resources management process which requires all forms of water to be considered. Water can be roughly grouped into two categories: Blue water (i.e., the water resources contained in rivers, lakes and accessible groundwater), and green water (i.e., the rainwater stored in the soil and subsequently transpired by plants). The scarcities and shortages forecasted in many reports refer mainly to the blue water and do not account for the potential of green water use in agricultural production. The latter, if well utilized through proper
2
watershed management, can make a great difference regarding the socioeconomic development in the upstream areas as well as in the downstream areas. In most of sub-Saharan Africa, the great bulk of food production is not related to “blue” water use, but is, in fact, produced with “green” water in rainfed agriculture. As an example, in Ethiopia, more than 90% of the food is produced with “green” water in rainfed agriculture. Still, most research, like in all other African countries, is related primarily to blue water usage. This is based partly on an old paradigm promoted during the green revolution: By breeding better crops on irrigated land (or without regard for water needs) the world’s food problems can be solved. Neither the breeding of better crops in irrigated land nor the management of rainwater for agriculture is done effectively in Africa. Despite the huge success of the green revolution (especially in Asia), the African continent remains behind the rest of the world in crop production and, consequently, cannot meet the basic food needs of its population. The green revolution in Asia was primarily the result of: i) improved soil fertility management, ii) the introduction of high yielding varieties, iii) better water management, including irrigation development with surface water, groundwater and rainwater, and iv) favorable economic conditions arising from the high market price of agricultural produce. Investment in these areas has been very limited in Africa and the continent has largely been bypassed by the green revolution. Solutions combining various measures are needed and, in addition to the development of the blue water resources, emphasis needs to be placed on increasing the productivity of the green water. The Comprehensive Assessment of Water Management in Agriculture discusses details of the whole continuum of management of water for agriculture including upgrading rainfed systems (Molden 2007). Unlike blue water, where it is not uncommon for one engineering solution to solve a number of problems, green water optimization is complicated by many factors, including societal needs, climate, and environmental conditions, all of which vary greatly across the African continent. Hence, each region has its unique solution for optimizing water use. For example, in Ethiopia, where most of the agricultural production is dependent on rainfall, one of the most obvious solutions is to store more rain in the soil by increasing the infiltration capacity. On the other hand, little attention is given to rainfed agriculture in research studies.
1.3. The Nile River Basin The Nile River, at 6,825 kilometers (km), is the longest river in the world (http:// www.britannica.com). Ahmed and ElDaw (2004) reported that the length of the Nile River from its remotest point is 6,671 km. It comprises two major tributaries, the White Nile and the Blue Nile (known as the Abay in Ethiopia). The White Nile rises in the Great Lakes region of Central Africa, with the most distant source in southern Rwanda and flows north from there through Tanzania, Lake Victoria, Uganda and southern Sudan. The Blue Nile starts at Lake Tana in Ethiopia, and flows into Sudan from the southeast. The two rivers meet near the Sudanese capital, Khartoum, and flow north through Sudan and Egypt to drain into the Mediterannean Sea. The drainage area is officially described by the Nile Basin Initiative (NBI 2007) as 3 million km2, but the values given by various authors vary: 3.255 million km2 (Revenga et al. 1998), 3.3 million km2 (CPWF 2007), 3.1 million km2 (FAO 2007), etc. The ten countries that share the Nile River Basin are: Burundi,
3
Democratic Republic of Congo (DRC), Egypt, Eritrea, Ethiopia, Kenya, Rwanda, Sudan, Tanzania and Uganda. The Nile River Basin is home to approximately 180 million people, while over 350 million (based on World Bank 2006) live within the 10 riparian states. According to the World Bank (2006) data, the Nile region is characterized by high population growth and considerable development challenges. Five of the ten countries are among the poorest in the world with gross national per capita incomes of $90 (Burundi), $110 (DRC and Ethiopia), $190 (Eritrea) and $210 (Rwanda). Life expectancy varies from 42 in Ethiopia to 70 in Egypt. Child mortality rate per thousand varies from 210 in DRC to 36 in Egypt. Most of the population in the Nile Basin live in rural areas and are dependent on agriculture (Table 1).
TABLE 1. Proportion of total agricultural population in East Africa, including forestry and fisheries (analysis based on FAO statistical yearbook 2004 (FAO 2007). Data includes population).
Countries
1 2 3 4 5 6 7 8 9 10 11
Burundi DRC Egypt Eritrea Ethiopia Kenya Madagascar Rwanda Sudan Tanzania Uganda
Year 1979-1981
1989-1991
1999-2001
2003
2004
93 72 60 N/A 89 82 82 93 72 84 86
92 68 44 N/A 86 80 78 92 69 82 84
90 63 37 78 82 75 74 91 61 78 79
90 62 35 77 81 74 73 90 58 77 77
90 61 34 76 81 74 72 90 57 76 77
Figures 2a and 2b show various characteristics of the Nile Basin according to watersheds of Africa (IUCN 2007). Table 2 provides summary statistics of the key tributaries.
FIGURE 2a. Land Cover.
FIGURE 2b. Population.
4
TABLE 2. Nile Basin: Areas and flow of major tributaries. Sources: Area from Mohamed et al. (2005); Flows from Sutcliffe and Parks (1999).
*
Area (1,000 km2)
Outlet location
Mean annual flow (km3yr-1*)
No.
Catchment
1
Nile
Mediterranean
3,310
2
Nile
Aswan
3,060
3
Atbara
Atbara
180
11.1
4
Blue Nile
Khartoum
330
48.3
5
White Nile
Khartoum
1,730
26.0
6
White Nile
Malakal
1,480
29.6
84.1
Naturalized flows for the period 1910 to 1995
The average annual flow of the White Nile at Khartoum is approximately 26 cubic kilometers (km ). The remaining flow of 58.1 km3 comes from the Blue Nile and the Tekezze-Atbara. The seasonal flow pattern exhibits the combined characteristics of these two main tributaries, with the seasonal pattern of the Blue Nile superimposed on the regular pattern of the White Nile. The total annual flow at the border with Egypt has historically been taken (before any significant abstraction) as 84 km3 (1905-1959). However, there are considerable year-on-year variations as well as periodic variations (Figure 3) (Ahmed 2006; Hydrosult Inc et al. 2006a). 3
MAIN NILE Monthly Flows: 1871/72 -2000/01 160.00 140.00 120.00
Billion M3
100.00 TOTAL
80.00 5-yr moving mean
60.00 40.00 20.00
18
18
71 -72 77 18 78 83 18 84 89 -90 18 95 19 96 01 19 02 07 19 08 13 19 14 19 19 20 25 19 26 31 19 32 37 19 38 43 19 44 49 19 50 55 19 56 61 19 62 67 19 68 73 19 74 79 19 80 85 19 86 91 19 92 97 -98
0.00
FIGURE 3. Main Nile: Monthly discharges and five-year moving mean 1871/72-2000/01.
The years 1871 to 1896 was a period of high flows as a consequence of high lake levels across East Africa. Between 1901 and 1975 annual discharges averaged around 87 km3. The decade from 1976 to 1987 saw a series of very low flows with average annual flow only about 76 km3. Since then flows have increased again.
5
1.4. The Project Rationale The need for integrated water resources management to alleviate poverty and food insecurity in semi-arid Africa cannot be over-emphasized. In the Nile Basin, water from the Ethiopian highlands, particularly from the Blue Nile, has, historically, mainly benefited downstream people in Sudan and Egypt in different ways: agriculture, livestock, industry and electrical power. However, such benefits are now affected and continue to be affected due to dramatically changing land, water and livestock management practices upstream. High population pressure, lack of alternative livelihood opportunities and the slow pace of rural development are inducing deforestation, overgrazing, land degradation and declining agricultural productivity. Poor water and land management in upstream areas reduces both potential runoff yields and the quality of water flowing downstream. The result is a vicious cycle of poverty and food insecurity for over 14 million poverty-stricken people in the uplands, and for millions of downstream users. It is widely recognized that improved water management in the Abay Catchment is key to improving both upstream and downstream livelihoods. Better water management will help increase water availability and alleviate the impacts of natural catastrophes such as droughts and reduce conflicts among stakeholders dependent on the Nile. Currently, the Abay is one of the least planned and managed sub-basins of the Nile. About two-thirds of the area of this densely populated basin fall in the highlands and, hence, receive fairly high levels of rainfall of 800 to 2,200 mm yr-1. However, it is erratic in terms of both spatial and temporal distribution, with dry spells that significantly reduce crop yields and sometimes lead to total crop failure. The impacts of droughts on the people and their livestock in the area can be catastrophic. The population located in the downstream part of the Blue Nile, is entirely dependent on the river water for supplementary irrigation. Canal and reservoir siltation is a major problem exacerbating socioeconomic burdens, besides the seasonality of the river flow, on poor riparian farmers. Solutions lie in improving agricultural practices and conserving water at all levels by all stakeholders, both within Ethiopia and amongst downstream communities. Though well known in principle, the technologies required for overcoming the poor and extreme distribution of water resources are not applied because of poor adaptation to the local conditions, unavailability of capital, institutional constraints and inadequate scientific knowledge. The underlying premise of this study is that with increased scientific knowledge of the hydrological, hydraulic, watershed, and institutional processes of the Blue Nile, constraints to up-scaling management practices and promising technologies within the catchment can be overcome, resulting in significant positive benefits for both upstream and downstream communities. The specific objectives of the project are to: 1. Identify major water, land and livestock management constraints and opportunities and assess the upstream and downstream impacts of current and future water, land and livestock management interventions within the catchment. 2. Adapt and apply existing hydrological, watershed, and economic models to estimate the likely economic implications of interventions both basin-wide and locally, in selected communities, including impacts on poverty. 3. Create an overview of ‘best-bet’ management practices and interventions, for improved land and water management and evaluate the hydrological and socioeconomic conditions, including institutional arrangements, necessary for up-scaling them. Furthermore, such studies help the decision-makers to adapt their water and land management policies by making use of the new management interventions in the upstream watersheds, upstreamdownstream water availability, and demand and supply.
6
1.5. Specific Project Components of Modeling Sediment and Water Supply, and Demand and Supply In the past, a great deal of research has been conducted into water and land management options in Ethiopia. However, this project is unique in its sharp focus on recognizing and then structuring interventions to account for upstream/downstream impacts. The project takes a holistic basin-wide view and will investigate those interventions that alleviate poverty and reduce environmental degradation, while at the same time maximizing benefits and minimizing harm to downstream stakeholders. The importance of these upstream-downstream linkages are clear both within Ethiopia, where the fragility of the landscape and the vulnerability of the population must be considered downstream of any intervention, and across borders in Sudan and Egypt, where impacts may arise as a result of changing land and water management practices upstream. These linkages are likely to be seen most directly through changes in river flows, sedimentation and water quality. The project, therefore, seeks interventions that either minimize changes in river flows or makes changes in river flows that result in positive benefits downstream (e.g., moderating floods and droughts and ensuring adequate environmental flows). With regard to sediment, understanding the causes of erosion, sediment transport and its dynamic as well as changes in sedimentation and water quality are very important. The project seeks poverty alleviation through land and water management interventions that will not degrade downstream water quality, but will ideally enhance it (e.g., through erosion control, restoration of wetlands or effluent control). To address these issues, two key components of the study are watershed modeling and water allocation modeling. These components comprise: Development of a Watershed Management Model which considers generation of flows, nutrients, sediments and bio-economic factors. The objectives of the model are to: •
predict the effect of management decisions and up-scaling interventions on water, sediment and nutrient yields; and
•
assess the impact of upstream water management scenarios on downstream users, especially reservoir sedimentation, based on sediment input and sediment trap efficiency.
Development of a Water Demand and Supply Model to consider the estimation of water for major production activities (both existing and planned) and assess the potential for meeting these requirements. The objectives of the model are to: •
provide insight on water availability and estimation of water for major production activities; and
•
assess impacts of upstream water resource development on water availability and hydrology downstream.
1.6 Overview of this Report As a collation of baseline information for the study described above, this report provides a detailed description of the Blue Nile River. As such it: •
identifies the data and information systems that can be used for detailed analyses;
•
provides an overview of the climate and hydrology of the system, erosion, sediment transport and sedimentation;
7
•
provides an overview of current and possible future water resource developments in the Basin; and
•
reviews possible models and how they might be configured for the study.
2. BLUE NILE PHYSIOGRAPHY The Blue Nile Basin covers an area of 311,548 km2 (Hydrosult Inc et al. 2006b). It provides 62% of the flow reaching Aswan (World Bank 2006). The river and its tributaries drain a large proportion of the central, western and south-western highlands of Ethiopia before dropping to the plains of Sudan. The confluence of the Blue Nile and the White Nile is at Khartoum. The basin is characterized by a highly rugged topography and considerable variation of altitude ranging from about 350 meters (m) at Khartoum to over 4,250 meters above sea level (masl) in the Ethiopian highlands (Figure 4a). The Dinder and Rahad rise to the west of Lake Tana and flow westwards across the border joining the Blue Nile below Sennar (Figure 4b).
FIGURE 4a. Map of the Blue Nile showing elevation, main tributaries and key geographic features (Source: IWMI 2007).
FIGURE 4b. Abay-Blue Nile Sub-basin: 3rd and 6 th order watersheds(Source: Hydrosult Inc et al. 2006b).
The Abay’s source is Gish Abay in West Gojam. From here it flows northward as the Gilgel Abay1 into Lake Tana (Figure 5). Lake Tana is the biggest lake in Ethiopia and is some 73 km long and 68 km wide. It is located at 1,786 masl and has a surface area of 3,042 km2, accounting for 50% of the total inland water of Ethiopia (Hydrosult Inc et al. 2006b). Little of the 13,750 km2 catchment draining into the lake is above 2,400 masl, though it rises to approximately 4,000 masl to the northeast, in the Simien Mountains. There are approximately 40 rivers draining into the lake, many of which have catchment areas of less than 1,000 km2 and are ephemeral (Kebede et al. 2006). In addition to the Gilgel Abay, three other major rivers, Gumera, Ribb and Megech flow into the lake. The lake stores 29.175 km3 of water which fluctuates seasonally between 1,785 and 1,787 masl. The lake is shallow and has a mean depth of 9.53 m, while the deepest part is 14 m. 1
“Gilgel” in Amharic means “baby”
8
(a)
(b)
FIGURE 5(a). Lake Tana in the Ethiopian Highlands (photo credit: Matthew McCartney); (b) satellite image of the Lake.
The Abay leaves the lake close to the city of Bahar Dar at the southeastern corner of the lake and cuts a deep gorge first south then westwards, through a series of cataracts. Approximately 40 km downstream it drops 50 m over the Tiss Issat Falls (Figure 6) into the Blue Nile gorge. The river then follows a deep and circuitous, 900 km, course, through the Ethiopian Highlands. It first flows southeast, before looping back on itself, flowing west and then turning northwest and traversing through Sudan. In the highlands, the basin is composed mainly of volcanic and Pre-Cambrian basement rocks with small areas of sedimentary rocks. The catchment is cut by deep ravines in which the major tributaries flow. The valley of the Blue Nile itself is 1,300 m deep in places (Figure 7). The whole area is intersected by streams, many of which are perennial though highly seasonal in their flow. The primary tributaries of the Blue Nile in Ethiopia are the Beshio, Jema, Muger, Guder, Finchaa, Anger, Didessa and Dabus on the left bank, and Beles, and smaller tributaries Chemoga, Timochia and Bir on the right bank.
FIGURE 6. Tiss Issat Falls.
9
FIGURE 7. Blue Nile Gorge (photo credit: Matthew McCartney).
The Blue Nile enters Sudan at an altitude of 490 meters amsl and just before crossing the frontier, the river enters the clay plain, through which it flows over a distance of about 630 km to Khartoum. At Khartoum the Blue Nile joins the White Nile to form the main stem of the Nile River. Below the Damzain rapids at Rosieres, where the main reservoir storing Blue Nile waters for irrigation in Sudan was built (Figure 8), the character of the Blue Nile changes in response to the change of gradient. Here the river is only just below the level of the surrounding plain and some areas are flooded during the rainy season. The average slope of the river from the Ethiopian frontier to Khartoum is only about 15 cm km-1. Within Sudan, the Blue Nile receives water from two major tributaries draining from the north, the Dinder and the Rahad (Table 2). These drain both countries and join the main Blue Nile upstream of Khartoum. Both are highly seasonal, with no flow in the dry season (January to May). They are nearly equally long, about 750 to 800 km. The Blue Nile joins the White Nile at an elevation of approximately 400 masl, but still 2,800 km upstream of its Mediterranean delta. The total area of the Blue Nile Basin at this point is 311,548 km2. Table 3 presents the area and summary statistics for each of the major sub-basins in the Blue Nile Basin.
10
TABLE 3. Summary statistics for the major sub-basins of the Blue Nile.
No. Sub-basin
Catchment area (km2)
Mean annual rainfall (mm)
Mean annual Mean annual potential runoff (mm) evapotranspiration (mm)
Mean annual flow (Mm3)
Coefficient of runoff
Ethiopia 1 2 3 4 5 6 7 8 9 10 11 12 13 14 15 16
Guder Dabus Finchaa South Gojam Anger Beles Didessa Muger North Gojam Jemma Lake Tana Welaka Beshilo Wombera Dinder Rahad
7,011 21,030 4,089 16,762 7,901 14,200 19,630 8,188 14,389 15,782 15,054 6,415 13,242 12,957 14,891* 8,269*
910 2,276 1,766 1,633 1,813 1,655 1,816 1,347 1,336 1,105 1,313 1,072 982 1,660 N/A N/A
1,307 1,112 1,290 1,183 1,318 1,274 1,308 1,210 1,242 1,059 1,136 1,263 1,140 N/A N/A N/A
312 297 438 299 298 306 289 298 305 304 253 323 296 299 188 133
2,187 6,246 1,719 5,012 2,355 4,345 5,673 2,440 4,389 4,798 3,809 2,072 3,920 3,874 2,797+ 1,102+
0.34 0.13 0.25 0.18 0.16 0.18 0.16 0.22 0.23 0.28 0.19 0.30 0.30 0.18 N/A N/A
135 124 68.8
4,563 4,817 380
0.20 0.20 0.16
Sudan 1 2 4
Upper Blue Nile 33,804 Dinder-Rahad 38,851* Lower Blue Nile 5,530
674 620 430
1,480 1,570 1,960
Source: For Ethiopia, data are taken from MoWR (1998) and Tesfahun et al. (2006). For Sudan, * data are taken from Hydrosult Inc et al. (2006b)2
2.1. Climate 2.1.1. Rainfall and its Distribution Rainfall varies significantly with altitude and is considerably greater in the Ethiopian highlands than on the Plains of Sudan. Rainfall ranges from nearly 2,000 mm/yr in the Ethiopian Highlands to less than 200 mm/yr at the junction with the White Nile. Within Sudan, the average annual rainfall over much of the basin is less than 500 mm. In Ethiopia, it increases from about 1,000 mm near the border of Sudan to between 1,400 and 1,800 mm over parts of the upper basin, in particular, in the loop of the Blue Nile south of Lake Tana. Rainfall exceeds 2,000 mm in parts of the Didessa and Beles catchments (Figure 8). Both the temporal and spatial distribution of rainfall is governed, to a large extent, by the movement of air masses associated with the Inter-Tropical Convergence Zone (ITCZ). During the winter dry season (known in Ethiopia as Bega) the ITCZ lies south of Ethiopia and the Blue Nile region is affected by a dry northeast continental air-mass controlled by a large Egyptian zone of high pressure. This cool airstream from the desert produces the dry season. From March, the ITCZ returns bringing rain particularly to the southern and southwestern parts of the Basin. This short period of rain is known in Ethiopia as the Belg or “small rains”. In May, the Egyptian high pressure 2
Note here that there are significant variations in terms of area of the Blue Nile Basin, based on previous discussions. The overall 2 2 estimated area is at 311,548 km . While the defined tributaries account to a total of 277,995 km , the remaining balance is probably attributed to the non-major rivers and the directly draining catchment area into the river. Also note that, some reports show the total 2 area of the Blue Nile as being 331,000 km . This will be clarified further in the future.
11
strengthens and checks the northward movement of the ITCZ producing a short intermission before the main wet season (known in Ethiopia as the Kremt). Around June, the ITCZ moves further north and the southwest airstream extends over the entire Ethiopian highlands to produce the main rainy season. This is also the main rainy season in Sudan, though being further north and at lower altitude, the period of rainfall is foreshortened and totals are considerably less than in Ethiopia (Table 4). The summer months account for a large proportion of mean annual rainfall; roughly 70% occurs between June and September and this proportion generally increases with latitude, ranging from 61% at Gore in the southwest to 73% at Debre Marcos, 78% at Gonder, 87% at Rosieres and 93% at Khartoum (Figure 9; Table 5).
FIGURE 8. Mean annual rainfall across the Blue Nile Basin (mm yr -1) (Source: Hydrosult Inc et al. 2006b).
12
TABLE 4. Summary statistics for representative climate stations, located in, or close to, the Blue Nile Basin.
Climate Station
Location Latitude Longitude
Elevation (masl)
Mean annual rainfall (mm)
Range in Mean Monthly temperature (oC)
Potential Evapotranspiration (mm)
Ethiopia Gonder Bahar Dar Debre Marcos Debre Tabor Addis Ababa Sibu Sire Jimma Gore Gambela Assossa
12.53 11.60 10.35 11.88 8.98 9.02 7.67 8.17 8.25 10.07
37.43 37.40 37.72 38.03 38.80 36.87 36.83 35.55 34.58 34.52
1,966 1,805 2,440 2,410 2,324 1,750 1,577 1,974 480 1,750
1,095 1,453 1,320 1,651 1,191 1,370 1,477 2,176 1,197 1,116
17.9 18.1 14.2 15.0 15.5 18.2 18.0 16.1 25.4 19.4
– – – – – – – – – –
22.7 22.4 18.6 18.7 18.2 21.6 20.8 20.3 30.2 24.4
1,524 1,388 1,172 1,363 1,234 N/A 1,301 1,263 1,658 1,463
N/A 26.2 – 32.2 20.5 – 28.5 23.5 – 32.8 22.8 – 34.5 22.5 – 30.9
N/A N/A 2,149 2,534 2,625 N/A
Sudan Hawata Rosieres Sennar Wad Medani Khartoum Rahad
13.40 11.83 13.55 14.40 15.60 12.70
34.60 34.37 33.62 33.48 32.55 30.63
440 465 418 408 380 495
566 655 434 305 140 428
Source: FAO-CLIM2 Worldwide agroclimatic database Note: N/A = Not available
TABLE 5. Mean monthly rainfall (mm) for representative climate stations located in, or close to, the Blue Nile Basin.
Climate station
Jan
Feb
Mar
Apr
May June
Jul
Aug
Sep
Oct
Nov Dec
Annual
311 444 301 501 250 271 213 336 239 207
279 395 300 476 265 245 210 335 228 208
116 196 204 193 169 179 183 337 155 207
56 92 81 66 41 74 93 166 113 103
24 23 24 21 9 42 66 102 48 21
9 4 15 16 14 14 32 37 12 0
1,095 1,453 1,320 1,651 1,191 1,370 1,477 2,176 1,197 1,116
142 157 113 88 43 138
210 175 143 111 63 130
82 121 75 46 17 71
20 33 25 16 5 24
1 1 1 2 1 1
0 0 0 0 0 0
566 655 434 305 140 428
Ethiopia Gonder Bahar Dar Debre Marcos Debre Tabor Addis Ababa Sibu Sire Jimma Gore Gambela Assossa
5 3 12 6 19 16 30 39 5 0
4 2 22 11 50 24 52 46 8 0
19 8 49 42 71 50 95 98 27 31
34 22 61 46 90 85 128 119 56 32
87 83 96 93 95 150 166 234 156 118
151 181 155 180 118 220 209 327 150 189 Sudan
Hawata Rosieres Sennar Wad Medani Khartoum Rahad
0 0 0 0 0 0
0 0 0 0 0 0
0 1 0 0 0 0
2 12 3 1 0 2
12 36 14 13 4 25
97 119 60 28 7 37
Source: FAO-CLIM2 Worldwide agroclimatic database
13
(b) 35
400
33
250
27
200
25 23
150
21 100
Temperature (oC)
29
Rainfall and Potential Evapotranspiration (mm)
31 300
19
33 31
300
29
250
27
200
25
150
23 21
100
19
Dec
Nov
Oct
Sep
Jul
Aug
Jun
May
Apr
Mar
Jan
Feb
Dec
Oct
Nov
Sep
Jul
Aug
Jun
15
Apr
0
May
15
Mar
17
0
Jan
50
400
35
400
23
350
33
350
22
300
21
27
200
25
150
23 21
100
Temperature (oC)
29
250
Rainfall and Potential Evapotranspiration (mm)
31
300
19
20
250
19 200 18 150
17
100
16
Dec
Nov
Oct
Sep
Aug
Jul
Jun
May
Apr
Mar
Jan
(f) 400
34
400
35
350
32
350
33
18
19 17
0
Dec
Nov
Oct
15
Jan
Dec
Nov
Oct
Sep
Aug
Jul
Jun
May
Apr
14
Mar
0
Jan
16
Feb
50
21
50
Sep
100
23
100
Aug
20
25
150
Jul
22
Jun
150
27
200
May
24
Apr
200
29 250
Mar
26
31
300
Feb
250
Temperature (oC)
28
Rainfall and Potential Evapotranspiration (mm)
30
300
Temperature (oC)
(e)
Feb
Dec
Oct
Nov
Sep
Aug
14
Jul
0
Jun
15
May
15
0
Apr
50
Mar
17
Jan
50
Temperature (oC)
(d)
Feb
Rainfall and Potential Evapotranspiration (mm)
35
350
17
(c)
Rainfall and Potential Evapotranspiration (mm)
400
50
Feb
Rainfall and Potential Evapotranspiration (mm)
350
Temperature (oC)
(a)
FIGURE 9. Annual variation in temperature (blue bars), potential evapotranspiration (red line) and rainfall (green line) at six representative sites in the Blue Nile: a) Khartoum, b) Rosieres, c) Assossa, d) Sibu Sire, e) Debre Marcos, and f) Gonder.
2.1.2. Temperature The spatial distribution of temperature values is strongly related to altitude (Figure 10). The highest mean annual temperatures occur in the northeastern clay plains of Sudan. In Sudan, daily minimum and maximum temperatures in January are 14°C and 33°C, and those in May are 24°C and 44°C, respectively. The area located in the highlands of Ethiopia is characterized by lower minimum mean monthly temperatures that range between 3oC and 21oC, and occur between December and February.
14
FIGURE 10. Mean annual temperature (oC) in the Blue Nile Basin (Source: Hydrosult Inc et al. 2006b).
2.1.3. Evapotranspiration Similar to rainfall and temperature, potential evapotranspiration also varies considerably across the basin and is highly correlated with altitude (Figure 11; Table 6). Throughout Sudan, values (computed using the Penman-Monteith method) generally exceed 2,200 mm per year and even in the rainy season (July to October) rainfall rarely exceeds 50% of potential evapotranspiration. Consequently, irrigation is essential for the growth of crops. In the highlands of Ethiopia, potential evapotranspiration ranges from approximately 1,300 to 1,700 mm per year and in many places is less than rainfall in the rainy season. Consequently, rainfed cultivation, producing a single crop in the rainy season, is possible, though at a risk in low rainfall years.
FIGURE 11. Mean annual potential evapotranspiration across the Blue Nile Basin (Source: IWMI 2007)
15
TABLE 6. Mean monthly potential evapotranspiration (mm) for representative climate stations located in, or close to, the Blue Nile Basin.
Climate station
Jan
Feb
Mar
Apr
May June
Jul
Aug
Sep
Oct
Nov Dec
Annual
78 81 68 74 81 N/A 90 78 102 84
114 105 87 99 90 N/A 99 90 123 108
133 118 105 118 115 N/A 115 115 140 118
126 111 96 108 108 N/A 105 105 135 114
121 109 99 105 105 N/A 105 109 146 130
1,524 1,388 1,172 1,363 1,234 N/A 1,301 1,263 1,658 1,463
N/A N/A 152 177 214 N/A
N/A N/A 162 180 213 N/A
N/A N/A 158 183 213 N/A
N/A N/A 174 189 202 N/A
N/A N/A 167 189 189 N/A
N/A N/A 2,149 2,535 2,625 N/A
Ethiopia Gonder Bahar Dar Debre Marcos Debre Tabor Addis Ababa Sibu Sire Jimma Gore Gambela Assossa
136 115 102 118 105 N/A 112 118 159 143
140 118 104 123 104 N/A 106 118 154 140
164 152 115 152 124 N/A 140 136 164 143
156 156 129 147 117 N/A 126 126 165 162
149 136 109 133 115 N/A 118 102 140 127
126 108 87 108 93 N/A 99 87 117 99
81 81 71 78 78 N/A 87 81 115 96
Sudan Hawata Rosieres Sennar Wad Medani Khartoum Rahad
N/A N/A 171 192 177 N/A
N/A N/A 171 204 196 N/A
N/A N/A 217 245 254 N/A
N/A N/A 210 240 240 N/A
N/A N/A 229 264 264 N/A
N/A N/A 180 258 252 N/A
N/A N/A 158 214 248 N/A
Source: FAO-CLIM2 Worldwide agroclimatic database Note: N/A = Not available
A complete list of climatic measuring stations in Ethiopia and Sudan for the Blue Nile Basin is provided in Appendix 1.
2.2. Geology3 The geology of the Blue Nile Basin (Figure 12) can be briefly summarized as: •
the highlands of the basin are composed of basic rocks, mainly basalts;
•
the Ethiopian lowlands are mainly composed of Basement Complex rocks as well as metamorphic rocks, such as gneisses and marble. Where the Abay has cut through the basalts there are restricted areas of limestones and then sandstones before the Basement Complex is reached; and
•
the main part of the lowlands of Sudan is underlain by deep unconsolidated colluvial sediments of tertiary and quaternary age. To the north are older Basement Complex rocks and the Nubian Sandstones. The Nubian Sandstones are located in the northwest corner, overlying the Basement Complex rocks and comprise mainly sandstones, siltstones and conglomerates.
2.3. Soils The Vertisol–Nitisol boundary runs almost along the international boundary. Nitisols (24%) dominate the western Ethiopian Highlands whilst shallower and more infertile Leptosols (19%) occupy the eastern Ethiopian Highlands. On the flat plateaus in the Ethiopian Highlands are extensive areas of Vertisols. On the deep soils in the high rainfall areas around Lake Tana there are extensive areas of Luvisols. Vertisols (29%) dominate the unconsolidated sediments of the Sudan plains (see Figure 13) (Hydrosult Inc et al. 2006b). 3
Note that the summary of geology, soils, and land cover and vegetation is extracted from the Hydrosult Inc et al. (2006b) document.
16
FIGURE 12. Geology of the Blue Nile Basin.
FIGURE 13. Dominant soil types in the Blue Nile Basin (Source: FAO Classification).
17
2.4. Land Cover and Vegetation Table 7 and Figure 14 present the land cover of the Blue Nile. In the far north between the 75 mm and about the 250 mm isohyets “Semi-desert Scrub” is the most prevalent vegetation type, comprising a varying mixture of grass and herbs, with a variable scattering of shrubs up to 4 m high, interspersed with bare earth. Grass is mainly an annual plant in Sudan. Heavy grazing and low rainfall ensures that there is insufficient dry matter for annual fires. In years of low rainfall and heavy grazing there can be an almost complete failure of annual plant growth. South-eastwards, from the 250 mm to the 360 mm isohyet, the vegetation type becomes “Semidesert Grassland”. Much of this vegetation is now covered by the Gezira and Managil irrigation schemes (see below). On the heavy alkaline clay soils the natural vegetation is grassland without trees or shrubs. Between the 360 and 570 mm isohyets on the heavy clays grassland merges into A. mellifera thornland. Above 570 mm to the border with Ethiopia there is increasing dominance of A. seyal in association with Balanites aegyptiaca. A. senegal is retained for gum arabic harvesting whilst A. seyal is used for charcoal production. B. aegyptiaca becomes increasingly prevalent because it is fire resistant. Woodlands and shrublands cover some 28% and grasslands 25% of the basin. Sedentary rainfed cropping covers nearly 26% of the area mainly located in the Ethiopian Highlands. Semi-mechanized farms cover 10% and the irrigated schemes 2.6% of the basin. Much of the major Gezira and all of Managil schemes, although irrigated with water from the Blue Nile, lie in the White Nile Basin. TABLE 7. Dominant land cover in the Blue Nile Basin (Source: Hydrosult Inc et al. 2006b).
Land cover type
Area (ha)
Total (%)
Rainfed crops: sedentary Grassland Woodland Shrubland Semi-mechanized farms Irrigated crops Rock High forest Water Rainfed crops: shifting Plantation Sand Seasonal swamp Permanent swamp Urban Afro-alpine
8,037,337 7,777,274 5,225,555 3,671,919 3,123,087 815,480 732,392 429,777 420,103 340,930 211,977 128,804 94,518 51,831 65,136 28,680
25.8 25.0 16.8 11.8 10.0 2.6 2.4 1.4 1.3 1.1 0.7 0.4 0.3 0.2 0.2 0.1
Sub-basin
31,154,800
18
FIGURE 14. Dominant land cover of the Blue Nile Basin (Source: Hydrosult Inc et al. 2006b).
3. HYDROLOGY OF THE BLUE NILE 3.1. Flow Throughout the Blue Nile Basin, river flow data are generally limited because of the remoteness of many of the catchments and the lack of economic resources and infrastructure to build and maintain monitoring sites. In Ethiopia, although there are over 100 flow gauging stations in the basin, most of these are located on relatively small tributaries and/or near the headwaters of the main rivers. Very few gauged catchments are over 1,000 km2 and very few gauging stations are located on the main stem of the river or on the major tributaries close to their confluence with the Blue Nile (Figure 15). Table 8 lists some of the most important flow gauging stations, with reasonably long records, in the Blue Nile Basin. A full list of measuring stations is provided in Appendix 2.
19
FIGURE 15. Flow gauging stations located in the Blue Nile Basin.
TABLE 8. Summary details of key flow gauging stations in the Blue Nile Basin.
Station no.
River
Location
Latitude
Longitude
Catchment area (km2)
Start of record
End of record
37.38 38.18 34.98 37.48 38.90 37.75 37.38 36.48 37.25 37.02 37.77 36.42 36.52 36.78 36.78 36.05 36.58 35.22 36.45
15,321 65,784 172,254 517 5,412 524 978 539 322 757 799 9,981 4,674 951 844 2,881 3,742 562 3,431
1959 1959 1959 1959 1986 1959 1959 1961 1963 1986 1988 1959 1959 1960 1960 1961 1977 1979 1981
-
32.52 34.62 34.10 34.98
325,000
1904 1971 1971 1962
-
Ethiopia 1 2 3 4 5 6 7 8 9 10 11 12 13 14 15 16 17 18 19
112003 112001 116002 112004 112034 113005 113013 113023 113026 113036 113037 114001 114002 114003 114004 114005 114007 115006 116005
Abay Abay Abay Andassa Jemma Guder Birr Dura Neshi L. Fettam Debis Didessa Angar Sifa Wamma Dabana Little Ang Sechi Beles
Outlet of Lake Tana Nr. Kessie At Sudan border Nr. Bahar Dar Nr. Lemi At Guder Nr. Jiga Nr. Metekel Nr. Shambo At Galibed Nr. Guder Nr. Arjo Nr. Nekemite Nr. Nekemite Nr. Nekemite Nr. Abasina At Angar Gutin Nr. Mendi At Bridge
11.60 10.07 11.23 11.50 9.92 8.95 10.65 10.98 9.75 10.48 9.02 8.68 9.43 8.87 8.78 9.03 9.50 9.70 11.25 Sudan
20 21 22 23
900152 902032 901032 900012
Nile Rahad Dinder Nile
Khartoum Hawata Giwasi Rosieres
15.6 13.4 13.32 11.23
210,000
Source: Ministry of Water Resources, Ethiopia and Ministry of Irrigation and Water Resources, Sudan
20
Table 9 and Figure 16 illustrate the differences in mean monthly flow and runoff at four gauging stations located along the Blue Nile. The gauge at Rosieres is located upstream of the reservoir, very close to the national border. The data show that at all locations flow is heavily concentrated in the summer months (i.e., July to October). TABLE 9. Mean monthly flow (Mm3) and runoff (mm) measured at gauging stations located on the main stem of the Blue Nile.
Location
Jan
Feb
Mar
Apr May June
Jul
Aug
Sep
Oct
Nov
Dec
Annual
Lake Tana
3
Mm mm
203 13
127 8
94 6
70 5
49 3
Kessie
Mm3 mm
331 5
221 3
227 4
211 3
209 3
Rosieres
Mm3 mm
762 4
446 2
364 2
324 2
612 1,659 6,763 15,228 12,111 6,484 3 8 32 73 58 31
2,559 1,348 48,660 12 6 233
Khartoum
Mm3 mm
724 3
448 2
406 2
427 2
503 1,084 4,989 15,237 13,625 7,130 2 4 18 55 50 26
2,451 1,257 48,281 9 5 178
45 2
114 7
434 28
258 3,003 4 46
6,594 100
906 59
861 56
541 35
332 22
3,776 244
3,080 1,456 47 22
788 12
503 16,881 8 257
Source: Ministry of Water Resources, Ethiopia; Sutcliffe and Parks (1999)
(a)
(b) 120
16,000 14,000
100
10,000
Runoff (mm)
Flow (Mm3)
12,000
8,000 6,000
80 60 40
4,000 20
2,000 0
Outflow from Lake Tana
Blue Nile at Kessie
Outflow from Lake Tana
Blue Nile at Kessie
Blue Nile at Rosieres
Blue Nile at Khartoum
Blue Nile at Rosieres
Blue Nile at Khartoum
Dec
Nov
Oct
Sep
Aug
Jul
Jun
May
Apr
Mar
Feb
Jan
Dec
Nov
Oct
Sep
Aug
Jul
Jun
May
Apr
Mar
Feb
Jan
0
FIGURE 16. a) Mean monthly flow (Mm3), and b) runoff at gauging stations located on the main stem of the Blue Nile.
The mean annual outflow from Lake Tana is 3,776 Mm3 with a range from 1,075 Mm3 in 1984 to 6,182 Mm3 in 1998. The average annual outflow equates to 257 mm over the total catchment area of 15,321 km2. The mean annual rainfall over the basin is estimated to be 1,342 mm (Melkamu 2005). So, this gives a coefficient of runoff of approximately 18%. The natural seasonal distribution is slightly attenuated by the lake storage, with peak flows delayed from August to September/October and proportionally higher dry season flows than along the rest of the river4. Since 2001, the outflow from Lake Tana has been controlled by the Chara Chara Weir which was built to regulate flow for hydropower production. This has resulted in a change in the natural pattern of flow from the lake, with higher dry season flows and lower wet season flows (Figure 17). However, because the flow from Lake Tana is a relatively small proportion of the flow at Kessie (22%) and an even smaller proportion of the flow at the border (i.e., Rosieres) (8%), the regulation is not thought to have had a significant impact on the distribution of flows downstream.
4
Natural dry season flows equate to 39% of total flow at the Lake Tana outlet, compared to approximately 15% at the other locations along the Blue Nile.
21
1,000
Flow (Mm3)
800
600
400
200
0 Jan
Feb
Mar
Apr
May
Jun
Jul
Aug
Sep
Oct
Nov
Dec
Natural flow before construction of the Chara Chara weir (1973-2001) Flow since construction of the weir (2001-2006)
FIGURE 17. Modification of outflow from Lake Tana as a consequence of regulation by the Chara Chara Weir.
The average annual flow of the Blue Nile at the border of Sudan is 48,660 Mm3 (excluding Dinder-Rahad). This represents approximately 40% of Ethiopia’s total surface water resources of 122,000 Mm3 (World Bank 2006). The catchment at this location is about 200,000 km2, so this equates to an average annual runoff of 243 mm (i.e., a coefficient of runoff of approximately 14%). Despite inflows from the Dinder and Rahad5 the average annual flow of the Blue Nile at Khartoum (i.e., 48,2816 million cubic meters) is slightly less that at the border. The catchment at this location is 311,548 km2, so this equates to an average annual runoff of 155 mm (146 mm if 331,000 km2 is taken). The reduction in flows between the border and Khartoum, despite the increased catchment area, is a consequence of both water abstractions (for irrigation and water supply, primarily to Khartoum) and high transmission losses. It is estimated that annual transmission losses (i.e., both evaporation and percolation) between Roseires and Khartoum are about 2,000 Mm3, with an additional 500 Mm3 from the Sennar and Roseires reservoirs (Sutcliff and Parks 1999). In addition to seasonal variation in flow there is also considerable inter-annual variation, reflecting significant differences in rainfall. The annual discharge for the Blue Nile at Khartoum from 1920 to 2006 is shown in Figure 18. Between 1920 and1960 the annual discharge oscillated around the mean. From 1960 to 1984 there was a general decrease in discharge, with the flow in most years being below the mean. After 1985, flows have gradually increased (Ahmed 2006; Hydrosult Inc et al. 2006b).
5
3
Average annual inflows from Dinder and Rahad are 2,797 and 1,102 Mm , respectively. But in both rivers, flows are highly concentrated in the months of July to October (Sutcliffe and Parks 1999).
6
3
Also note that Figure 18 provides the medium term average of the Blue Nile, 48,857 Mm at El Deim.
22
80,000 1929
Total discharge (Mm^3)
70,000
1988
1946
60,000
50,000
48857.3
40,000
30,000 1972
20,000 1920
1930
1940
1950
1960
1970
1984
1980
1990
2000
Years
FIGURE 18. Hydrograph of the Blue Nile at El Deim 1920-2006 (Mm3) (Source: Ahmed and Ismail 2008).
3.2. Hydrological Models In recent years, the number of models simulating the discharge from watersheds in the Blue Nile and other river basins in Ethiopia and Africa has increased exponentially. An overview of the models used in the Nile and Blue Nile is given in Appendix 3. Several other models are also available in the grey literature and published in students’ theses and dissertations. Notable here is the work of Seleshi B. Awulachew and Yilma Sileshi and their graduate students. Most of the models tested in Ethiopia were originally developed for applications in temperate regions. Relatively simple engineering approaches such as the Rational Method have been used (Desta 2003), as well as complex models such as the Precipitation Runoff Modeling System (PRMS) (Legesse et al. 2003), Water Erosion Prediction Project (WEPP) (Zeleke 2000), the Agricultural Non-Point Source model (AGNPS) (Haregeweyn and Yohannes 2003; Mohammed et al. 2004) and water balance approaches (Ayenew and Gebreegziabher 2006). Implementation of these models yielded mixed results. The Agricultural Non-Point Source Model (AGNPS) was tested in the highlands in the Augucho Catchment but could not reproduce observed runoff patterns. The Precipitation-Runoff Modeling System (PRMS) was similarly tested by Legesse et al. (2003) for South Central Ethiopia, and needed extensive calibration to predict the monthly runoff. Ayenew and Gebreegziabher (2006) fitted a spreadsheet type water balance to predict water levels in Lake Awassa in the Rift Valley, but found that the model did not perform well in recent years, possibly due to changing land use. Finally, Hengsdijk et al. (2006) applied a suite of crop growth, nutrient balance, and water erosion models and concluded that common conservation practices such as bunds, crop mulching, and reforestation may actually result in lower overall crop productivity in the highlands of northern Ethiopia. In response to Hengsdijk’s conclusions, Nyssen et al. (2006) compared Hengsdijk’s predictions with field observations from the same region and found that the models overpredicted crop yields while under-predicting soil losses.
23
Many simple water balance type approaches have been attempted for the Nile Basin. Both Mishra and Hata (2006) and Conway (1997) developed useful results with grid-based water balance models for the Blue Nile Basin using monthly discharge data from the El Deim Station in Sudan, located close to the Ethiopian border. They were studying the spatial variability of flow parameters and the sensitivity of runoff to changes in climate. Using a water balance model Kebede et al. (2006) concentrated on Lake Tana and developed a water balance utilizing relatively long durations (more than 30 years) of data for precipitation, evaporation, inflows of major tributaries and outflows to the Blue Nile. They calibrated the model using observed lake levels and deduced that lake levels remained relatively constant while outflows from the lake reflected the variation in rainfall (Kebede et al. 2006). Johnson and Curtis (1994) utilized short-duration (less than 4 years) discharge data from several smaller basins throughout the Blue Nile Basin for the development of a monthly water balance model to better understand the rainfall-runoff relationships. The intention was to use the model for forecasting and to develop a method for calibrating water balance coefficients for small basins lacking available data. Very few other examples of small-scale water balance modeling in the Blue Nile Basin have been published. Several attempts have been made to evaluate the likely implications of climate change on river flows (e.g., Conway and Hulme 1996; Yates and Strzepek 1998). All of these attempts have been based around relatively simple (often grid-based) rainfall-runoff models, such as WATBAL (Yates 1996). The main conclusion of this overview of hydrological models used in the highlands of Ethiopia is that the daily simulation results of the more complex models is disappointing when compared with the relatively better predictions of the simple water balance models. The main reason is that the complex modeling techniques, which are typically developed for conditions in the United States or Europe, are not appropriate for Ethiopia. In Ethiopia, the extreme temporal and spatial variability in rainfall and the prolonged dry season mean that hydrological processes are different to those typically encountered in more temperate climates. The lack of available data for both input and calibration further hinders the use of complex models in Ethiopia. For these reasons, simple water balance models, that most efficiently utilize the available data, are the most appropriate choice for simulation of the hydrology of the Blue Nile.
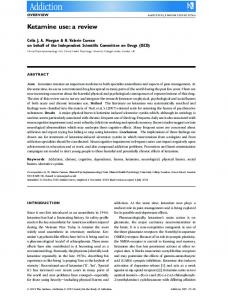
3.3. Runoff Mechanisms In order to develop better models, knowledge of the basic runoff mechanisms is necessary. To gain insight into these mechanisms Liu et al. (Forthcoming) studied rainfall-runoff patterns in three small watersheds located near or in the Blue Nile Basin. Runoff response patterns were investigated by plotting, the biweekly sums of discharge as a function of effective rainfall (i.e., P-E for a two week period) during the rainy season and dry season. An example for one of the watersheds is given in Figure 19. The results indicate that the runoff response changes as the wet season progresses, with precipitation later in the season generally producing a greater fraction of runoff. As rainfall continues to accumulate during a rainy season, each watershed eventually reaches a threshold point where runoff response can be predicted by a linear relationship with effective precipitation, indicating that the proportion of the rainfall that became runoff was constant during the remainder of the rainy season. An approximate threshold of 500 mm of effective cumulative rainfall, P-E, was selected after iteratively examining rainfall versus runoff plots for each watershed. This relationship is shown in Figure 20 for the three watersheds studied by Liu et al. (Forthcoming). Despite the great distances
24
between the watersheds and the different watershed characteristics, the runoff response was remarkably similar in each case. The reason for the similarity in the runoff response among these three watersheds after the threshold rainfall was reached is an interesting question to explore. It is imperative, therefore, to look at various timescales, since focusing on just one type of visual analysis can lead to erroneous conclusions. For example, looking only at storm hydrographs of the rapid runoff response prevalent in the typically intense monsoonal type Ethiopian storms, one could conclude that infiltration excess is the primary runoff generating mechanism (Horton 1933). However, looking at longer timescales in Figure 19, it can be seen that the ratio of Q/(P-E) is increasing with cumulative precipitation. Consequently, the watersheds behave differently depending on how much moisture is stored in the watershed. This suggests that saturation excess processes play an important role in the watershed runoff response. If infiltration excess was controlling runoff responses, discharge would only depend on the rate of rainfall, and there would be no clear relationship with antecedent precipitation as is clearly the case in figures 19 and 20. The finding that saturation excess is occurring in watersheds with a monsoonal climate is not unique. For example, Hu et al. (2005), Lange et al. (2003) and Merz et al. (2006) found that saturation excess could describe the flow in a monsoonal climate in China, Spain, and Nepal, respectively. There are certain previous observations for Ethiopia on the suitability of these types of saturation excess models to predict runoff. Awulachew (2000, 2001) used the MoWBAL model for Rift Valley Lakes Basin and the same model was later applied by Tesfahun et al. (2006) for the Blue Nile. Other observations by Zeleke (2000) also suggested saturation excess as the primary mechanism for runoff generation. Attempts to fit regular models based on infiltration excess principles result in extremely poor fits (Haregeweyn and Yohannes 2003). This does not mean that there is no infiltration excess overland flow occurring, and both could occur during high intensity storms. However, as shown by van de Giesen et al. (2000), in the Ivory Coast, a large portion of the overland flow re-infiltrated after the rain stopped before reaching the channel. Because saturation excess and interflow runoff dominate over the infiltration excess, rainfall intensity is not an important parameter in determining the amount of runoff and, as shown above, models based on a water balance approach are sufficient to describe the hydrology of the Blue Nile Basin in Ethiopia. This confirms the findings of Tesfahun et al. (2006). Therefore, it is recommended to develop such models further.
3.4. Proposed Modeling Strategy for this Study The question to be answered remains; what simulation model or models should be used for simulating the hydrology of the Blue Nile Basin. Runoff response with water balance type models depends on total rainfall quantity and not intensity. Water balance models are also appropriate because they require minimal input data (e.g., precipitation (P) and potential evapotranspiration (PET) data that are generally available). The only other parameters needed for the water balance model are a soil water storage parameter and a parameter that describes the recession response of the watershed. Both of these parameters are generally available, or can be determined from baseflow separated streamflow. The only other requirement for the water balance model is a methodology to reliably calculate the actual evapotranspiration (AET), given the PET. Several approaches are available for calculating the AET. The method used most often is the Thornthwaite-Mather (1955) approach, where the AET decreases linearly with the soil moisture content below field capacity until the soil reaches the wilting point where the AET is zero. Above field capacity, AET is equal to PET. There
25
250.0
200.0 y = 0.5585x + 37.559 2 R = 0.497
Q14-day (mm)
150.0
100.0 y = 0.2363x + 16.736 R 2 = 0.381
50.0
0.0 -100
-50
0
50
100
150
200
250
300
P-E 14-day (mm) dry season cum. P-E>500
cum. P-E500)
100