OCR results, are not sufficient. ... Finally, a leading commercial system (ABBYY FineReader En- ... [10] ABBYY FineReader Engine 9.0: http://www.abbyy.com.
21st International Conference on Pattern Recognition (ICPR 2012) November 11-15, 2012. Tsukuba, Japan
A Robust Hybrid Approach for Text Line Segmentation in Historical Documents1 Christian Clausner, Apostolos Antonacopoulos and Stefan Pletschacher Pattern Recognition and Image Analysis (PRImA) Research Lab School of Computing, Science and Engineering, University of Salford Greater Manchester, M5 4WT, United Kingdom www.primaresearch.org Abstract
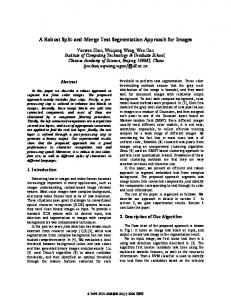
segmentation can be applied directly, whereas for more complex layouts a more sophisticated page segmentation and region classification needs to be performed first to extract separators, graphics etc. and identify the required blocks of text (e.g. [3]). It should be noted that text line segmentation is also an essential step for other non-recognition tasks such as dewarping and word spotting. Text line segmentation methods for modern documents can rely on the fact that text is printed along straight baselines. This is not the case with historical documents where (in addition to the presence of other degradations) baselines are frequently warped in an arbitrary way (see Fig 1). Other issues stemming from the typefaces used (e.g. Fraktur) and imperfections of the printing process are merged glyphs (often between text lines), broken glyphs and irregular spacing.
Large-scale digitisation of historical documents demands robust methods that cope with the presence of frequent distortions and noisy artefacts. This paper presents a hybrid text line segmentation method that uses a novel data structure and a rule base to combine the strengths of top-down and bottom-up approaches while minimising their weaknesses. The effectiveness of the proposed approach has been methodically evaluated in the context of large-scale digitisation using a standardised framework. Results on a diverse dataset show improved performance over top-down and bottom-up approaches as well as over a leading commercially available system.
1. Introduction There is a rapidly growing number of large-scale digitisation projects in libraries around the world. Millions of pages of printed books, newspapers and journals are being scanned and need to be analysed so that the text is recognised and made available for full-text search [1]. Historical documents (the vast majority of the documents concerned) frequently suffer from several artefacts and distortions introduced at various stages during their lifecycle, from when they were first printed to the time they were digitised [2]. New robust document analysis methods are required that not only can handle the idiosyncrasies of historical documents but that can also do so without any intervention from human operators (a requirement of large-scale digitisation pipelines). Following any necessary image pre-processing steps, text lines must be extracted prior to recognition. In simple (single column text) book pages, text line 1
Figure 1 – Part of a page with warped text lines, and merged and broken glyphs (examples indicated in red). A number of approaches have been proposed in the literature for different types of historical documents [4][5]. However, those methods tend to be applicable mostly to their particular domain and are not well suited for use in large-scale digitisation pipelines. Moreover, from a scientific point of view, previous methods have not been evaluated using a standardised framework and representative dataset.
This work has been supported in part through the EU 7th Framework Programme grant IMPACT (Ref: 215064).
978-4-9906441-0-9 ©2012 ICPR
335
In general, text line segmentation methods can either start from larger text regions and try to find separating white spaces between text lines (top-down) or identify and progressively combine connected components into text lines using various similarity and distance measures to find group aggregations of foreground pixels that belong to the same text line (bottom-up). Top-down methods suffer from non-straight and connected text lines but are more robust to wrong groupings of merged and broken characters. The latter can be more flexible but suffer from early erroneous merging decisions. A novel hybrid method is proposed in this paper that exploits the strengths of both bottom-up and topdown approaches while minimising their weaknesses. It is particularly focussed on overcoming robustly issues typically found in historical documents including skew, arbitrary warping, touching components and various types of noise. The method has been developed and successfully validated in the context of largescale library digitisation in the IMPACT project [1]. The individual steps of the method and the novel data structure used are described in the next section. The evaluation of the method using a real-life representative dataset and standardised framework is presented and discussed in Section 3. Concluding remarks are made in Section 4.
if its area is too small to be a part of a character and its four nearest neighbours are similarly small.
2.2. Grouping of connected components The grouping of connected components is carried out using a novel data structure called Flex-Line. It consists of horizontally arranged line segments, each corresponding to a cross section of a connected component, represented by its top and bottom values. The cross-sections of the components associated with a particular Flex-Line are taken at predefined horizontal intervals, inserting virtual white space segments where no connected components are present. Line segments are labelled as white space or text (see Fig. 2). The advantage of this data structure is that a distance measure between text line candidates can be easily defined and calculated, whereas skewed and warped text lines can still be represented precisely. Line segments
Segment distance
White space segments
Top
Bottom
Figure 2 – The Flex-Line data structure. An initial Flex-Line is created for each connected component. The number of line segments (cross sections) is determined by the component width. The vertical expansion (top/bottom) of those segments corresponds to the height of the component (bounding box). A nearest neighbour grouping approach is employed. A match score (or distance measure) is used which increases as the segments are closer in the horizontal direction and as their vertical overlap increases. The score is zero if the segments do not overlap vertically at all or they are more than a maximum distance apart in the horizontal direction. Two Flex-Lines are merged by copying the segments of one line into the other line and updating the top and bottom points during the process. If there is a gap between the lines, this is filled with segment(s) spanning the smallest vertical overlap (see Fig. 3). The grouping stage is finished when there are no two FlexLines with a suitably high match score.
2. The method The proposed method uses a combination of rulebased grouping of connected components (bottom-up) and projection profile analysis (top-down). The method works with bitonal images. Both input and output are represented using the PAGE format [6]. Text regions, described by their outlines, are populated with detected text lines. Each text region in the input is processed using the following steps: 1. Connected component analysis. 2. Rule-based grouping of connected components to text line candidates. 3. Splitting of large components in undersegmented lines using local projection profile and repeat step 2. 4. Merging small line candidates to their nearest neighbour. 5. Creating final text lines based on the candidates. The above steps are discussed next in more detail.
2.3. Splitting under-segmented lines Due to narrow inter-line spacing, noise or other image distortions, connected components may span across two or more text lines. That will usually also lead to line candidates spanning more than one physical text line. In this step such under-segmented lines are detected and further processed.
2.1. Connected component analysis In this first step connected components are extracted from the part of the page image corresponding to the text region being analysed and “noise” components are filtered out. A component is considered to be noise
336
Line 1
tion marks etc. (e.g. candidates that can be connected at the front or to the end of a line). All line candidates with an average segment height considerably smaller than the average component height of the current region are considered for merging. Again, the nearest neighbours are calculated. If the distance of a line to its neighbour is smaller than a determined threshold and the average component height of the small line is by some extent smaller than the average component height of its nearest neighbour, the lines are merged. If a line has not been merged, an additional check is applied to find commas or other objects at the end of a text line. Therefore the match score used in the grouping step is calculated for the regarded line to all other lines. If the score is above a certain threshold, the lines are merged.
Line 2
Gap
Figure 3 – Merging two Flex-Lines. A line is determined to be under-segmented if the average component height is considerably smaller than the average line segment height. For such a line all high components are analysed to decide if they should be split. A vertical projection-profile is created for the neighbourhood of each high component (see Fig. 4). High component
Profile
2.5. Creating text lines Projection area
The final polygonal text line outlines are generated using a smearing approach. All components of a FlexLine are iteratively combined into one big component by applying horizontal and vertical smearing with increasing smearing distances. If that is not successful, an adaptive diagonal smearing is used to connect the remaining components. Finally, the contour of the resulting connected component is traced and the text line polygon outline is created.
Figure 4 – Profile related to a high component. Valleys within the profile are analysed to ascertain whether they actually correspond to an inter-line space. If such a space is found, the high component is split at the minimum of the corresponding valley. If one or more components have been split, the grouping step is repeated for the line, using the extended set of components. To ensure all under-segmented lines are detected and processed, the whole splitting process (as described above) is repeated until no high components are detected. After each iteration the parameters are adjusted to be less strict.
2.6. Parameter adjustment To allow the method to be tuned for specific classes of documents and tasks by exploiting small differences in layout, A total of 18 parameters affecting segmentation have been identified and made adjustable.. The number of parameters is a direct result of using multiple processing steps and the intention not to use hardwired values. Further, most parameters are coefficients for dynamically calculated thresholds which depend on certain properties of the document image (for instance the average height of connected components). The default parameter settings have been optimised for a broad spectrum of printed historical documents based on the IMPACT Image Repository as a representative collection of material from major European national libraries. In addition, a number of specialised profiles were created for more specific tasks (for instance for typewritten documents). By using an objective performance measure [7] the optimisation step can also be automated. The details of that automated optimisation step are outside the scope of this paper.
2.4. Merging small line candidates Small objects like i-dots, commas, quotation marks etc. that have not been merged to a physical text line during the main grouping phase, are merged to their nearest neighbour in this step. This is done in two stages. First, Flex-Lines with very small components are handled. This is usually the case for i-dots and parts of broken glyphs. For each such line the nearest neighbour line is located by calculating the line distance to all other lines. The distance between two lines is the minimal distance of all possible line segment pairs. If the distance of a line candidate with small components and its nearest neighbour is below a determined threshold, the lines are merged. All line candidates with small components that are not merged in this stage are classified as noise and are discarded. The second stage is similar to the first one, except that the targeted objects are commas, full stops, quota-
3. Experimental results To gain deeper insight into the behaviour of a method and identify problems it is important to have a
337
means of directly evaluating segmentation results. Indirect evaluation strategies, for instance based on OCR results, are not sufficient. The evaluation method that has been used for the experiments is based on line correspondence analysis [7]. Resulting text lines are compared against (manually created, [8]) ground truth text lines, identifying five conditions: Merge, split, miss / partial miss and false detection. A text line segmentation success rate is calculated as a weighted mean of the individual error values for the five types of segmentation errors. Experiments have been carried out on a diverse set of 25 historical documents containing about 2700 text lines. The images are part of the IMPACT dataset representing the holdings of national and other major European libraries. It can be accessed through the IMPACT Centre of Competence [9]. The proposed method has been compared against three other representative approaches: Firstly, a bottom-up approach based on grouping connected components by estimating a certain text line slope and, secondly, a top-down method using a vertical projection-profile to identify inter-line spaces. Both those approaches have been implemented in-house to the same standard as the proposed approach. Finally, a leading commercial system (ABBYY FineReader Engine 9.0 [10]) has been used to extract text lines as a benchmark of the performance of a professional system (while not tuned to historical documents, it is the system used by most service providers in library digitisation projects). Table 1 shows the results. It can be observed that the hybrid method, clearly delivers better results than the single strategies on their own. All three approaches created for historical documents outperform the standard modern-document commercial system.
Processing time averages ten seconds per fullresolution page on a two-core system at 2.4 GHz.
Figure 5 – Example of segmented text lines.
4. Concluding remarks A robust hybrid text line segmentation approach has been presented that combines the advantages of top-down and bottom-up approaches and thereby exceeds the performance of two reference single-strategy methods. The proposed method has been successfully tested on a diverse dataset of representative historical documents. It has been designed with flexibility in mind and can be tuned for different document classes. The method is accessible for use in workflows through the IMPACT Centre of Competence [9].
References [1] IMPACT (IMProving ACcess to Text) project: http://www.impact-project.eu/ [2] A. Antonacopoulos, “Large-Scale Digitisation and Recognition of Historical Documents: Challenges and Opportunities for Image Processing and Analysis”, Proc. SSBA2010, 2010. [3] A. Antonacopoulos, “Page Segmentation Using the Description of the Background”, CVIU 70(3), 1998, pp. 350-369. [4] L. Likforman-Sulem, A. Zahour and B. Taconet, “Text line segmentation of historical documents: a survey”, IJDAR (2007) 9, pp. 123–138. [5] N. Ouwayed, A. Belaïd, “A General Approach for Multioriented Text Line Extraction of Handwritten Documents”, IJDAR (2011), pp.: 1-18. [6] S. Pletschacher and A. Antonacopoulos. “The PAGE (Page Analysis and Ground-Truth Elements) Format Framework”, Proc. ICPR2010, 2010, pp. 257-260. [7] C. Clausner, S. Pletschacher, A. Antonacopoulos. “Scenario Driven In-Depth Performance Evaluation of Document Layout Analysis Methods”. Proc. ICDAR2011, 2011, pp. 1404-1408. [8] C. Clausner, S. Pletschacher and A. Antonacopoulos, "Aletheia - An Advanced Document Layout and Text Ground-Truthing System for Production Environments”. Proc. ICDAR2011, 2011, pp. 48-52. [9] IMPACT Centre of Competence: http://www.digitisation.eu/ [10] ABBYY FineReader Engine 9.0: http://www.abbyy.com
Table 1 – Evaluation results. Method Success Rate Hybrid 99.6% Component based 96.2% Projection profile based 95.2% ABBYY FRE 9.0 90.9% Figure 5 shows the segmentation result for one example. It can be observed, that the component spanning the first two lines has been split correctly. Despite the majority of small components components being correctly assigned to text lines, small components that touch a neighbour line, as can be seen in line nine and ten of the example, can cause segmentation errors. The small o above the u, for instance, has been incorrectly recognised as belonging to the previous line.
338