Mathieu Decuyperab, Ben DeVriesa, Jan Verbesselta, Shijo Josephb, Christopher Martiusb and Martin. Herolda. aLaboratory of Geo-Information Science and ...
A robust method for monitoring net forest disturbances in two South American sites with different data density. Mathieu Decuyperab, Ben DeVriesa, Jan Verbesselta, Shijo Josephb, Christopher Martiusb and Martin Herolda a Laboratory of Geo-Information Science and Remote Sensing, Wageningen University, Wageningen,The Netherlands b Centre for International Forestry Research, Bogor, Indonesia
Introduction Tropical forests account for ~50% of the total global aboveground biomass and play an essential role in the global carbon cycle (Hunter et al., 2013). REDD+ (Reducing Emissions from Deforestation and forest Degradation) provides results-based finance to several activities which reduce CO2 emissions through promoting forest conservation, sustainable management of forests and enhancing carbon stocks (UNFCCC, 2014). Within the REDD+ framework an MRV (Measuring, Reporting and Verification) component is required to measure the effectiveness of the REDD+ intervention. In many cases, MRV approaches are facilitated by large scale and high spatio-temporal resolution satellite data to monitor and quantify forest change to fulfil measuring and reporting requirements. Once hotspots are detected it makes it easier for the ground teams to verify the changes and report on the drivers of forest disturbance (Pratihast et al., 2014). In contrast to most forest disturbance monitoring algorithms using annual or near-annual data (e.g. Hansen et al., 2013), this study uses all available Landsat data within a timeframe of 25 years (1990-2014). We applied the BFAST monitor algorithm to detect and quantify annual changes (Verbesselt et al., 2012; DeVries et al., 2015) and to provide the relative amount of disturbed forest (ha disturbed/ total forest area in 2000) per site. For all pixels flagged as disturbed, post-disturbance monitoring was applied to detect regrowth and calculate the net forest change. Furthermore we test the robustness of the BFAST algorithm by comparing the two sites with different data density (e.g. due to the number of scenes available and data loss due to clouds). Methods Our study sites are in the tropical forests of Madre de Dios (Peru) and Para (Brazil) and are characterized by frequent cloud cover. Forest disturbances in these areas are mostly large scale clear-cut areas to make way for agriculture, mining or pastures. A recent study by Asner et al. (2013) showed the large impacts of gold mining along the rivers in Madre de Dios. Besides mining, agricultural expansion (e.g. papaya plantations) is a main driver of disturbance. The BFAST Monitor method is based on the principles of structural change monitoring, where significant deviations from a stable history period are interpreted as breakpoints (Verbesselt et al., 2012). The Madre de Dios site was covered by Landsat scenes at WRS-II path/row 2/68 and 2/69, and the Para site path/row 224/63, 225/62 and 225/63. All available level-1 terrain-corrected (L1T) Landsat scenes (L4-5 TM, LE7 ETM+ and L8 OLI/TIRS) were downloaded and processed using the available LEDAPS and FMASK algorithms (Masek and Vermote, 2006, Zhu and Woodcock, 2012). We made use of the Normalized Difference Vegetation Index (NDVI), since it is one of the most commonly used indices in vegetation monitoring and has been shown to be able to capture forest disturbances using time series analysis (Dutrieux et al., 2014, Reiche et al., 2015, DeVries et al., 2015). Since the NDVI signal is easily saturated, we used the Normalized Difference Water Index (NDMI) to apply the regrowth algorithm on. The regrowth algorithm could be seen as a reversed BFAST monitoring breakpoint functionality of structural changes in the time series (DeVries et al., under review). Here, the history period before the disturbance was used and a 3 year threshold after the disturbance was used to safeguard ecologically sound regrowth detection, thus avoiding false detections due agricultural plantations (e.g. papaya plantations).
Pre-processing steps included the removal of outlier pixels and haze contaminated scenes. The outliers could be seen as isolated unmasked pixels along the interface between the SLC (Scan Line Corrector) stripes of the Landsat 7 ETM+ data, and clouds. These outliers were removed by a 5-pixel sieve. A baseline non-forest cover map for the year 2000 was made based on the cloud free Landsat images for both areas. To classify non-forest and forest, an interactive supervised classification in ArcMap (10.2.1) was used and validated by visual interpretation. Validation was carried out by a random selection of change and no-change pixels. To give a more realistic representation of omission errors (i.e. most of the area is forest), we stratified the area with a 4 km road buffer. An approach based on the timeSync method (Cohen et al., 2010) using all Landsat and RapidEye data in combination with high resolution Google Earth images was used to visually identify disturbances and regrowth. Results and conclusions The number of available scenes after all pre-processing steps for each path/row were: p2/68 (319 of 653); p2r69 (333 of 670); p224r63 (226 of 606); p225r62 (206 of 617) and p225r63 (183 of 634). For all path/rows, the number of scenes in the Para site were much lower and is mainly caused by cloud coverage (figure 1).
Fig. 1: Map with number of scenes per year for Madre de Dios (left) and Para (right). The relative annual disturbance rates (ha disturbed area / total forest area in 2000*100) in Madre de Dios are between 0.03% and 0.57% (2002 and 2007, and between 0.02% and 3.45% (2002 and 2005) in Para (figure 2). An example of a pixel with forest disturbance (mining) can be seen in figure 3. Relative regrowth rates (ha of regrowth area / ha disturbed area *100) ranged between 0.1% and 15% in both sites.
Fig. 2: Relative annual disturbance rates (%)
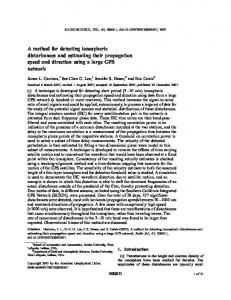
NDVI
BFAST monitoring output
Year 2004
2012
Fig.3: Example of a pixel flagged as disturbed (in this case due to mining) by the BFAST algorithm (red dotted line shows the breakpoint). Below is the visual assessment via high resolution Google Earth imagery. Based on our validation we estimated overall accuracies for the disturbance monitoring above 85% for both areas, with producer accuracies around 90% and user accuracy around 85%. For the regrowth monitoring we obtained producer accuracies around 80% and user accuracy around 65% for both sites. Besides the relatively high accuracies, especially for the disturbance monitoring, the low deviations in accuracy between the areas indicate the robustness of the method and its potential applicability in several tropical forests in South-America. This also means that in areas with higher cloud densities (thus less available scenes) as in the case of the Para site, it is still possible to obtain accurate detections. The outcome of this study could be useful for REDD+ MRV to provide annual deforestation rates and potentially near real time forest disturbanceregrowth monitoring.
2013
References Asner, G. P., Llactayo, W., Tupayachi, R., & Luna, E. R. (2013). Elevated rates of gold mining in the Amazon revealed through high-resolution monitoring. Proceedings of the National Academy of Sciences of the United States of America, 110(46), 18454–9. doi:10.1073/pnas.1318271110 Cohen, W.B., Yang, Z., Kennedy, R., 2010. Detecting trends in forest disturbance and recovery using yearly Landsat time series: 2. TimeSync - Tools for calibration and validation. Remote Sens. Environ. 114, 2911–2924. doi:10.1016/j.rse.2010.07.010 DeVries, B., Verbesselt, J., Kooistra, L., & Herold, M. (2015). Robust monitoring of small-scale forest disturbances in a tropical montane forest using Landsat time series. Remote Sensing of Environment. doi:10.1016/j.rse.2015.02.012 DeVries, B., Decuyper, M., Verbesselt, J., Zeileis, A., Herold, M., Joseph, S. (under review). Tracking disturbance-regrowth dynamics in tropical forests using structural change detection and Landsat time series. Remote Sensing of Environment. Dutrieux, L., Verbesselt, J., Kooistra, L., & Herold M. (2014). Near real time monitoring of forest cover loss using multiple data streams. ISPRS Journal of Photogrammetry and Remote Sensing, 2014. Hansen, M. C., Potapov, P. V, Moore, R., Hancher, M., Turubanova, S. a, & Tyukavina, a. (2013). HighResolution Global Maps of. Science, 342(November), 850–853. doi:10.1126/science.1244693 Hunter, M. O., Keller, M., Victoria, D., & Morton, D. C. (2013). Tree height and tropical forest biomass estimation. Biogeosciences, 10, 8385–8399. doi:10.5194/bg-10-8385-2013 Masek, J., & Vermote, E. (2006). A Landsat surface reflectance dataset for North America, 1990-2000. IEEE Geoscience and Remote Sensing Letters, 3(1), 68–72. Retrieved from http://ieeexplore.ieee.org/xpls/abs_all.jsp?arnumber=1576692 Pratihast, A., DeVries, B., Avitabile, V., de Bruin, S., Kooistra, L., Tekle, M., & Herold, M. (2014). Combining Satellite Data and Community-Based Observations for Forest Monitoring. Forests, 2464–2489. doi:10.3390/f5102464 Reiche, J., Verbesselt, J., Hoekman, D., & Herold, M. (2015). Remote Sensing of Environment Fusing Landsat and SAR time series to detect deforestation in the tropics. Remote Sensing of Environment, 156, 276–293. doi:10.1016/j.rse.2014.10.001 UNFCCC, 2014. http://unfccc.int/land_use_and_climate_change/redd/items/7377.php Verbesselt, J., Zeileis, A., & Herold, M. (2012a). Near real-time disturbance detection using satellite image time series. Remote Sensing of Environment, 123, 98–108. doi:10.1016/j.rse.2012.02.022 Verbesselt, J., Zeileis, A., & Herold, M. (2012b). Near real-time disturbance detection using satellite image time series. Remote Sensing of Environment, 123, 98–108. doi:10.1016/j.rse.2012.02.022 Zhu, Z., & Woodcock, C. E. (2012). Object-based cloud and cloud shadow detection in Landsat imagery. Remote Sensing of Environment, 118, 83–94. doi:10.1016/j.rse.2011.10.028