that the service risk o and the risk of the whole network are also reduced. Keywordsâpower communication network; service risk; routing optimization; risk ...
A Routing Optimization Method based on Risk Prediction for Communication Services in Smart Grid Puyuan Zhao, Peng Yu, Chenchen Ji, Lei Feng, WenJing Li State Key Laboratory of Networking and Switching Technology Beijing University of Posts and Telecommunications Beijing 100876, China an increasingly critical role in the operation of electricity power system [4].
Abstract—As power communication network is more and more important in smart grid, to decrease the failure risk of power system caused by the interruption of communication service, this paper propose a novel routing optimization method based on risk predication for communication services. Firstly, we analyze the probability of failure of communication link and node which is induced by external factors, like winds and snows, equipment failures, and etc. Then based on importance of services, links and nodes, we calculate the risk of failure of communication link and node. Further, we propose three service risk indicators and corresponding improved Dijkstra algorithms to optimize service routing, thus to decrease the network failure probability. Finally, based on part of power grid topology structure from a Chinese province, the simulation results show that the service risk o and the risk of the whole network are also reduced. Keywords—power communication routing optimization; risk prediction
network;
service
Power communication network transmits or exchanges messages based on specific protocols or agreements, which can automatically control or manage the power grid. The power grid supplies electricity to the communication network, since the equipment of communication network is installed on the power grid. The grid and the communication system can be constituted as a coupling network [5]. In Fig.1, power station, substation, and loading of electric power grid can be regarded as nodes, and power lines as edges in power grid. Likewise, control centers, and SCADA system, are considered as nodes and communication lines as edges in power communication network. The solid line in Fig.1 is the interconnection inside networks and dotted line is the coupling connection between two networks. In coupling network, when external factors cause power communication network malfunctions, not only the corresponding power grid node has operational faults, but also the service running on the communication network is interrupted [6].
risk;
I. INTRODUCTION The latest information and communication technologies (ICT) network is integrated with power system to form the smart grid. The ICT network is responsible for fast data transmit among system components and control centers [1]. One of the key defining functions of smart grid is to improve power quality and reliability, and enhance resiliency to attack, natural disaster and system disturbances, which are supported by ICT networks [2]. With the development of smart gird, ICT networks can transmit or exchange services based on specific protocols or agreements. The communication services can manage, monitor and control the power system. At present in China, the electric power communication network or ICT network for power grid is constructed by optical fiber which provides generation and management functions. These fibers are inevitably affected by natural disasters, man-made destruction, aging equipment, installation defects and other factors, resulting in interruption of information communications, and delay of incident disposal. For example, In early 2008, the South of China suffered snow and ice disasters. Because of the storms, a large number of interconnection cables of the core backbone network broke off, resulting in disintegrating the operation of the communication network. GuiZhou Power Grid and part of YunNan Power Grid, GuangXi Power Grid were decomposed into a plurality of isolated grids, which greatly affect the recovery of electric power system [3]. The facts show that the ICT networks play
978-3-901882-85-2 (c) 2016 IFIP
Fig.1 The schematic of coupling network about power grid and power commnunication network�
There are some achieved results about the correlation between power grid and communication network. On the basis of coupling characteristics of the two networks and loading characteristics, [7] studied an evaluation method of node importance for coupling networks, in which the cascading failure is taken into account. This method is proposed and based on the topological incidence relation between power grid and communication network. It focuses primarily on the node load of power grid changing, but lacks the study of services on the communication network. [8] proposed a method to study the impact of communication system interruption on the wide area protection and control system based on the risk index. The risk index is proposed to identify the important communication links for the wide area protection and control system. However, this paper has lack of consideration about the services running on the communication links and nodes. The interruption of communication link has impacted on security
377
GISN Full Paper
and control measures as well as on the transmitting services. Therefore, our paper will integrate service importance and the number of services running on the link and node to calculate the service risk caused by link interruption.
A. Correlation between External Factors and Equipment Failure Firstly, we analyze the failure probability of link and node. Various types of reasons can cause communication link interruption, such as earthquakes, and tsunamis leading to the damage of equipment and cable; the aging, and quality defects of cable and equipment leading to improper operation; and misuse of maintenance personnel leading to the interruption of link. The external factors which cause link interruption can be classified by nature factor, equipment factor and human factor.
In the following sections, Section II describes the risk assessment method of power communication network, based on the correlation between external factors and link faults and using link and node risk index. It also analyzes the impact of service interruption on the power grid. Section III proposes an improved Dijkstra algorithm based on service risk index. This algorithm can select a service path, of which the service risk index is minimum, in order to balance the network risk. Section IV will calculate the risk index of different services in specific application scenarios, design new route for current service and observe the risk index changes under various algorithms. Section V concludes this paper, indicates defects of the paper and points out future research directions.
1) For nature factor i: We define ni(t) as the number of its occurrence during time interval (−∞, t ) . All nature factors form a set N= {1, 2, …, i}. Different levels of nature factors can have different damage and the difference between levels is almost increased by exponential. For example, the influence of breeze is almost not taken into account, however, the fierce wind can blow off a cable. We set the level of nature factor at time t as li, then the probability of occurrence of nature factor i at time t can be:
II. SERVICE RISK ASSESSMENT OF POWER COMMUNICATION NETWORK The communication service is the message transmitted or exchanged on the equipment, such as terminal equipment, exchange system, and transmission system. The service can automatically control or manage the power system and can be classified in the service of operation of power system, such as relay protection service and security control service, and the service of management of enterprise, such as administrative telephone service. Service risk is one of the research objects of power communication network risk management. The assessment of power communication network service risk aims to understand what is the current and future risk and assesses the impact of this risk. Thus, risk index can be used to develop risk control strategies.
pi (t ) = f (li , t )
ni (t ) ¦ i∈N ni (t )
(1)
Where, f(li,t) is the impact of nature factor i with the level li at time t. Only when the level of nature factor is high enough, can nature factor have an impact on equipment. Then f(li,t) can be defined as follows: e( li −li ) ,l ≥ l0 ° f (li , t ) = ® e( limax − li0 ) i i , at time t ° 0 , li < li0 ¯ 0
(2)
Where, li0 means the initial level of the impact of nature factor, limax means the maximum level. In general, the higher the level, the greater the impact. If the current factor i does not happen, set li = 0. 2) For equipment factor i: Since the aging and defects of device and cable can be caused by the device degeneration as time goes by. Then for equipment factor i, the probability of occurrence pi(t) within time interval (−∞, t ) can be defined as an exponential function about specific duration Ti (e.g. working life):
Fig.2 The flow chart of service risk assessment� Based on the theory of risk, we firstly develop the fault probability of communication link and device node considering external factors. Then we calculate the risk index of link and node which means the impact extent of link or node failure. After that, we calculate the risk of communication link and node, and obtain the risk of service transmitting on the communication network. Fig.2 is the risk assessment flow chart. According to graph theory, G(V,E) defines as the topology of the communication network, where V represents the set of nodes and E represents the set of communication links.
pi (t )=1 − e
−
t Ti
(3)
3) For human factor i: Similarly we define ni(t) as the number of times which it occurs in the time interval (−∞, t ) . Since human factor is always random, its process can be considered as the Poisson Distribution. Then pi(t), the probability of occurrence of human
378
GISN Full Paper
factor i, is defined and Ȝi is the average arrival rate of human factor i: pi (t )=1 − e − λi ni ( t )
telephone service. Thus risk consequence is related with link importance, node importance, service importance and service number. We define S = {sk, sk =1, 2, …} as the set of service carried on the link or node, and there are k types of services. dk is the service importance index for service sk. The number of each type of service is nk. When the communication link eij is interrupted, the risk index Reij can be expressed as:
(4)
We suppose all kinds of factors are independent of each other. Also in the set of the same kind of factors, factors are mutually exclusive. We set M as the total number of external factors which cause link and equipment failure, nf as the kind of factor. And all external factors form a set called F = {1, 2, …, Fk}, where Fk represents different kinds of external factors. There exist the following relationships:
Reij = Peij ⋅ Ceij = PeGij ( t ) ⋅ Ceij = PeGij ( t ) ⋅ I eij × ¦ d k nk
Where, Peij is the probability of interruption occurrence of
| F |= n f ° ® °¯ ¦ Fk ∈F | Fk | = M
the communication link, and I eij represents the link importance
(5)
of the communication link eij. Similarly, the risk index Cvi of communication node vi is expressed as:
For fault Gj (including link and node failures), according to historical data and experience analysis, we define FG as the set of external factors which may cause failures, and i as factor of the set. Suppose PjG (t ) as the probability of occurrence of
Rvi = Pvi ⋅ Cvi = PvGi ( t ) ⋅ Cvi = PvGi ( t ) ⋅ I vi × ¦ d k nk (11) sk ∈S
The importance of the communication link and node can be quantified to different levels depending on the degree and scale of nodes and links.
faults and pkjF (t ) as the probability of occurrence of factors from FG . Then the probability of occurrence of fault Gj can be defined as:
∏ (1 − p
PjG (t ) = 1 −
F kj
(t ))
C. Risk Index of Service Failure Communication service is carried from one site to another, and must go through at least one communication line. When link interrupts or nodes failure happens, the service transmitted will be interrupted, which influences the operation of the communication network, even causes the communication security incident of power grid. Therefore, the risk of service interruption is related to the risk of link and node which it is routed through.
(6)
Fk ∈FG
Thusˈwe can get the probability of occurrence of link eij interruption Peij (t ) and occurrence of node vi failure Pvi (t ) .are defined as
Peij (t ) = 1 −
Pvi (t ) = 1 −
∏ (1 − p
(t ))
(7)
∏ (1 − p
(t ))
(8)
Fk eij
Fk ∈FG
Fk ∈FG
Fk vi
(10)
sk ∈S
We suppose that communication links and nodes are alternately connected with each other to form a route w. The route which service s passes is defined as ws. ws = {Vs , Es | vi ∈ Vs , eij ∈ Es } , and there are |Vs| nodes and |Es|
links on the route ws. Since service is carried on the route, the service risk can be defined from different angles. The service risk can be considered as, e.g. the accumulated risk of all the link risk and node risk in the route, or the average risk of the route risk, or the maximum risk among all links risk and nodes. Following is the definition:
B. Risk Index of Communication Link and Node Failure Risk usually refers to the uncertainty of failures, and can be expressed as the product of the probability of failure occurrence and loss, where Risk = Failure Probability h Risk Consequence. When the level of link or node is higher in the network, the failure influence of link or node on service could be more serious. The number of services carried on the link or node is larger, the failure of link or node will affect more services. Different types of service transmitting on the communication network have different roles for power grid. Some types of service can protect the operation of power grid safely with high service importance, like delay protection of which interruption can cause irreparable damage to the power grid. The failure of some types of service can only affect the daily office work with low service importance, like conference
1) Accumulate all the link risk and node risk The risk of service s passing through route ws, Rs can be calculated by summing all the link risk and node risk on the route, represented as: Rs =
¦R
+
¦C
⋅ Pvi +
vi ∈Vs
=
vi ∈Vs
vi
vi
¦R
eij ∈Es
eij
¦C
eij ∈Es
eij
⋅ Peij
(12)
2) Average the link risk and node risk
379
GISN Full Paper
Step 5: Repeat Step 3 and 4, until the destination node dstn is added to S, or dstn ∈ S . Therefore, obtain the route Route(dstn) from the source src to the destination dstn whose risk is minimum.
When the differences between the service route is large, the average risk of the route, Rs' is defined to represent the average degree of service risk.
This algorithm is based on original Dijkstra Algorithm. The differences between these two algorithms are: i) Original Dijkstra algorithm produces the shortest path according to the increment of path length. In our paper, the selecting standard is defined as the risk index rather than path length; ii) Original Dijkstra algorithm only considers the weight of link and regards the weight of node. Applied to power communication network, the selecting standard of the improved algorithm is the sum of link risk and node risk.
Rs' = Rs Es + Vs =
¦C
vi ∈Vs
vi
¦C
⋅ Pvi
Es + Vs
+
eij ∈Es
eij
⋅ Peij
(13)
Es + Vs
Where, |Es|+|Vs| represents the total number of links and nodes on the route ws which service s passes through.
3) Select the maximum among link risk and node risk The maximum among the risk of links and nodes on the route is considered as the risk of service s, Rs'' represented as:
(
Rs'' = max Rvi , Reij | vi ∈ Vs , eij ∈ Es
)
B. Average Risk as Weights – Average Optimization Method Be similar with first algorithm, except in Step 2 setting the accumulated value of link risk and node risk as the weight, or the distance of each node is d ( vz ) = Rsrcvz + Rvz . The weight is
(14)
modified to be the average risk value of the route, or the Rsrcvz + Rvz distance of each node becomes d ( vz ) = z +1
III. AN OPTIMIZIATION ALGORITHM ABOUT SERVICE RISK BASED ON RISK INDEX
C. Max Risk as Weights – Maximum Optimzation Method In the third method defining service risk, the service risk is considered as the maximal risk among that of links and nodes on this route. Therefore, the way to optimize the route is to avoid the maximal risk of node or link and choose a new route.
The service risk can be calculated by the risk of link and node on the service route. Based on the link risk and node risk, we optimize the risk of the service which is transferred between two nodes using Dijkstra Algorithm to obtain the minimum risk value.
IV. CASE ANALYSIS
A. Accumulated Risk as Weights – Sum Optimization Method The algorithm is shown here:
A. Description of Simulation Scenarios
Step 1: Initialize, and set S={src}. S is the set of determined nodes whose risk is minimal. src is the initial node, and dstn is the destination node. Define Q=V-S as the set of undetermined nodes. V is the set of all nodes in the network. Step 2: For vz ∈ Q , z ∈ {1, 2,..., k} , d(vz) is the distance between nodes vz and source src. If vz is adjacent to the source node, then d ( vz ) = Rsrcvz + Rvz ; if not, then d(vz) =. Set
d(src)=0. Rvi and Rvi u represent the risk value of node vi and edge evi u between vi and its adjacent node u, vi , u ∈ Q , or set
the sum of node risk and link risk as the weight, between nodes is about risk value and link risk and value as a weight, seen from (10)(11).
Fig.3 The topological diagram of part of a power grid� We choose part of power grid topology graph and do case analysis. The topology schematic diagram is shown in Fig.3 Since power network is coupling with the communication network, this diagram can be used to represent the topology of power communication network. Meanwhile, there are ten routes of relay protection service. In Fig.3, the level of different sites indicates and the communication links is labelled by numbers for result representation.
Step 3: Select vz whose d(vz) is minimum from the set Q, and add vz into the set S, Q=Q-{vz}, Route ( vz ) = {src} ∪ {vz } . Step 4: Set vz as the new intermediate point, and modify the distances of each nodes in Q. If the distance from the source src to node u ( u ∈ Q ) through node vz is shorter than the original distance without through node vz, modify the distance of node u and the new value of d(vz) is d ( u ) = d ( vz ) + Rvz u + Ru .
B. Probability of Occurrence of Link and Node Failure For the probability of failure to occur, we suppose that Link17 (Node A2-Node B6) broke down because of human
380
GISN Full Paper
protection service, and their importance is 10. The importance of Control Centers, 500kV Stations, 220kV Stations are 5.8, 3.44, and 1.86, respectively. The importance of Control Center Links, 500kV Station Links, 220kV Station Links are 5.17, 2.54, and 1.25, respectively. Calculate the link risk and node risk, shown in TABLE II. From TABLE II, the nodes and links with high risk are at a more important level or role, resulting in having a larger probability of failure. Thus they should be paid more attentions.
error, and the weather forecast said that a strong snowstorm would be coming. Therefore, the whole communication network is facing a huge threat. We need to calculate the probability of failure about link and node and the risk of current service, also need to offer an optimization proposal. According to the history, we list and classify the external factors about the failure, including: i) nature factor: snow disasters, strong winds, and heavy rains; ii) Equipment factor: natural aging; iii) Human factor: movement of optical cable, and interruption by construction. So far, the number of external factors having caused the interruption of the link is 1000 times, including snow disasters ten times, strong winds eight times, heavy rains 12 times, movement of optical cables five times and interruption by construction 20 times.
TABLE I THE PROBABILITY OF LINK AND NODE FAILURE Failure Probability < 0.05 > 0.05
1) Nature Factors We set the level of impact of snow corresponding with the level of snow, from one to six, the level of wind from zero to twelve, the level of rain from one to seven. We suppose the initial level of snow which can cause damage to the equipment is Level 2, the initial level of rain is Level 4, the initial level of wind is Level 6. And in this situation, there are Level 5 snow storm and Level 8 high wind. We calculate the probability of failures caused by these three nature factors from (1)(2) are 0.333e-1, 0.267e-4, 0 in turn.
Number of Nodes 14 3
Number of Links 23 3
TABLE II THE RISK OF NODES AND LINKS Risk 3
Number of Nodes 13 4
Number of Links 22 4
D. Service Risk of Initial Routes Based on the risk values obtained by the communication link and node equipment, combined with equation (12) (13) (14) can be obtained at three defined risk value on the network laid 10 operations (for delay in 10ms within), as shown in TABLE III. In TABLE III, the maximal service risks of three definitions are Route 9, Route 10, Route 9/10 marked with red. In the first definition, the differences between service risk equaling to ‘Route Risk’ are large. In the second definition, the variation of service risk equaling to ‘Average Route Risk’ is less. And in the third definition, some of service risks equaling to ‘Maximal Risk among Route’ may be same, since the link risk or node risk on the route may be the same.
2) Equipment Factors The use time of the link is three years, and its working life is ten years. From (3), we calculate the probability of failure caused by natural aging is 1-e-0.3. 3) Human Factors We suppose the average arrival rates of movement of optical fiber and interruption by construction are 0.001 and 0.002. And the movement of optical fiber is existing currently, without construction. Then we obtain the probability of failure caused by movement of optical fiber and interruption by construction are 1-e-0.005, 0 from (4).
TABLE III THE SERVICE RISKS OF THREE DEFINITIONS
Using (7), the probability of failure of Link17 which may be caused by any external factors is 0.356, that is, under the current situation, Link17 has a rather high probability to break down. Maintenance personnel should pay more attention to it, and check relevant hidden troubles.
no
Service Route
1
A1-B8-B6-B5-B4 A3-B4-B5-B6B8-B7 A4-A3-A2-B8 B4-A3-A1 A5-A4-A3-A2 A5-B1-B2-C1 A5-A6-B3-C3 B1-B2-C1-C2 A1-A6-B3-C3-C2 B7-C3-B2-C1
2 3 4 5 6 7 8 9 10
C. Risk Index of Links & Nodes We can obtain the probabilities of failure of each link and node considering the nature factors, equipment factors, and human factors, as shown in TABLE I.
11.8276
Average Route Risk 1.3142
Maximal Risk among Route 1.5557
1.196
20.1062
1.8278
1.9206
0.567 0.373 0.652 0.394 0.412 0.379 0.431 0.119
22.4463 14.3290 23.7372 17.5181 21.3687 18.2629 25.5453 25.1407
3.2066 2.8658 3.3910 2.5026 3.0527 2.6090 2.8384 3.5915
8.5463 8.5463 8.5463 6.4863 5.5081 6.4863 9.1124 9.1124
Delay (ms)
Route Risk
1.202
In TABLE I, most of nodes and links have a small failure probability. Some nodes and links, like Node A2, A3 and C3, and Link 5(A2-A3), 6 (A3-A4), 23 (B3-C3) have rather higher probability of failure. The nodes with higher probability are always connected with multiple communication link, or with another node. If the node breaks down, quite a few links will be impacted, and other nodes cannot transfer service using this node. The links having higher probability of failure often joint different level of optical fiber or equipment.
E. Optimized Routes & its Service Risk We re-plan routes of the ten services using the optimization algorithms. There are three kinds of results based on three different methods of which the service risks are decreased and time delays are still within 10ms which is one of the index to evaluate the QoS of communication service.
[9] provides different levels of communication link and node importance degree. There are ten routes about relay
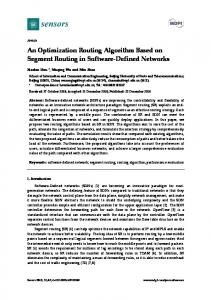
Fig.4 shows the relative risk reduction between initial routes and optimized routes using three types of optimization
381
GISN Full Paper
quantify the external factors and calculate the probability of failure of node and link which is the caused by different kinds of factors. Then combined with the service importance degree and link and node importance, we calculate the consequence value of the node and link if they are out-of-order. Using probability and risk consequence value, we obtain the risk of node and link and calculate the service risk according to the service route. Finally, we optimize the service risk employing Dijikstra Algorithm with different weights to reduce the service and network risk. Different algorithms have different optimization effects, wherein the algorithm setting the accumulation risk as weight can balance the link and node risks and reduce the network risk better.
methods. The risks of updated routes are all less than or equal to that of the original routes using three optimization methods. The averages of the 3 types of relative risk reduction are 19%, 39%, 34% in turn. Thus, the average optimization method can reduce the service risk lowest, then maximum optimization method, finally the sum optimization method. When set the mean value of risk as weight to optimize the route, it always selects the route B8-B6-B5-B4 whose average risk is rather little.
The route optimization method in this paper may not consider the risk balance or the risk reduction of the whole network, Also, some other QoS index of communication service should be taken into consideration. In the future, we will study on the risk balance of network and QoS of communication service. ACKNOWLEDGMENT (Heading 5)
Fig.4 The percentage of relative reduction between initail routes and optimized routes using 3 types of optimization methods
This work was supported by the 863 Program (Grant No.2015AA01A705) and National Natural Science Foundation of China (NSFC) (Grant No.61271187). REFERENCES [1]
[2]
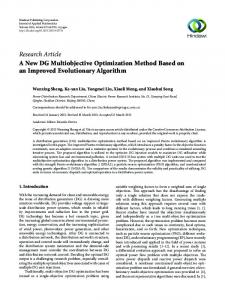
Fig.5 The network risks of initial state and three optimized methods
[3]
We re-lay these optimized routes in the network, and obtain the risk of network, shown in Fig.5. For the first and third algorithms, the risks of whole network are both reduced. And the sum optimization method has a better optimization which decreased the risk of network obviously. However, for average optimization method, the risk of the updated network is increased. Because the initial risks of Node B3, B4, B5 and connected links are rather smaller, the optimized routes always select this route B3-B4-B5 to transmit services. Thus, the number of services on the route B3-B4-B5 is increased, and the risk of network becomes larger than before.
[4]
[5]
[6]
[7]
In conclusion, average optimization algorithm can reduce service risk at most, but the risk of whole network may be not reduced. Sum optimization method can make the risk of nodes and links more balanced and the risk of network decreased most. And the maximum optimization method is in between.
[8]
[9]
V. CONCLUSION The purpose of this paper is to analyze the risk of service in the network, and optimize the route of the service. Firstly, we
382
V. Salehi, A. Mohamed, A. Mazloomzadeh, and O. A. Mohammed, " Laboratory-Based Smart Power System, Part II: Control, Monitoring, and Protection,," IEEE Transactions on Smart Grid, vol 3, pp. 14051417, 2012. V. Kounev, M. Lévesque, D. Tipper, and T. Gomes, "Reliable Communication Networks for Smart Grid Transmission Systems," Journal of Network and Systems Management, vol. 24, pp. 629-652, 2016. HU Xianze, “Countemeasure of GuiZhou power information and commuincation network after the snowstorm,” Telecomunications for Elcectirc Power System, vol.29, pp. 4-7, 2008. Langer, Lucie, P. Smith, and M. Hutle, "Smart grid cybersecurity risk assessment," International Symposium on Smart Electric Distribution Systems and Technologies IEEE, pp.475-482, 2015. F. Bamdad, F. Yong and W. Lei, "Reliability assessment of smart grid considering direct cyber-power interdependencies," IEEE Transactions on Smart Grid, vol. 3, pp. 1515-1524, January 2012. F.Bamdad, and F. Yong, "Faults and failures in cyber-power interdependent networks," in 2014 IEEE PES T&D Conference and Exposition, pp. 1-5, 2014. WU Runze, ZHANG Baojian, and TANG Liangrui, "A cascading failure based nodal importance evaluation method applied in dual network coupling model," Power System Technology, pp. 1053-1058, 2015. Yan Jiamei, Xu Jianbing, NI Ming and YU Wenjie, "Impact of communication system interruption on power system wide area protection and control system," Automation of Electric Power System, pp. 17-24, 2016. ZHAO Ziyan, and LIU Jianming, "A new service risk balancing based method to evalute reliability of electric power communication network, " Power System Technology, pp. 209-213, October, 2011.
GISN Full Paper