A Runtime Debugger for Massively Parallel Programming Daigo Sekita, Nobuyuki Ichiyoshi, Toshihiro Nishioka, Masayasu Murano, and Hiroshi Yoshimitsu fsekita,ichiyoshi,nishioka,murano,
[email protected] RWCP Massively Parallel Systems MRI Laboratory 1
Introduction
2.1 Between the debugger and the user
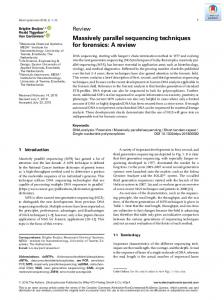
User must control the threads for inspecting data through the debugger. If the user must control the threads and specify data to inspect one by one, the operation must be very complicated. Some debugging abstraction in according to the semantics of programs or programming languages is strongly needed for scalable usage. And a user interface is another subject. Many parallel (but not massively parallel) debugger has their dedicated windows and command interpreters for each threads. This method may be a good idea 2 Design Goal for low parallel programs, but will cause a problem Our design goal is to realize “scalable debugging when the threads in a program become huge. tool”. The term “scalable” has two meanings, i.e.: 2.2 Between the processors and the debugger Scalable usage: The debugger must communicate with the procesA parallel program consists of a large number sors for collecting or distributing controlling mesof threads. Even if the number of threads con- sages and data from/to the threads. For this commutained in a program increases, the debugging nication, a bottleneck may occur at the debugger. manner or operation must be uniform. For example, suppose “conditional break point” facility which is equipped in Gdb, which allow user Scalable implementation: to specify some condition (like “if variable ‘x’ is not zero”) for indicating to break a program or not We intend that how many processors to use really at some thread reaches to the break point. This for the execution of the debugged program, the function is implemented as 1) a debugger catches the performance must not be worse. program reaches to the point, 2) a debugger checks the associated condition is true or not, and 3) if the Figure 1 shows a typical debugging system. condition is true the debugger really breaks the program, else resume the execution of the thread as if there is no reach to break point. If all the checking that “the condition is true or not” must be done at the Debugged debugger, the performance of debugging will be very User Debugger program bad because of the communication bottleneck and the process switchings between the debugged procontrol/data control/data gram and the debugger. We must avoid this bottleneck and achieve a scalable implementation. We intend to solve these two bottlenecks. Figure 1: Debugging system A runtime debugger is the one of the frequently used debugging tools, which controls the program execution and through which the states of debugged programs are inspected. Like Dbx or Gdb on Unix, this type of tool is generally equipped on programming development environment. We designed a runtime debugger for massively parallel programming, and did a prototype implementation.
A parallel program contains many threads and their states. While inspecting such a program, the user should be able to control all the threads through the debugger. In this system, two bottlenecks possibly occurs. One is between processors and the debugger, and another is between the debugger and the user.
3 Our solutions We are investigating to resolve the two classes of problems described in the previous section. Primarily, we target our debugger at programs written in the programming language MPC++[1] running on the massively parallel computer RWC-1[2].
3.1
Between the debugger and the user
MPC++ has two types of parallel abstractions, i.e, control parallelism and data parallelism. We planned to utilize these abstractions as debugging abstractions, too. 3.1.1
Debugged Program
Control parallelism
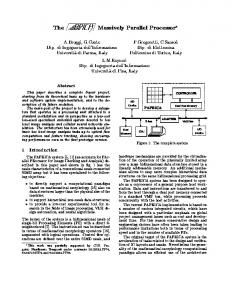
MPC++ has two types of function call, which are a blocking call and a non-blocking call. When a thread calls a function as “blocking call”, the caller thread is blocked until the execution of the callee function terminates (like ordinary sequential function call e.g. in C and C++). One the other hand, a thread calls a function as “non blocking call”, the caller is NOT blocked, and the caller and the callee functions run in parallel. In the MPC++ implementation on RWC1, many fine-grain hardware level threads are created (see Figure 2), and it will be inconvenient for users. On the debugger level, these hardware level threads are grouped reflecting these calling facility to debugging function. The hardware level threads which construct a function execution are grouped to one thread, and it is thought that a new thread is created to execute a called function if the calling is non-blocking, and a thread is continued to execute a called function if the calling is blocking. Currently, the design for control parallelism support was finished, and now being implemented. 3.1.2
(Centralized) Debugger
Data parallelism
MPC++ will have data parallel feature, too. When this type of parallelism is supported, this style of parallelism must be supported on our debugger in the way of that the all the threads which execute the loop fragment is seen as one thread from user. Creation of threads
foo() { .... bar0(); .... bar1()@[Proc]; ... } call/return
bar0() { .... .... } bar1() { .... .... }
foo() { .... bar0()@(); .... bar1()@()[Proc]; ... }
bar0() { .... .... } bar1() { .... .... }
branch
Figure 3: branches of debugger 3.2 Between the processors and the debugger To avoid the bottleneck between the debugger and the processors, we planned that the debugger for a massively parallel program must be implemented as a “distributed manner”. A “debugger branch” (local debugger) is associated with each processor and this branch controls and maintains the threads on that processor locally until the branch determines that the control must be returned to “centralized debugger” (see Figure 3). The previous “condition break” example must be implemented as 1) a branch catches that some thread reaches to the break point 2) the branch checks the condition associated with the break point becomes true or not, and 3) the branch requires centralized debugger to break the program if the condition is true. Currently, the implementation method of the “branch mechanism” is being investigated.
4 Prototyped implementation The primary version of RGdb program, which is extended of Gdb in a manner of the previous descriptions, is on the status of test-released. This program is used accompanied with RWC-1 simulator which was developed in TRC and can debug MPC++ in source level. 1
References
fork/join threads on hardware level thread on debuger level
Figure 2: supporting for control parallelism We intend to support more higher abstraction for grouping the threads and datum, which represent the program state. And the number of the control windows basically must be fixed independently from the number of threads (and the control window may be split explicitly by user’s operation).
[1] Yutaka Ishikawa. MPC++ Programming Language V1.0 Specification with Commentary Document Version 0.1. available from WWW server on trc.rwcp.or.jp, 1994. [2] Shuichi Sakai. Massively Parallel Execution Model and Massively Parallel Architecture. In RWC Technical Report(TR-94001), pp. 175– 176. RWCP, 1994.
1 Current version has not support some MPC++ facilities (especially multi thread facility) yet.


![FREE [DOWNLOAD] PROGRAMMING MASSIVELY PARALLEL ...](https://m.moam.info/img/260x300/free-download-programming-massively-parallel-_64789e54097c4744708d088f.jpg)
