KOTZ LAYOUT
10/2/08
2:28 PM
Page 10
DEPENDABILITY IN THE UBIQUITOUS WIRELESS ACCESS
MAP: A SCALABLE MONITORING SYSTEM FOR DEPENDABLE 802.11 WIRELESS NETWORKS YONG SHENG, GOOGLE GUANLING CHEN AND HONGDA YIN, DEPARTMENT OF COMPUTER SCIENCE, UNIVERSITY OF MASSACHUSETTS LOWELL KEREN TAN, UDAYAN DESHPANDE, BENNET VANCE, DAVID KOTZ, AND ANDREW CAMPBELL, INSTITUTE FOR SECURITY TECHNOLOGY STUDIES, DARTMOUTH COLLEGE CHRIS MCDONALD, SCHOOL OF COMPUTER SCIENCE, THE UNIVERSITY OF WESTERN AUSTRALIA TRISTAN HENDERSON, SCHOOL OF COMPUTER SCIENCE, UNIVERSITY OF ST ANDREWS JOSHUA WRIGHT, ARUBA NETWORKS
AM Scan, filter, extract AMEX frames Merger AMEX frames
The authors introduce the MAP project, which includes a scalable 802.11 measurement system that can provide continuous monitoring of wireless traffic to quickly identify threats and attacks.
10
ABSTRACT Many enterprises deploy 802.11 wireless networks for mission-critical operations; these networks must be protected for dependable access. This article introduces the MAP project, which includes a scalable 802.11 measurement system that can provide continuous monitoring of wireless traffic to quickly identify threats and attacks. We discuss the MAP system architecture, design decisions, and evaluation results from a real testbed.
INTRODUCTION As individuals and enterprises increasingly depend on 802.11 wireless LANs for missioncritical applications, in particular time-sensitive applications such as voice and video, the need to detect malicious attacks and protect legitimate users becomes even more important. (See the sidebar.) Detecting 802.11 attacks, however, requires measurement at the medium access control (MAC) layer, which in turn requires radios that can hear the management and control frames that govern the MAC protocol. Deploying measurement software within 802.11 access points (APs) is difficult because most such devices are closed “black boxes,” are typically locked to a specific channel (whereas attacks may be found on other channels), and have processors that are too limited to capture or analyze all traffic while simultaneously performing their primary function. Moreover, APs may not hear attackers located near the edge of their coverage area, even though those attacks may affect clients within range of the AP. Although some vendors’ APs do periodically switch channels to listen for attacks on those channels, the small amount of time spent on
1536-1284/08/$25.00 © 2008 IEEE
alternate channels limits their ability to catch all but the most aggressive attackers. Deploying dedicated wireless measurement devices, which we call sniffers or air monitors (AMs), allows network administrators to listen for attacks in a broader variety of locations and on more channels than possible with AP-based approaches. It is feasible to cover a large enterprise with dedicated AMs, which could be inexpensive $200 embedded devices or even $30 USB dongles attached to existing office PCs, as proposed by DAIR [9]. It remains, however, a significant challenge to build a scalable system for monitoring a wireless network using distributed sniffers. There are two important issues to be considered: • The unlicensed bands used for 802.11 networks have multiple channels, and a singleradio AM can only listen to one channel at any time; it may miss an attack on other channels. One could attach multiple radios to one device, or place multiple single-radio devices at one location. Either way, the hardware required is bulky or prohibitively expensive. • For many 802.11 MAC-layer attacks it is important to capture a complete, coherent stream of frames to detect the attack. An AM, however, can only capture frames within its sniffing range, and may miss some transmitted frames when the network is congested. A system that cannot capture most or all attack frames may be less able to detect certain classes of attacks. In this article we describe the Measure, Analyze, Protect (MAP) system for monitoring and analyzing wireless traffic on or near a campusscale wireless network. The MAP architecture includes a distributed set of dedicated sniffers (AMs); to address the challenge of multichannel monitoring, MAP AMs periodically change the channel on which the radio captures traffic. We
IEEE Wireless Communications • October 2008
KOTZ LAYOUT
10/2/08
2:28 PM
Page 11
call this technique channel sampling, as it results in the collection of only a sample of the frames passing through all the channels. This sampling approach may be sufficient, for example, for a system administrator or anomaly detection module to observe some unusual behavior in the network. Once an anomaly is detected, however, the administrator may require a more extensive traffic sample, or need to identify the location of an offending device. Therefore, MAP allows measurement applications to dynamically modify the sampling strategy, refocusing the monitoring system to pay more attention to some channels or certain types of traffic than others. To address the aforementioned challenge of incomplete capture, AMs forward the captured frames to a merger, which reconstructs a stream of frames in chronological order. Because neighboring AMs may hear the same transmitted frames, the merger also removes duplicated frames. On the other hand, a frame missed by one AM may be captured by another AM, so the merged frame stream often provides a more complete view and is more suitable for accurate traffic analysis and attack detection. Multiple MAP analysis detectors subscribe to this merged stream to identify possible threats, attacks, and performance anomalies. Detectors then send alerts to a protection engine, which is capable of blacklisting offending stations by reconfiguring the wireless network firewall and displaying the analysis results to network administrators via a Web interface. Merging sniffed frames from distributed AMs, however, raises scalability concerns on bandwidth usage and processing power. To reduce bandwidth demand, MAP AMs extract only a small number of features from the frame headers, rather than the full frames. Since MAP uses a lightweight merging algorithm and the analysis detectors can run on separate machines using a publish-subscribe model, MAP’s computational workload can easily be distributed and balanced to increase scalability. Finally, we expect multiple MAP systems to be deployed for a large campus, probably with one to cover each region. We have built a testbed with 20 AMs deployed in a single building, and the evaluation results show that MAP can easily handle the workload with decent detection accuracy. The primary contribution of this article is the novel MAP architecture, and its scalable support for live monitoring and analysis of large wireless networks. We include a performance evaluation of MAP in a live testbed. We discuss the details of individual MAP components, such as channel sampling strategies and attack detection algorithms, in previous papers [6, 10–12].
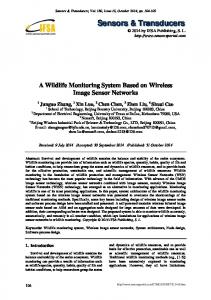
MAP ARCHITECTURE The architecture of the MAP system is shown in Fig. 1. Briefly, the AMs capture wireless frames, extracting and forwarding the desired frame features to the merger, which creates a unified stream on a coherent timeline. The analysis engine includes plug-in detectors that analyze the traffic, producing alerts to the protection system and feedback to the measurement system.
IEEE Wireless Communications • October 2008
Measurement
AM
AM
Scan, filter, extract
Scan, filter, extract
Controller
AMEX frames
AMEX frames Merger AMEX frames
Refocusing Refocus requests
Analysis engine NAV detector
Spoofing detector
Deauth/ disassoc detector
Rogue detector
Alerts Alert server
Protection engine Alert display
Firewall rules
n Figure 1. The MAP architecture; dashed lines are control streams, and bold lines represent data.
The controller coordinates the AMs and modifies their behavior according to the feedback from the analysis engine. The protection engine presents alerts to the system administrator and (in future work) takes autonomous action to protect the network from the attacker.
AIR MONITORS (AND CONTROLLER) AMs are wireless sniffers that capture traffic from the 802.11 spectrum. In our deployment we use dual-radio Aruba AP70 APs loaded with OpenWrt Linux,1 although an AM could be built from any 802.11 network interface controller (NIC) that is capable of programmatic channel changes. (In our evaluation we use only one of the AP70’s two radios.). AM Feature Extraction — To reduce the volume of forwarded traffic while retaining the relevant information from each individual frame, AMs forward information in a frame format we call AMEX (for AM extractor). This format, a domain-specific form of lossy compression, includes only the features of interest from the MAC header of each frame and packs the features for several frames into each UDP datagram sent from the AM to the merger. We drop the frame contents, including higher-layer headers. Each AMEX frame also includes the timestamp and signal strength of the received 802.11 frame, and PHY-layer information provided by the 802.11 driver (e.g., the rate). When multiple AMs hear the same 802.11 frame and forward it
1
http://www.arubanetworks.com, http://www.openwrt.org
11
KOTZ LAYOUT
10/2/08
2:28 PM
Our merger combines all AM traces to provide a coherent and complete view of the wireless traffic. There are two challenges in merging: synchronization of the AMs’ clocks and identification and removal of redundantly-captured frames.
2
Due to the characteristics of our sniffer hardware, it is far more efficient to step through channels sequentially; switching from a highnumbered channel to a low-numbered channel can take 10 times as long. Thus, we do not consider strategies with random or other nonsequential channel orders.
12
Page 12
to the merger, the merger combines information from redundant frames into a single AMEX frame that contains just one copy of the extracted 802.11 features, together with the AM-specific data from all AMs. This AMEX approach dramatically reduces bandwidth demands for communicating frames from the AMs to the merger. Under normal load in our building, one day, AMEX reduced AM-merger traffic by 45.7 percent, even when we packed only one AMEX frame per UDP datagram, and 66.2 percent when we packed multiple frames per datagram. AM Channel Sampling — MAP needs to monitor all 802.11 channels (as many as 14 channels for 802.11b/g, and 23 channels for 802.11a), as there may be attacks on any of them, even if the network infrastructure uses only a few channels. Our AMs monitor multiple channels by periodically assigning the radio to each channel. We call this technique channel sampling, as it collects only a sample of the frames passing through all the channels. The simplest form of channel sampling, equaltime sampling, involves setting the radio to each channel in the wireless network, in a predetermined order, and spending equal amounts of time on each. For many applications, however, the equal-time approach may not match the application’s needs. In particular, we note that most applications are not interested in an equal sample from each channel, or even a statistically representative sample across channels. Application semantics imply that some channels are more “interesting” than others: for example, channels with more clients, more traffic, or active VoIP flows. In this article we consider two other sampling strategies, which adaptively spend more time on channels with higher traffic load. We assume that each strategy rotates through all channels, and define a sampling strategy in terms of the amount of time spent on each channel in each cycle, and how that time is adjusted in response to current conditions.2 The proportional sampling strategy observes the number of frames per second on each channel, and uses the proportion of traffic on each channel to determine the proportion of the next scanning cycle to spend on each channel [10]. We also consider coordinated sampling, in which the AMs’ individual sampling schedules are coordinated by a central controller. Each AM chooses the amount of time to sample each channel, as before, in proportion to the amount of traffic on each channel. However, based on statistics provided by the AMs, the central controller rotates the AMs’ schedule of channels within each cycle to reduce the amount of time neighboring AMs spend on the same channel, thus reducing the amount of redundant capture. Here, the semantics of applications like intrusion detection bias the capture toward the busier channels and away from redundant capture, in an effort to capture as many unique frames as possible. We provide the details of our coordination mechanism in a recent paper [11]; our scheduler is fast and has low overhead, and its performance depends only on the
number of channels and AMs (not on the load of the AMs). As an aside, we note that the coordinated sampling problem for AMs bears some resemblance to the channel assignment problem for APs, but there is a key difference. In channel assignment the goal is to assign each AP to one of a small number of channels (usually three or four nonoverlapping channels), for a relatively long period of time (hours or days). In channel sampling each AM is assigned to every channel, in order, for a short period of time (milliseconds). Thus, the solution space is different. Refocusing — The MAP measurement system is like a telescope, focused on a region of channelspace-time. MAP allows analysis components to dynamically refocus the measurement system after observing anomalous behavior, by gathering more frames from a client, AP, or region, or by extending the set of features collected about the traffic of interest. In case of an ongoing attack, the higher-fidelity stream of frames may allow MAP to confirm the attack or locate the attacker. Our current implementation can focus more attention on a given MAC address, by asking the relevant AMs to spend more time on the channel where that MAC was recently observed. For example, if we wish to spend more time capturing frames being sent from MAC address aa:bb: cc:dd:ee:ff to MAC address 11:bb:33:dd:55:ff, we need to direct the AMs to spend more time capturing traffic on the channels that observe these MAC addresses in combination. The MAP system allows such refocusing requests to take the form of predicates like “src == aa:bb:cc:dd:ee:ff && dst == 11:bb:33:dd:55:ff”. These predicates are sent to the relevant AMs, which maintain per-channel counters for the number of frames that match these predicates. These counters are used to determine the proportion of time an AM spends on each channel. We explore the potential for refocusing in another paper [13].
MERGING Our merger combines all AM traces to provide a coherent and complete view of the wireless traffic. There are two challenges in merging: synchronization of the AMs’ clocks and identification and removal of redundantly captured frames. Synchronization and Clock Correction — We found that the standard Network Time Protocol (NTP) could not provide the microsecond-scale synchronization required by the merger, so the merger tracks a clock correction variable for each AM, adding it to the timestamp of each frame from that AM. The merger adjusts these corrections whenever it processes a beacon frame observed by multiple AMs. The adjustments are calibrated so that the corrected timestamps for the beacon will be the same on all AMs. As frames from different AMs do not necessarily arrive at the merger in corrected timestamp order, the merger must buffer incoming frames for a period of time so that it can reorder them and identify duplicates. We recognize
IEEE Wireless Communications • October 2008
KOTZ LAYOUT
10/2/08
2:28 PM
Page 13
frames as duplicates if they have a similar timestamp and the same frame check sequence (FCS).
ANALYSIS ENGINE The MAP analysis engine is an open platform that can support multiple detectors, as shown in Fig. 1. Currently we have developed a network allocation vector (NAV) attack detector, a spoofing attack detector [12], a rogue-AP detector [6], a cheating attack detector, and a flood detector (e.g., the deauth/disassoc attack mentioned below). Since new attacks will emerge in the future, we developed MAP’s analysis engine to allow easy integration of new detectors, coded in any language and for any execution environment suitable for the task. MAP can run multiple detectors simultaneously, on the same host or distributed to any available host, balancing the analysis load and enhancing scalability. To add a new detector, the developer simply informs the detector of the network address of the merger (so the detector may subscribe to the merger’s output stream), the alert server (so the detector may publish any alerts), and the controller (so the detector may send refocusing requests). Indeed, our framework allows one detector, which may be an anomaly detector, to launch a new instance of another detector, which may be a specific signature detector, and to refocus the measurement system so that the new detector can better examine the suspicious traffic. Note that neither MAP nor its measurement system defines “suspicious;” it is up to the detectors to define which frames are of interest, based on application semantics. Detectors are not simply clients of the measurement system, but active components that can adjust measurement activity according to the results of analysis. We use the deauth/disassoc detector here as an example to show how refocusing helps attack detection. Deauthentication (deauth) and disassociation (disassoc) frames are two types of 802.11 management frames that can terminate 802.11 authentication and association procedures, respectively. By continuously sending spoofed deauth/disassoc frames whose source MAC address is the AP and destination MAC address is the target, the attacker keeps the target trapped in the authentication/association procedures and thus disrupts wireless connectivity between the target and the AP. Such an attack can be a “flood” (> 10 frames/s [FPS]) or a “trickle” (otherwise). The refocusing capability of the deauth/disassoc detector works as follows. Our detector considers any deauth or disassoc frame suspicious. The detector monitors the frame type of each frame output by the merger. Once it finds an early sign of an attack (a single deauth or disassoc frame), the detector sends a refocusing request to the controller. The controller implements the request by instructing the AMs to spend more time on the channel where the attack occurred. The controller assigns a ticket to this request and sends it back to the detector, which saves the ticket for future communications with the controller. The detector also
IEEE Wireless Communications • October 2008
Floor 3
C *
* *
Floor 2
*
*
*
Floor 1
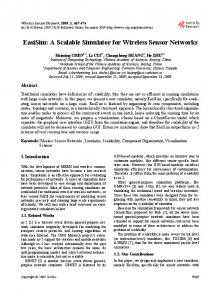
n Figure 2. Testbed deployment in our CS department building. 19 Aruba AP52 APs (not shown) provide 802.11a/b/g service to over 80 faculty, students, and staff members in about 1600 m2 of usable space. We deployed 20 Aruba AP70 air monitors (arrows) throughout. For some experiments, we deployed sniffers at the "*" locations. builds a profile, which includes source and destination MAC address, a counter, timestamps for each suspicious frame, the refocusing ticket, and two timers, t r and t e , where t r records the time when the refocusing request is over and te records the expiration time for monitoring the situation. Whenever the refocusing timer t r expires and t e has not expired, the detector sends a renewal request to the controller. When a deauth or disassoc frame arrives with the same addresses, te is extended and the counter is incremented. If this counter exceeds a predefined threshold, the detector generates an alert message (containing the attack start time) to the alert server. If no more suspicious frames have been heard when t e expires, the detector sends an alert message (containing the attack start time, end time, and other statistics) to the alert server. The detector flags this attack as genuine if the number of suspicious frames was more than a predefined threshold; otherwise, it flags this attack as a false alarm. In either case, the detector sends a cancellation request to the controller.
MAP TESTBED AND EVALUATION We deployed a 20-AM MAP system to monitor the production 802.11a/b/g network in our department, as shown in Fig. 2. This live testbed allows us to evaluate the effectiveness of MAP
13
KOTZ LAYOUT
10/2/08
2:28 PM
Page 14
Coordinated Proportional
40%
Million FAMH
20% 0.5
10% Coordinated Proportional Merged unique frames
0.1 0.05
Percentage of redundancy
30%
0.01 0.005 0.001
11
4
1
2 3 10 5 6 IEEE 802.11 b/g channels
9
8
7
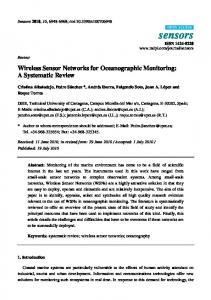
n Figure 3. Comparison of channel sampling strategies on frame capturing over different channels.
architecture, system scalability, and detection accuracy in realistic settings. We used Aruba AP70s as AMs, which have a 266 MHz MIPS CPU, 32 Mbytes DRAM, two Atheros AR5212 802.11a/b/g NICs, and two Ethernet NICs. We installed OpenWrt Linux (Kamikaze branch, r5494) and MadWifi (v0.9.2) on each, and a copy of dingo, 3 our channel sampling software that sniffs through libpcap (v0.9.5). Dingo can sniff on both of the NICs, but in our experiments it sniffed only one radio and only 802.11b/g, as our 802.11a network is in limited use. We connected all the AMs to the merger through switched 100 Mb/s Ethernet, without routers in the middle. Our merger, controller, and analysis engine are running as user-level processes on one of two Linux (Fedora Core 6) servers (2 × 3 GHz Intel Xeon CPUs, 4 Gbytes RAM, 3.2 Tbytes RAID storage). Note that the merger and any post-merger MAP components can run on either the same server or different ones. We configured them to run on the same server in most of our experiments.
3
A dingo is an Australian native dog renowned for its ability to track prey in bleak conditions.
14
Channel Sampling — Before we look at attack detection, we set out to measure the long-term performance of channel sampling. We deployed 18 AMs at six locations (marked “*” in Fig. 2), three at each location, 0.5m apart. We divided AMs into three groups, each group having one representative at each of the six locations. We configured each group with different sampling strategies: 1 Proportional, so each AM uses the proportional sampling strategy independently 2 Coordinated, like group 1 but under the coordination of a controller to reduce channel overlap 3 Refocusing, like group 2 but allowing the detector to send refocus requests to the AMs through the controller We monitored the production network for 24 hours. We launched no attacks, so we focus on results from the proportional and coordi-
nated strategies. We plot the AMs’ output and the merger’s output on each channel on a log scale in Fig. 3. The unit is FAMH, frames per AM per hour. On the horizontal axis the channels are arranged in descending order of FAMH captured by the coordinated group on each channel. For each channel, the two bars represent the two sampling strategies. The dark portion of the bars represent the FAMH after merging the traces. We also plot the redundancy rate of the two groups as lines across the top. From this plot we can see that the coordinated group captured more frames on the busier channels, but was less effective at capturing frames on the quieter channels. It did, as designed, capture fewer redundant frames on most channels; coordinating the schedules of neighboring AMs therefore allowed MAP to use its resources (radio time) more efficiently. The coordinated group captured slightly more redundant frames on the busiest channel (channel 11), however. We speculate that the reason for this difference, as well as coordinated sampling’s tendency to capture more frames on busy channels and fewer frames on quieter channels relative to proportional sampling, is due to the responsiveness of their rescheduling operations. In these experiments the coordinated sampling algorithm adjusted the channel sampling schedule once every 2.2 s, and the proportional sampling algorithm adjusted once every 5.5 s; the coordinated group thus reacted more quickly to shifts in the traffic patterns and tended to spend more time on the busy channels. We describe our coordination algorithm in more depth, and explore its value in small controlled studies, in an earlier paper [11].
EFFECTIVENESS OF ATTACK DETECTION We first evaluate MAP’s attack detection effectiveness. We use two success metrics: • The ability to capture attack frames, measured by the ratio of attack frames captured by MAP to the total attack frames injected • The detection rate, measured as the fraction of successfully detected attacks to all launched attacks Although we evaluate MAP with only one attack scenario, this situation is representative of many other kinds of attacks that depend on threshold-based detectors. Our results should be meaningful for any situation where the capture of more frames leads to the capture of more attack frames and thus a higher likelihood of detecting the attack. For these experiments, we set up an additional control AM (marked C in Fig. 2) 2 m from the attacker, fixed on the attacker’s channel without any channel sampling or refocusing. For each group, as well as the control AM, we ran separate instances of the merger, controller, and detectors simultaneously. We set up the deauth/disassoc detector to report an alert when it captured 3 deauth frames that are less than 6 s apart from a MAC address. For the refocusing group, we configured the detector to request refocusing on the MAC address the moment it received the first deauth frame.
IEEE Wireless Communications • October 2008
10/2/08
2:28 PM
Page 15
We set up an attacker (laptop) to launch deauth attacks, once per minute, against a predefined MAC address. We assume that the attacker knows MAP is in use and understands the proportional sampling strategy, and thus may attempt to evade MAP detection by deliberately injecting heavy traffic to one channel and attacking another idle channel. We carried out two sets of experiments: in one set the attack was on the busiest channel (channel 11 in our case), and in another set the attack was on a quiet channel (channel 7, which had no production APs and thus almost no traffic). We assume that the attack frames may arrive in a flood (high frame rate) or a trickle (low frame rate). Thus, we varied the injection rate of deauth frames at six different levels: 0.5, 1, 2, 5, 10 and 50 FPS. At each given frame rate, we repeated the experiment 120 times, for 40 s each time. The two sets of experiments lasted for 24 hours.
100% 90% 80% Percentage of frames captured
KOTZ LAYOUT
70% Refocusing - Ch 11 Refocusing - Ch 7 Coordinated - Ch 11 Coordinated - Ch 7 Proportional - Ch 11 Proportional - Ch 7 Single AM - Ch 11
60% 50% 40% 30% 20% 10% 0 0.5
1
2
5
10
Injection rate of attack frames (FPS)
Capturing Attack Frames — Figure 4 shows the percentage of captured attack frames under different frame injection rates. The lower and upper error bars are the first quartile (which cuts off the lowest 25 percent of data) and third quartile (which cuts off the highest 25 percent of data), respectively. Although there was substantial variance in some cases, the broad conclusions are clear. The attack occurred on channel 7 or channel 11. The reason we chose these two channels is that channel 7 was the quietest channel, and channel 11 was the busiest channel in our environment. We wanted to compare how different sampling and refocusing strategies affect the attack detection performance under different traffic environments. We only used the control AM during the channel 11 experiment; since it was close to the attacker and stayed on the attack channel, it captured almost 100 percent of the attack frames. The most notable feature of this graph is that the coordinated and proportional groups were poor at capturing attack frames when the attack occurred on a quiet channel (channel 7), because they focus attention on the busier channels. On the other hand, the refocusing group captured the most attack frames among the three channel-sampling groups in most cases, because its focus was determined by an early indication of attack. The coordinated and proportional groups had similar capture performance.
n Figure 4. Comparison of channel sampling and refocusing strategies on attack frame; capturing performance. The dots represent the mean, and the error bars represent first and third quartile of the distribution across repeated experiments.
Rate of Detection — Since the detector does not need to capture all attack frames to raise an alert, the rate of attack detection (shown in Fig. 5) for each group was much higher than the frame capture rate. When the attacker targeted the busiest channel, all three groups detected 100 percent of attacks, even for the subtlest trickle attacks. When the attacker targeted the quiet channel 7, however, the proportional and coordinated groups were poor attack detectors unless the attacker injected 2 FPS or more. The refocusing group was consistently better than the other two groups. For the subtlest trickle attacks (0.5 FPS, channel 7), the refocusing group detected 72 percent attacks, which is 4.1 times
higher than the coordinated group (14 percent), 6.2 times than the proportional group (10 percent). The detection and refocusing techniques we have demonstrated through the deauth/disassoc detector can easily be extended to other threshold-based detectors, such as the NAV attack detector. For these detectors, the more attack frames we capture, the more effectively MAP can detect attacks. MAP successfully detected such attacks while channel sampling. The analysis-driven refocusing feature was important for accurate detection. Readers are encouraged to refer to our earlier papers for the details and evaluation of our other detectors: a rogue-AP
IEEE Wireless Communications • October 2008
100% 90%
Percentage of detection
80% 70% 60% 50% 40% Coordinated - Ch 11 Coordinated - Ch 7 Refocusing - Ch 11 Refocusing - Ch 7 Proportional - Ch 11 Proportional - Ch 7 Control AM - Ch 11
30% 20% 10% 0%
0.5
1
2 5 Injection rate of attack frames (FPS)
10
50
n Figure 5. Comparison of channel sampling and refocusing strategies on attack detection performance.
15
KOTZ LAYOUT
10/2/08
2:28 PM
Page 16
Security focus
Air monitor
Feature extraction
Channel sampling
Refocusing
Merging
Online
MAP
Yes [12, 6]
Dedicated
Yes
Flexible strategies [10, 11]
Yes [13]
Yes
Yes
DAIR [9]
Partial
Desktop plugin
Yes
No
No
No
Yes
DOMINO [8]
Yes
Dedicated
N/A
No
No
No
Yes
JIGSAW [15]
No
Dedicated
Yes
No
No
Yes
Partial
WIT [16]
No
Dedicated
No
No
No
Yes
No
WIDS (many)
Yes
Dedicated
No
Fixed strategies
No
No
Yes
n Table 1. Related wireless monitoring systems. detector [6] and a signal-strength based spoofing detector [12].
SYSTEM PERFORMANCE Attack frames must be captured before the attacks can be detected. From the above results, effective frame capture is clearly a critical metric. In this subsection we evaluate MAP’s capture capability, although due to space limitations we do not present detailed plots or data. Sniffing Performance — We conducted a heavy traffic experiment on the testbed with the 20 AMs deployed at the arrows, as in Fig. 2. We used eight wireless Linux PCs as traffic generators scattered on the three floors (not shown). On each AM we measured the frames received by NIC, libpcap, and the dingo sniffer software. Our success metric for sniffing is the frame drop rate, defined as the ratio of frames not received by the sniffer to the total frames the NIC received, in each cycle of channel sampling. The results show the drop rate was low (< 5 percent) when the interface received fewer than 1000 FPS, but it increased almost linearly to 23, 50, and 74 percent at 2000, 2600, and 3200 FPS, respectively. With higher input rates, the drop rate remained constant around 70–90 percent up to 5000 FPS. Our results also show that libpcap captured almost all frames (> 99 percent), but it dropped frames due to the limit of its internal buffer, implying that dingo’s ability to extract and forward features (on these AMs) was about 1000 FPS. This performance may be improved by increasing the buffer size in libpcap and tuning dingo. Merging Performance — We also measured the CPU load of the merger from our stress experiments, which is linear to the system’s frames per hour (FPH), that is, the average number of frames captured by all AMs in an hour. By simple linear extrapolation, we expect that the merger (while using 50 percent CPU) has a throughput of approximately 31, 32, and 45 million FPH when the rate of redundancy is about 10, 20, and 50 percent, respectively. AM-Merger Bandwidth — Bandwidth limitation is another major concern. The flow of AMEX frames from the AMs to the merger may cause
16
congestion; since this traffic is carried by UDP, there is some potential for loss. We disabled AMEX aggregation, and forced the AMs to send one UDP datagram per captured frame. Our measurements show that the drop rate remained relatively flat with no upward trend as the AMs’ output rate increased. Thus, up to the merger’s maximum observed output frame rate (28 million FPH), we were well within the capabilities of UDP over switched 100 Mb/s Ethernet. With aggregation, packing multiple AMEX frames in each UDP packet, we expect to scale even further. The average AMEX/UDP datagram size is 148 bytes, including headers, when carrying the full set of features from one captured frame. (It would be smaller for analyses that choose only a subset of frame features.) The maximum throughput of such a UDP stream is around 60 million FPH [14]. The AMEX aggregation feature, however, dramatically reduces the number of UDP datagrams by 95 percent (an average of about 21 frames/UDP datagram), while increasing the average datagram size to about 1500 bytes. At such a packet size, a UDP stream can achieve more than 90 Mb/s throughput on a 100 Mb/s switched Ethernet. This increases the theoretical bound to 560 million FPH. In our experiments (under coordinated sampling) we observed an average of 0.4 million frames/AM/h. Thus, bandwidth should not be a bottleneck of MAP, even for over 1000 AMs. While our experimental results demonstrate that MAP is efficient and effective for our building-wide deployment, a single merger clearly cannot scale to campus-wide deployments. Thus, we introduce the concept of merging regions. We assume that in any large-scale 802.11 infrastructure (e.g., the Dartmouth campus), the wireless traffic is concentrated in geographically distributed buildings or groups of buildings. We envision that a MAP system groups all of the AMs in each building into one merging region; each merging region includes one instance of the merger and analysis components.
RELATED WORK There are several existing systems that monitor WLANs (Table 1). Some of these systems focus on performance analysis instead of security
IEEE Wireless Communications • October 2008
KOTZ LAYOUT
10/2/08
2:28 PM
Page 17
monitoring, such as Jigsaw [15] and WITS [16]. Like MAP, these systems merge sniffed frames from distributed AMs for detailed analysis, but their AMs pay attention only to the channels of their APs, so they do not have mechanisms for channel sampling and refocusing, and offline analysis of captured network traffic is typically sufficient. MAP, on the other hand, needs to perform online analysis to be able to rapidly respond to security violations. To compensate for channel sampling, MAP employs refocusing to allow more fine-grained analysis on certain channels or types of traffic. Most of these systems use dedicated AMs, while DAIR proposes to use USB wireless dongles attached to existing desktops for reduced deployment cost [9]; MAP could do the same. To increase scalability, MAP AMs perform feature extraction on captured frames to reduce bandwidth usage, while still allowing frame-level merging and analysis. Existing commercial wireless intrusion detection systems (WIDSs), such as AirMagnet, AirTight, and Network Chemistry, also consider channel sampling for security monitoring but use only simple strategies such as equal time per channel.
CONCLUSION This article introduces MAP, a system designed to capture wireless traffic over a broad area, merge frames captured by AMs with overlapping coverage areas, and detect 802.11 MAClayer attacks in real time. We implemented the MAP system and deployed it throughout our building. We measured the performance of MAP as it monitored daily traffic on our production network under several different scenarios, sometimes injecting traffic or attacks to measure MAP’s performance. In earlier articles we explored the details of MAP’s channelsampling methods. In this article we describe the whole system and explore its ability to detect attacks. The MAP system makes several contributions: novel channel-sampling strategies, a flexible mechanism for “refocusing” the attention of the measurement system to address changing needs of the analysis modules, a plug-in architecture for analysis components, and a range of attack detectors. We found that coordinated sampling reduced frame-capture redundancy, refocusing was able to improve the effectiveness of our attack detectors, and performance was reasonable at the scale of a modest building. Although future experiments will be needed, we expect that MAP will scale to large buildings and then (with additional servers) to a campus.
ACKNOWLEDGMENT This research program is a part of the Institute for Security Technology Studies, supported under Award number NBCH2050002 from the U.S. Department of Homeland Security, Science and Technology Directorate. Points of view in this document are those of the authors and do not necessarily represent the official position of the U.S. Department of Homeland Security or the Science and Technology Directorate.
IEEE Wireless Communications • October 2008
REFERENCES [1] A. Bittau, M. Handley, and J. Lackey. “The Final Nail in WEP’s Coffin,” Proc. IEEE Symp. Sec. and Privacy, Oakland, CA, May 2006, pp. 386–400. [2] C. He and J. C. Mitchell. “Security Analysis and Improvements for IEEE 802.11i,” Proc. Network and Distrib. Sys. Sec. Symp., San Diego, CA, Feb. 2005. [3] J. Bellardo and S. Savage. “802.11 Denial-of-Service Attacks: Real Vulnerabilities and Practical Solutions,” Proc. 12th USENIX Sec. Symp., Washington, DC, Aug. 2003, pp. 15–28. [4] M. Bernaschi, F. Ferreri, and L. Valcamonici, “Access Points Vulnerabilities to DoS Attacks in 802.11 Networks,” Wireless Networks, vol.14, no. 2, 2008, pp. 159–69. [5] Fake AP; http://www.blackalchemy.to/project/fakeap [6] H. Yin, G. Chen, and J. Wang. “Detecting Protected Layer-3 rogue APs,” Proc. IEEE BROADNETS ’07, Raleigh, NC, Sept. 2007. [7] S. Bratus et al., “Active Behavioral Fingerprinting of Wireless Devices.” Proc First ACM Conf. Wireless Network Sec., Mar. 2008, pp. 56–61. [8] M. Raya, J. - P. Hubaux, and I. Aad. “DOMINO: Detecting MAC Layer Greedy Behavior in IEEE 802.11 Hotspots,” IEEE Trans. Mobile Computing, vol. 5, no. 12, Dec. 2006, pp. 1691–1705. [9] P. Bahl et al., “Enhancing the Security of Corporate WiFi Networks Using DAIR,” Proc. MobiSys 2006, Uppsala, Sweden, June 2006, pp. 1–14. [10] U. Deshpande, T. Henderson, and D. Kotz. “Channel Sampling Strategies for Monitoring Wireless Networks,” Proc. WiNMee 2006, Boston, MA, Apr. 2006. [11] U. Deshpande, C. McDonald, and D. Kotz. “Coordinated sampling to improve the efficiency of Wireless Network Monitoring,” Proc. 15th IEEE Int’l. Conf. Networks, Sept. 2007. [12] Y. Sheng et al., “Detecting 802.11 MAC Layer Spoofing Using Received Signal Strength,” Proc. IEEE INFOCOM, Apr. 2008, pp. 1768–76. [14] A. J. van der Vegt, “GIGACluster: Network Performance Benchmarking;” http://www.science.uva.nl/ research/air/projects/old_projects/gigabench/vdvecht/ node9.html [13] U. Deshpande, C. McDonald, and D. Kotz. “Refocusing in 802.11 Wireless Measurement,” Proc. Passive and Active Measurement Conf., LNCS, vol. 4979, SpringerVerlag, Apr. 2008, pp. 142–51. [15] Y.-C. Cheng et al., “Jigsaw: Solving the Puzzle of Enterprise 802.11 Analysis,” Proc. SIGCOMM ’06, Pisa, Italy, Sept. 2006, pp. 39–50. [16] R. Mahajan et al., “Analyzing the MAC-Level Behavior of Wireless Networks in the Wild,” Proc. SIGCOMM ’06, Pisa, Italy, Sept. 2006, pp. 75–86.
We found that coordinated sampling reduced frame-capture redundancy, that refocusing was able to improve the effectiveness of our attack detectors, and that performance was reasonable at the scale of a modest building.
BIOGRAPHIES DAVID KOTZ [SM] (
[email protected]) is a pofessor of computer science at Dartmouth College, Hanover, New Hampshire. At Dartmouth he was executive director of the Institute for Security Technology Studies from 2004 to 2007, which is dedicated to interdisciplinary research and education in cyber security and trust. After receiving his A.B. in computer science and physics from Dartmouth in 1986, he completed his Ph.D. in computer science from Duke University in 1991 and returned to Dartmouth to join the faculty. He is a Senior Member of the ACM and a member of the USENIX Association. YONG SHENG received a Ph.D degree in computer engineering from Thayer School of Engineering, Dartmouth College in 2006. He was a postdoctoral researcher at Dartmouth ISTS and Department of Computer Science before joining Google in 2007. His research interests include data mining, networks, and security. GUANLING CHEN is an assistant professor at the University of Massachusetts at Lowell. His research interests include wireless networks, sensing systems, and mobile applications. He received a Ph.D. in computer science from Dartmouth College in 2004. KEREN TAN is a Ph.D. student in the Department of Computer Science at Dartmouth College. He received his B.S. and M.S. degrees in computer science from Nanjing University of Aeronautics and Astronautics, China, in 2002 and 2005, respectively. His research interests include wireless networks, security, network measurement, machine learning, and pattern recognition.
17
KOTZ LAYOUT
10/2/08
2:28 PM
Page 18
U DAYAN D ESHPANDE received his Master’s degree from the University of Pune, India, and his Ph.D. degree in computer science from Dartmouth College. His graduate research focused on the development of original sampling techniques for monitoring of 802.11 networks, and the demonstration of their effectiveness and efficiency. He participated in the deployment of a building-wide wireless monitoring infrastructure to be used for security and management of 802.11 networks. He currently works for Microsoft Corporation. BENNET VANCE received a Bachelor’s degree in mathematics from Yale University in 1976, and graduate degrees in computer science from Stanford and the OGI School of Science & Engineering in 1981 and 1998, respectively. He has worked as a software developer and consultant, and has held positions at AT&T Bell Laboratories and the IBM Almaden Research Center. HONGDA YIN is a software engineer at The Mathworks. He received his Master’s degree from University of Massachusetts at Lowell in 2007. CHRIS MCDONALD currently holds the appointments of senior lecturer in the School of Computer Science and Software Engineering at the University of Western Australia and adjunct associate professor in the Department of Computer Science at Dartmouth College, New Hampshire. He has both research and teaching interests in the fields of computer and network security, network simulation, ad hoc
18
and mobile networking, and software design and implementation. TRISTAN HENDERSON is a lecturer in computer science at the University of St Andrews, United Kingdom. Previous to this he was a research assistant professor of computer science at Dartmouth College. His research interests include network measurement, wireless networks, security, network economics, and multiplayer networked games. He holds an M.A. in economics from the University of Cambridge, and his M.Sc. and Ph.D. in computer science from University College London. ANDREW T. CAMPBELL is an associate professor of computer science at Dartmouth College, where he leads the Sensor Networks Group and is a member of the Institute for Security Technology Studies (ISTS). Prior to joining Dartmouth in 2005, he was an associate professor of electrical engineering at Columbia University (1996–2005) and a member of the COMET Group, where he developed a number of mobile networking technologies. His current research focuses on people-centric sensing where he leads the MetroSense project. J OSHUA W RIGHT has been toiling in the fields of wireless security for more than a decade as a consultant, writer, and instructor. He serves as a wireless security expert for Aruba Networks, the author of several tools designed to demonstrate threats in wireless networks, and a senior instructor for the SANS Institute.
IEEE Wireless Communications • October 2008