JACKIE KING,a* CATE BROWNa and HOSSEIN SABETb ... *Correspondence to: Jackie King, Southern Waters Ecological Research and Consulting, University ...
RIVER RESEARCH AND APPLICATIONS
River Res. Applic. 19: 619–639 (2003) Published online in Wiley InterScience (www.interscience.wiley.com). DOI: 10.1002/rra.709
A SCENARIO-BASED HOLISTIC APPROACH TO ENVIRONMENTAL FLOW ASSESSMENTS FOR RIVERS JACKIE KING,a * CATE BROWNa and HOSSEIN SABETb a
Southern Waters Ecological Research and Consulting cc, University of Cape Town, Rondebosch 7701, South Africa b SMEC International, Private Bag A8, Maseru 100, Lesotho
ABSTRACT Sustainable use of river ecosystems requires that they be managed holistically. This paper describes an holistic methodology, DRIFT (Downstream Response to Imposed Flow Transformation), for advising on environmental flows for rivers targetted for water-management activities. DRIFT’s basic philosophy is that all major abiotic and biotic components constitute the ecosystem to be managed; and within that, the full spectrum of flows, and their temporal and spatial variability, constitute the flows to be managed. The methodology employs experienced scientists from the following biophysical disciplines: hydrology, hydraulics, fluvial geomorphology, sedimentology, chemistry, botany and zoology. Where there are subsistence users of the river, the following socio-economic disciplines are also employed: sociology, anthropology, water supply, public health, livestock health and resource economics. DRIFT is a structured process for combining data and knowledge from all the disciplines to produce flow-related scenarios for water managers to consider. It consists of four modules. In the first, or biophysical module, the river ecosystem is described and predictive capacity developed on how it would change with flow changes. In the second, or socio-economic module, links are described between riparian people who are subsistence users of river resources, the resources they use, and their health. The objective is to develop predictive capacity of how river changes would impact their lives. In the third module, scenarios are built of potential future flows and the impacts of these on the river and the riparian people. The fourth, or economic module, lists compensation and mitigation costs. DRIFT should run in parallel with two other exercises which are external to it: a macro-economic assessment of the wider implications of each scenario, and a Public Participation Process whereby people other than subsistence users can indicate the level of acceptability of each scenario. DRIFT has been developed in a semi-arid, developing region, where water-supply problems are pressing, and uncertainties about river-linked ecological and social processes high. The use of DRIFT in this context is discussed. Copyright 2003 John Wiley & Sons, Ltd. KEY WORDS:
environmental flows; holistic methodology; biophysical module; socio-economic module; subsistence use; scenario building
INTRODUCTION Increasing water demands are degrading river and other aquatic ecosystems, in countries across the world. Nowhere is the problem more urgent than in developing countries in semi-arid climates, where fast-growing populations are reliant on very limited water resources. Many of these countries acknowledge that environmental protection must be a component of their management of aquatic resources, but have limited data and understanding of their systems with which to achieve this. South Africa began to address this problem in the 1980s. First, aquatic ecosystems were recognized as competing users of water, and later, their status was further enhanced as they became seen as ‘the base of the resource’, with water needs for their own maintenance. In the continuing competition and negotiations for scarce water, the aquatic scientists were asked to speak on behalf of the ecosystems. The problems faced when embarking on this were not trivial, but appear to be common globally: few relevant data, a limited understanding of the nature and functioning of the ecosystems, limited funds, and few scientists with relevant * Correspondence to: Jackie King, Southern Waters Ecological Research and Consulting, University of Cape Town, Rondebosch 7701, South Africa.
Copyright 2003 John Wiley & Sons, Ltd.
Received 24 April 2001 Revised 26 January 2002 Accepted 14 May 2002
620
J. KING, C. BROWN AND H. SABET
skills, were just the most obvious difficulties faced. With a growing economy and about half of South Africa’s people with inadequate access to potable water, the managers could not wait until these shortcomings had been overcome. Water supply had to be addressed, and decisions on water resources would be made with, or without, scientific input. Responding to this, in a major shift in thinking and with the support of government, the nation’s water scientists moved to provide advice on water allocations for ecosystem maintenance, based on limited knowledge. This heralded a decade of new working relationships, and growing awareness on all sides of the constraints of water management and the complexities of aquatic systems. This paper describes an holistic approach to advising on environmental flows for rivers, that was a product of this new endeavour. It developed from earlier holistic methodologies, through several applications in southern Africa. The approach cannot be illustrated through comprehensive coverage of case studies, as the outcomes of the flow assessments are presently the subject of regional or international negotiations. Instead, the methodology is described, with examples of specific activities and outcomes from one flow assessment in Lesotho.
ENVIRONMENTAL FLOWS AND THEIR ASSESSMENT Environmental flows may be defined as water that is left in a river system, or released into it, for the specific purpose of managing the condition of that ecosystem. During the last five decades, about 100 different approaches have been described for advising on environmental flows, and more than 30 countries have begun to use such assessments in the management of water resources (Tharme, 1996; King et al., 1999). There are four main types of flow-assessment approaches: hydrological, hydraulic rating, habitat rating, and holistic (King et al., 1999). Those based solely on hydrological data were among the earliest. They are essentially desktop methods that use summary statistics of flow, which may or may not be ecologically relevant, to advise on suitable flows, often for fish habitat. Because of their lack of sensitivity to individual rivers, hydraulic-rating methods were developed which use field measurements to describe channel–discharge relationships. Though providing river-specific data, these failed to indicate the significance of changes in the measured physical conditions for the aquatic biota. This led to the development of habitat-rating approaches, the best known of which is the Instream Flow Incremental Methodology (IFIM) (Reiser et al., 1989a,b; Stalnaker et al., 1995). IFIM links simulations of local channel hydraulics over a range of discharges with data on the hydraulic conditions in which selected species (usually fish) are most frequently found. The output plot of Weighted Usable Area (WUA) versus discharge indicates how these hydraulic habitats increase or decrease in area with discharge fluctuations, providing a simple negotiation and management tool. IFIM marked a milestone in the development of environmental flow methodologies, and was visionary in its approach. It nevertheless attracted considerable early criticism (reviewed in King and Tharme, 1994), which triggered development of the holistic approaches. Reflecting a growing body of thought, the Building Block Methodology (BBM) in South Africa (King and Louw, 1998; King et al., 2000), and the Holistic Approach (Arthington et al., 1992; Arthington, 1998) and Expert Panel Assessment Method (Swales and Harris, 1995) in Australia, were developed in the early 1990s to advise on flows for maintenance of the whole ecosystem. Whether used to inform on how much water should be released into a river, or the limit of abstraction from it, or the restoration of flows, they are based on the same philosophy. This is, that to manage the condition of a river: • all major abiotic and biotic components constitute the ecosystem to be managed; • the full spectrum of flows, and their temporal and spatial variability, constitute the flows to be managed. The holistic approaches are essentially processes that allow aquatic scientists from many disciplines to integrate data and knowledge. Each specialist uses methods of her/his choice to develop an understanding of flow–ecosystem relationships, and then works with the other team members, within the overarching process of the holistic approach, to reach consensus on environmental flows. The output is a description of a flow Copyright 2003 John Wiley & Sons, Ltd.
River Res. Applic. 19: 619–639 (2003)
621
RESPONSES TO FLOW TRANSFORMATION
regime, in terms of frequencies, timing and duration of different magnitude flows, needed to achieve and maintain a specified river condition. The BBM triggered a major change in the way specialists collected and analysed data in South Africa, but had two major weaknesses. First, it was essentially prescriptive. A river condition is specified, and then the recommended flow regime to achieve it described. The outputs do not lend themselves to negotiation, because effort is mostly directed to justifying a single flow regime, and information on the implications of not meeting it is not easily accessed. Second, it did not adequately address the impacts of changing rivers on subsistence users. These social impacts are part of the costs of water-resource developments in many developing countries, but are still rarely described (King et al., 1999). DRIFT (Downstream Response to Imposed Flow Transformation) is a new holistic methodology that incorporates features from the earlier ones and addresses these two problems, through the production of biophysical and socio-economic scenarios. Here, the overarching process is described. Details of the activities undertaken by each specialist are given in the Manual for the BBM (King et al., 2000), which requires the same kinds of data inputs as DRIFT.
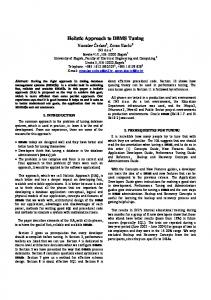
DRIFT WITHIN THE CATCHMENT-PLANNING AND MANAGEMENT ARENA DRIFT was developed in actual water-resource development projects, on the Palmiet River (Brown et al., 2000) and Breede River in South Africa, and in the Lesotho Highlands Water Project in Lesotho (Metsi Consultants, 2000a). It was further developed in 2001 in a technology-transfer exercise on the Odzi and Pungwe rivers in Zimbabwe (H. Steward, Mott Macdonald, UK, pers. comm.). It is designed to describe selected potential flow regimes, each linked to the predicted: • biophysical consequences in terms of condition of the river ecosystem; • socio-economic consequences for subsistence users of the river, resulting from the changing river condition; • water yield of the scheme. Each such array of information is here called a scenario. Two allied activities should occur in parallel to the DRIFT application but outside it (Figure 1). First, an assessment of the wider consequences of each flow scenario should be done to illustrate related macroeconomics, such as the loss or gain of irrigated agricultural land, the potential for industrial and urban development and the cost of water to offstream users. Second, a Public Participation Process (PPP) should run parallel to DRIFT throughout its application. Initially, the PPP provides input to DRIFT on river concerns that need to be described in each scenario, such as a recreational fishery, a conservation area, a riverside business or a flood hazard. Following this, a continuing process of information exchange and education should allow interested parties to understand the scenarios developed in DRIFT and to indicate the degree of acceptability of each. All three activities thus produce independent but related information for the decision maker. Only the DRIFT component is addressed here, which focuses on the river ecosystem and subsistence users of its resources. If there are no subsistence users, DRIFT can be applied without the socio-economic module. Other users of the river should be represented through the macro-economic or PPP components.
OVERVIEW OF DRIFT Like other holistic approaches, DRIFT is essentially a data-management tool, allowing data and knowledge to be used to their best advantage in a structured process. Its central rationale is that different parts of the flow regime elicit different responses from the river ecosystem (Table I). Thus, removal of one part of the flow regime will affect the ecosystem differently than removal of another part. Furthermore, it is assumed that: • it is possible to identify and isolate these different parts of the flow regime within a long-term hydrological data set of daily flows; Copyright 2003 John Wiley & Sons, Ltd.
River Res. Applic. 19: 619–639 (2003)
622
J. KING, C. BROWN AND H. SABET Public Participation Process
River concerns
DRIFT Produces the range of scenarios required by the water manager.
flow regime river condition social impacts on subsistence users
Information exchange
resource economics implications for water yield
Information Macro-economics of each scenario
exchange
Public acceptability of each scenario
DECISION-MAKER
Figure 1. The interdependence of DRIFT, a Public Participation Process, and a macro-economic assessment, in a proposed water-resource development
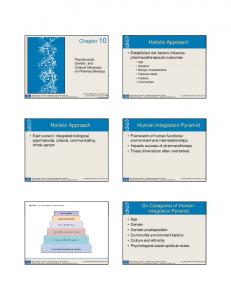
• it is possible to describe in isolation the probable biophysical consequences of partial or whole removal of any one of these parts; • the parts of the flow regime and their linked consequences can be re-combined in various ways, to describe the river condition of any flow regime of interest (the biophysical part of the scenario); • the social impacts of each river condition can be described (the socio-economic part of the scenario). Although the same process can be used in the opposite direction to add back flows as part of rehabilitation of a degraded river, in this paper we focus on flow reductions. Based on the above assumptions, DRIFT consists of four main modules (Figure 2). The first, or biophysical module, is used to describe the present nature and functioning of the ecosystem, and to develop predictive capacity of how these will change under a range of different flow manipulations. A database of predicted flow-related changes is created. The second, or sociological module, is used to identify subsistence users at risk from flow manipulations (the Population at Risk: PAR), and to quantify their links with the river. In the third module, the outputs from the first two are brought together to produce the biophysical and subsistence scenarios. The fourth module addresses the costs of mitigation and compensation.
MODULE 1–BIOPHYSICAL The biophysical specialists typically involved in a DRIFT application are hydrologist, hydraulic modeller, water chemist, fluvial geomorphologist and/or sedimentologist, botanist (riparian and instream), ichthyologist, Copyright 2003 John Wiley & Sons, Ltd.
River Res. Applic. 19: 619–639 (2003)
623
RESPONSES TO FLOW TRANSFORMATION
Table I. Different kinds of river flow, and their importance to ecosystem functioning Flow Low flows
Small floods
Large floods
Flow variability
Importance to ecosystem These are the daily flows that occur outside of high-flow peaks. They define the basic hydrological nature of the river: its dry and wet seasons, and degree of perenniality. The different magnitudes of low-flow in the dry and wet seasons create more or less wetted habitat and different hydraulic and water-quality conditions, which directly influence the balance of species at any time of the year. Small floods are ecologically important in semi-arid areas in the dry season. They stimulate spawning in fish, flush out poor-quality water, mobilize and sort gravels and cobbles thereby enhancing physical heterogeneity of the riverbed, and contribute to flow variability. They re-set a wide spectrum of conditions in the river, triggering and synchronizing activities as varied as upstream migrations of fish and germination of riparian seedlings. Large floods trigger many of the same responses as do the small ones, but additionally provide scouring flows that influence the form of the channel. They mobilize coarse sediments, and deposit silt, nutrients, eggs and seeds on floodplains. They inundate backwaters and secondary channels, and trigger bursts of growth in many species. They re-charge soil moisture levels in the banks, inundate floodplains, and scour estuaries thereby maintaining links with the sea. Fluctuating discharges constantly change conditions through each day and season, creating mosaics of areas inundated and exposed for different lengths of time. The resulting physical heterogeneity determines the local distribution of species: higher physical diversity enhances biodiversity.
invertebrate zoologist and, sometimes, specialists dealing with, inter alia, aquatic parasites, algae, herpetofauna, aquatic mammals and water birds. The hydrologist and hydraulic modeller provide information on the river that the other specialists use to develop their predictions of change. A summary of the main activities follows, which are detailed in King et al. (2000). Representative sites After the study area has been defined, a series of initial assessments are made of all included river reaches to guide the choice of representative sites. Existing or easily acquired data are used to define longitudinal zones that differ in terms of channel morphology, water chemistry and temperature, and biological zones for fish, invertebrates and riparian vegetation. Based on these results, representative sites are chosen, and the length of river that each represents delineated. Sites are sought with the highest proportion of natural features, because these provide good clues to flow–ecosystem relationships. Compromises may have to be made between specialists, as the number and location of study sites may be restricted by budgets, time constraints or access points to the river. Background hydrology An underlying philosophy of DRIFT is that most river scientists take as their starting point in understanding any river, its nature and condition at the time of their studies. Their predictions of flow-related change describe how the river will change from present, although they may use as background any information on past characteristics of it and similar rivers. Therefore, DRIFT takes as its starting point an analysis of the present flow regime of the river, and of how and when that has changed in the past. Long-term (>30 years) present-day daily flow data are first simulated for each study site. These are analysed to characterize present flows, in terms of the parts of the flow regime recognized in Table I, with every day’s average flow appearing once in the data sets (i.e. no days unallocated or allocated twice). Copyright 2003 John Wiley & Sons, Ltd.
River Res. Applic. 19: 619–639 (2003)
624
J. KING, C. BROWN AND H. SABET MODULE 1 Biophysical
MODULE 2 Sociological
Describe the nature and functioning of the river
Identify PAR Describe river use and health profiles
Develop predictive capacity of flow related changes
Develop predictive capacity of social impacts of river changes
MODULE 3 Scenario development Identify possible future scenarios and describe biophysical consequences of each
MODULE 4 Economic
Describe social consequences of each scenario
Calculate compensation and mitigation costs for PAR DRIFT output to Decision-maker
Figure 2. The four modules of DRIFT
The low flows: the daily flows between high-flow peaks are divided into data sets for different seasons, usually: • wet-season low flows; • dry-season low flows. The high flows: the peak events of higher flow are allocated to one of the following: • four size classes of intra-annual floods; • floods with a return period of up to 2, 5, 10 and 20 years. Low flows are distinguished from high flows using one of two criteria: the rate of change of the slope of the daily hydrograph, or the discharge at which selected features of the channel become inundated. The four classes of intra-annual floods are delineated by simple halving of magnitudes from the 1 : 2-year flood, as halving the magnitude of an event results, in general terms, in a significant change in the sediment-moving power of the flood (A. Rooseboom, Chair of Sedimentation Committee, ICOLD. pers. comm.). Alternatively or additionally, the discharges at which relevant channel features are inundated or exposed are used. If a different past flow regime might still be responsible for elements of the present character of the river, a similar simulation and analysis of that regime is done, and both are considered in parallel in the following steps. The result of the analysis, based on a long-term data set that covers wet and dry years, is a summary of the ranges of low flows within each chosen season, and the average number per annum of high-flow events (Table II). Flow duration curves (FDCs) derived from the low-flow data sets indicate the variability of the low flows and how often any discharge is met or exceeded (Figure 3). Copyright 2003 John Wiley & Sons, Ltd.
River Res. Applic. 19: 619–639 (2003)
625
RESPONSES TO FLOW TRANSFORMATION
Table II. Analysis of the present flow regime at a study site in Lesotho (Metsi Consultants 2000b) Flow component
Discharge (m3 s−1 )
Dry season low flows Wet season low flows Intra-annual flood size Intra-annual flood size Intra-annual flood size Intra-annual flood size 1 : 2 year flood 1 : 5 year flood 1 : 10 year flood 1 : 20 year flood
0.1–16.0 0.1–50.0 16–48 49–95 96–190 191–379 380 530 665 870
class class class class
I II III IV
Average number of events per year
6 3 3 2
Dry season: June to November. Wet season: December to May.
Discharge in m3s-1
60 50 40 WET 30
DRY
20 10 0 1
5
10
20
30
40
50
60
70
80
90
95
99
Percentage exceedence Figure 3. Flow duration curves of the wet-season and dry-season low-flow data sets from Table II
Linking the flow regime to local hydraulic conditions Conversion of the summary hydrological statistics to information on local hydraulic conditions is the vital link that allows river scientists to understand why river features and species occur where they do. Several (3–7) cross-sections across the complete macro-channel, selected jointly by the scientists and hydraulic modeller, are surveyed at each site, and stage–discharge data recorded over a range of flows. These are used to calibrate a hydraulic model, which is in turn used to derive statistics of depths, velocities and other relevant parameters for each cross-section, at any discharge within a named range. Graphics of each cross-section are marked to show the extent of each vertical zone of riparian vegetation, as well as any other features of interest, such as riffles, secondary channels, sand, or aquatic vegetation (Figure 4). The range of inundated areas in the two low-flow seasons, and the levels reached by each size class of flood, are also shown. These graphics, together with the hydraulic modelling outputs of velocities and depths, the low-flow FDCs, and data on the frequency and timing of different size classes of floods, allow the specialists to develop an understanding of the links between flow and the features or species of interest to them. For example, it could be shown from the FDCs that a vegetation zone situated just above the water line is exposed for about 70% of the dry season outside of any floods, but inundated for 90% of the wet season. Knowing this enables botanists to develop a prediction of the location and extent of this zone under a new flow regime. Copyright 2003 John Wiley & Sons, Ltd.
River Res. Applic. 19: 619–639 (2003)
626
J. KING, C. BROWN AND H. SABET 15 (a)
*
Water depth (m)
10
Range of water levels for Class IV Floods Range of water levels for Class III Floods Range of water levels for Class II Floods Range of water levels for Class I Floods
5
1:2 year flood 1:5 year flood 1:10 year flood 1:20 year flood
Range of water levels in wet-season lowflow Range of water levels in dry-season lowflow
* 0
0
100
50
150
Cross-stream distance (m)
Upper shrub or tree
(b)
Back dynamic
Lower dynamic Lower shrub
Sedge
Moss
Wetbank
Drybank
Aquatic
Figure 4. Linkage of hydrological data to river cross-sections: (a) discharge ranges for all flow components and corresponding water depths; (b) expanded detail of one bank (between asterisks in (a)), with zones of riparian vegetation and other features which can be linked to different water levels
Further aids to the development of predictive capacity are habitat maps of the sites, on which major hydraulic habitats are delineated, with data on their hydraulic characteristics over a range of flows (Figures 5 and 6). Using these, for example, the ichthyologist could link a fish species to areas of high or low velocities within a site, and be able to predict its different distribution under a different flow regime. Copyright 2003 John Wiley & Sons, Ltd.
River Res. Applic. 19: 619–639 (2003)
627
RESPONSES TO FLOW TRANSFORMATION c) Q = 1.80 m3 s-1
b) Q = 0.20 m3 s-1
a) Substrata
HH 1 cross-section A
HH 2 cross-section B
HH 3
cross-section C
20
0
20
Substrata flow direction
40
60
80 Meters
Flow bedrock
fast ripple
boulder
fast turbulent
large cobble
shallow riffle
small cobble
slow smooth
Figure 5. Habitat maps and delineation of different hydraulic habitats in a study site in Lesotho: (a) substratum map; (b and c) flow-type maps, with three distinctly different hydraulic habitats (HH) delineated (Metsi Consultants, 2000c,d). Definitions of flow types simplified from King and Schael (2001). HHs developed from an original idea by A. Arthington, J. Rall and M. Kennard (Metsi Consultants, 2000d)
Copyright 2003 John Wiley & Sons, Ltd.
River Res. Applic. 19: 619–639 (2003)
628
J. KING, C. BROWN AND H. SABET
Hydraulic Habitat 1 Pool
Hydraulic Habitat 2 Riffle
June 1998 (Q = 0.20 m 3 s-1)
n = 15
70
n = 15
70
n = 20
70 60
50
50
50
50
40
40
40
40
30
30
30
30
20
20
20
20
10
10
10
10
0
0
0
0
n = 20
0-0.01 0.01-0.09 0.01-0.19 0.20-0.29 0.30-0.39 0.40-0.49 0.50-0.59 0.60-0.69 0.70-0.79 0.80-0.89 0.90-0.99 1.0-1.49 1.5-1.99 >2
60
0-0.01 0.01-0.09 0.01-0.19 0.20-0.29 0.30-0.39 0.40-0.49 0.50-0.59 0.60-0.69 0.70-0.79 0.80-0.89 0.90-0.99 1.0-1.49 1.5-1.99 >2
60
0-0.01 0.01-0.09 0.01-0.19 0.20-0.29 0.30-0.39 0.40-0.49 0.50-0.59 0.60-0.69 0.70-0.79 0.80-0.89 0.90-0.99 1.0-1.49 1.5-1.99 >2
60
0-0.01 0.01-0.09 0.01-0.19 0.20-0.29 0.30-0.39 0.40-0.49 0.50-0.59 0.60-0.69 0.70-0.79 0.80-0.89 0.90-0.99 1.0-1.49 1.5-1.99 >2
Percent occurrence
70
January 1999 (Q = 1.80 m 3 s-1) 70
n = 15
70
n = 20
70
60
60
50
50
50
50
40
40
40
40
30
30
30
30
20
20
20
20
10
10
10
10
0
0
0
0
Velocity (m s-1)
Depth (m)
0-0.01 0.01-0.09 0.01-0.19 0.20-0.29 0.30-0.39 0.40-0.49 0.50-0.59 0.60-0.69 0.70-0.79 0.80-0.89 0.90-0.99 1.0-1.49 1.5-1.99 >2
60
0-0.01 0.01-0.09 0.01-0.19 0.20-0.29 0.30-0.39 0.40-0.49 0.50-0.59 0.60-0.69 0.70-0.79 0.80-0.89 0.90-0.99 1.0-1.49 1.5-1.99 >2
60
Velocity (m s-1)
n = 20
0-0.01 0.01-0.09 0.01-0.19 0.20-0.29 0.30-0.39 0.40-0.49 0.50-0.59 0.60-0.69 0.70-0.79 0.80-0.89 0.90-0.99 1.0-1.49 1.5-1.99 >2
n = 15
0-0.01 0.01-0.09 0.01-0.19 0.20-0.29 0.30-0.39 0.40-0.49 0.50-0.59 0.60-0.69 0.70-0.79 0.80-0.89 0.90-0.99 1.0-1.49 1.5-1.99 >2
Percent occurrence
70
Depth (m)
Figure 6. Discharge-related changes in velocity and depth for HH1 (pool) and HH2 (riffle) in Figure 5. Q = discharge
Developing predictive capacity Each biophysical specialist chooses her/his own component-specific methods to derive the kinds of flowrelated links described above. PHABSIM, for instance, could be used to establish links between WUA and discharge for selected fish species. Plant and animal ecologists could use such multivariate-analysis packages as PRIMER (Clarke and Warwick, 1994) and CANOCO (Ter Braak, 1987) to establish flow–species relationships and be able to use strong inference in their predictions of likely change. The goal for each specialist is to be in a position to predict how a specified set of flow reductions (or additions) would change their component of the ecosystem. The changes are quantified to the extent possible (see section on severity ratings). Obviously, the greater the investment in river studies to achieve predictive capacity, the higher the confidence in the predictions. Copyright 2003 John Wiley & Sons, Ltd.
River Res. Applic. 19: 619–639 (2003)
629
RESPONSES TO FLOW TRANSFORMATION
Reducing flows and describing consequences With the data-analysis phase complete, a series of flow-reduction levels are decided upon, and the specialists use their data to predict the consequences. This is best done together in a workshop environment, so that all can understand the predicted changes. Typically, for each flow reduction, the geomorphologists first describe anticipated changes to the physical environment, followed by the aquatic chemists outlining chemical and thermal changes, and then the vegetation specialists describe shifts in aquatic and riparian plant communities. At this stage, the predicted changes to the environment of the fauna have been described, allowing the fish and invertebrate (and any other faunal) specialists to record their predictions. Flow reductions consist of reducing the range of low flows and the number of flood events. Thus (Table III), at the study site in Lesotho used in Table II, the top end of the low-flow range for the dry season at the site in Table II was initially reduced from 16.0 to 9.0 m3 s−1 and, assuming that all the other flow components would remain unchanged, the consequences of this single reduction described. The top end was then further reduced through three more levels, reducing both range and variability of the remaining flow. At each step the consequences were recorded. This was repeated for the wet-season low-flow range. In both cases, reduction level 1 was to ‘Minimum Change’ level—a reduction that the specialists jointly identified as having a minimal impact on present river condition. The consequences were then recorded of up to four levels of reduction in the number of each size class of intra-annual flood (Table III). For each class of flood, the number that could be removed with Minimum Change was identified. Finally, the significance for river functioning of the four larger size classes of floods, and the consequences of their being lost, were recorded. Using generic lists to predict the consequences of flow reductions When recording the consequences, each specialist works with a generic list that can consist of any number of items, but usually four to less than 20, compiled before the flow-reduction exercise started (Table IV). For each flow reduction at each study site, the affect on every item on the lists is described. The list items may comprise habitats, communities or individual species, and are chosen based on their known susceptibility to flow changes, their role as key species or features, or their relevance to subsistence users. In Lesotho, about 130 items were included in the various lists and, with all eight study sites and reduction levels considered, more than 20 000 consequences recorded. These were entered into a custom-built database. Using severity ratings to quantify the consequences of flow change Into the foreseeable future, predictions of river change will be based on limited knowledge. Most river scientists, particularly when using sparse data, are thus reluctant to quantify predictions: it is relatively easy to predict the nature and direction of ecosystem change, but more difficult to predict its timing and intensity. To Table III. Flow reduction levels at a study site in Lesotho Flow component
Natural Q (m3 s−1 )
Dry season low flows Wet season low flows Within-year flood I Within-year flood II Within-year flood III Within-year flood IV 1 : 2 year flood 1 : 5 year flood 1 : 10 year flood 1 : 20 year flood
0.1–16.0 0.1–50.0 16–48 48–95 95–190 190–380 380 530 665 870
Copyright 2003 John Wiley & Sons, Ltd.
Number per year
6 3 3 2 Function Function Function Function
Reduction level 1 (Minimum Change)
and and and and
0.1–9.0 0.1–25.0 3 2 2 1 consequence consequence consequence consequence
Reduction level 2
of of of of
0.1–3.0 0.1–10.0 1 1 1 0 loss loss loss loss
Reduction level 3
Reduction level 4
0.1–1.0 0.1–5.0 0 0 0 –
0.1–0.5 0.1–1.0 – – – –
River Res. Applic. 19: 619–639 (2003)
630
J. KING, C. BROWN AND H. SABET
Table IV. Examples of entries in generic lists for the Lesotho study Discipline
Generic list entry
Geomorphology
Colloidal material
Water quality
Nutrient levels
Vegetation
Chenopodium album
Fish
Maluti Minnow
Invertebrates
Simulium nigritarse
Description of the links to flow and social relevance Minimum velocity for maintenance of movement of colloidal material in main channel = 0.05 m s−1 . Muddy areas are linked to loss of cobble habitat, increased algal growth, bogging of livestock, and gastric illnesses. Nutrient levels in pools increase under low flow conditions. Water in pools flushed by > Class II floods. High nutrients encourage algal growth, which is linked to increased incidence of diarrhoea in people and livestock, and loss of cobble habitat. Found mostly in the wetbank vegetation zone, the width of which is reduced by a reduction in the volume and variability of low flows and in the number of Class I floods. Abundance is affected by narrowing the zone. Important source of firewood. Also used as a medicine. Inhabits quiet, shallow waters in rocky reaches with high water quality. IUCN Red Data Book rare species. Restricted to the Highlands of Lesotho. Threatened with extinction. Filter feeder in slow, eutrophic water. Blood-sucking pest of poultry.
calculate the socio-economic implications of loss of resources to subsistence users, for use in compensation and mitigation programmes, it is nevertheless necessary to quantify these predictions as accurately as possible. DRIFT addresses this uncertainty using severity ratings. River scientists are usually willing to predict the change in abundance of each item on their generic list on a six-point scale that spans no change to critically severe change (Table V). This scale already accommodates uncertainty, as each rating encompasses a range. Greater uncertainty can be expressed through providing a range of severity ratings (i.e. a range of ranges) for any one predicted change. For the financial calculations, the severity ratings are converted to percentages of resources lost, or increased health risks, using appropriate conversion factors. The conversions have to be able to show that a critically severe loss equates to local extinction whilst a critically severe gain equates to proliferation to pest proportions. One possible route uses cut-points at 20% intervals for losses between 0% and 100% (Table V). The analogous route used for gains employs a multiplying factor exceeding one (r), such that a gain of 25%, for instance, is equivalent to r = 1.25. The inverse of r then lies between zero (which represents an increase to pest proportions when r = ∞) and one (no change). The same linear divisions on the inverse scale can then be Table V. Severity ratings for predictions of change in abundances, and conversion to percentages Severity rating 0 1 2 3 4 5
Severity of change None Negligible Low Moderate Severe Critically severe
Copyright 2003 John Wiley & Sons, Ltd.
Equivalent loss (abundance retained) no change 80–100% retained 60–79% retained 40–59% retained 20–39% retained 0–19% retained; includes local extinction
Equivalent gain no change 1–25% gain 26–67% gain 68–250% gain 251–500% gain 501% gain up to pest proportions River Res. Applic. 19: 619–639 (2003)
631
RESPONSES TO FLOW TRANSFORMATION
Table VI. One consequence entry in the database Sequence 1 2 3 4 5 6 7 8 9
Category Site Flow reduction level Specialist Generic list entry Direction of change in abundance Severity of change Conversion to percentage Ecological significance Social significance
Information 2 Reduction level 4 of dry-season low flows Invertebrates Simulium nigritarse Increase Rating 5: critically severe 500% gain or more—probable pest proportions Filter feeder in slow, eutrophic water Blood-sucking pest of poultry
used for gains and losses. For example, with a 25% increase in abundance, r = 1.25 and 1/r = 0.8, which is the outer limit of the ‘negligible’ gain category (Table V) (L. G. Underhill, Dept of Statistical Sciences, University of Cape Town). A consequence entry Each consequence described by the specialists and entered into the database links a site with a flowreduction level, a discipline, an item from the generic list for that discipline, and the predicted direction and severity of change (Table VI). To aid interpretation of impacts, the ecological and social significances of the generic-list item are also entered. With the database populated, the biophysical module is complete and ready for Module 3.
MODULE 2–SOCIOLOGICAL Specialists involved in this module (Figure 2) can include sociologists, anthropologists, medical doctors and other public health specialists, veterinarians (livestock), experts on community water supply, economists and resource economists. Again, each chooses her/his own methods, in order to understand the relationships between the river and the PAR, and to develop predictive capacity of the consequences of river changes. The main tasks are: to describe the PAR, quantify its use of river resources, and understand the links between the river and human and livestock health. Describing the population at risk The PAR is recognized as those people who live along the river and use its resources for subsistence. The first step in describing their links with the river is to delineate the width and length of the river corridor within which they live. The corridor could differ in width along its length as people make more or less use of the river. The main criteria dictating its dimensions may be the distance people are prepared to walk to use the river, ease of access to the river bank and channel, and availability of alternative resources. With the corridor delineated, all parts of it are allocated to and represented by one of the biophysical study sites. The number of people in each such part is ascertained, perhaps through government census data or aerial photographs. Quantifying resource use The PAR’s use of river resources is then quantified (Table VII, Figure 7), and their sources and use of potable water established. The present economic value of these resources is calculated. Describing river-related health risks Health professionals familiar with the area first identify all existing and potential health threats to the PAR and their livestock (Figure 7). The present occurrence of these threats is established by compiling health Copyright 2003 John Wiley & Sons, Ltd.
River Res. Applic. 19: 619–639 (2003)
632
J. KING, C. BROWN AND H. SABET
Table VII. Examples of river resources used by the PAR in the Lesotho study, and their economic values Fish are caught by 5098 households, which each catch an annual average of 17.5 kg of smallmouth yellowfish, 2.2 kg of rock catfish, and 3.0 kg of rainbow trout. The approximate market value of fish is 10 Maloti per kg. Wild vegetables are harvested by 13 911 households, which harvest on average 148 plastic bags per year with a mean market value of 2.08 Maloti per plastic bag. Casual drinking is done by 17 354 households, who drink from the river on average 16.1 times per month in summer and 8.9 times per month in winter. Crops in the riparian zone are owned by 4131 households, which each produce a mean annual harvest of 155 kg. (Metsi Consultants 2000e).
Identify PAR
To Module 1 key spp and features to ensure inclusion in biophysical studies
Quantify resource use
Cost present use
To Module 4
Identify health threats Describe the health profile of PAR and livestock
To Module 1 to ensure inclusion in biophysical studies
Identify water related illness and any links with the river through use patterns
Identify key spp and features linked to illness
Figure 7. Detail of Module 2: the Sociological Module
profiles of the people and livestock. The best sources for such data may be government public-health and veterinary programmes. Water-related illnesses listed in the health profiles are identified, and the degree to which the river presently contributes to such illness is established via two routes. First, current use patterns of the river are recorded. Close liaison between the health and sociological teams allows the necessary data on use patterns to be gleaned during the social studies. Second, through liaison with the biophysical team, the causes of the illnesses are identified and, where appropriate, incorporated in the biophysical study programme. For example, diarrhoea may presently occur in the PAR, being most common among people who drink from the river, and this may be attributed to a stomach parasite such as Giardia, which is then included in the microbiological studies. With the above data sets in place, the present relationships between the river and the PAR have been described, and an understanding developed, albeit perhaps not quantitatively, of how river changes could Copyright 2003 John Wiley & Sons, Ltd.
River Res. Applic. 19: 619–639 (2003)
633
RESPONSES TO FLOW TRANSFORMATION
impact the PAR. To ensure the best possible outputs from Module 2, strong links need to be forged between the biophysical and socio-economic teams throughout the study but particularly at the following key points: • early in the project, key river species or features, seen as valuable resources used by the Population at Risk (PAR) or as pests, are factored into the biophysical studies; • health links with the river are identified at an early stage, so that key organisms are factored into the biophysical studies; • the socio-economic team attends all meetings of the biophysical team, so that they can develop an understanding of the descriptions of river change; • the socio-economic team ensures that all items of social concern are represented in the generic lists, and explains their significance, so that the ways in which these change can be described in a relevant way for every scenario. This Module is then complete and ready for Module 3.
MODULE 3–SCENARIO DEVELOPMENT The scenarios provide a series of possible future flow regimes, together with their consequences. Within each scenario, the biophysical descriptions of river change are linked to the socio-economic impacts on the PAR and to the yield of water after the planned flow manipulation. In DRIFT, scenario development begins with identification of the range and kinds of scenarios that the decision-maker would like to consider. In theory, any number of scenarios can be compiled from the database, although experience has shown that with our present understanding of river functioning, usually four to five is the most that can be perceived as distinctly different. The biophysical component of the scenarios Initially, for each selected scenario, the future flow of each site is simulated, and analysed to show how each flow component would differ from present. For instance, under the Minimum Change scenario, future flows at the Lesotho site described in Table II, with a large dam in place, would have the following characteristics (Table VIII). • The top end of the range of dry-season low-flows is reduced from 16.0 to 9.0 m3 s−1 , and the wet-season low flows from 50.0 to 25.0 m3 s−1 . Table VIII. Flow reduction values for the Lesotho site Flow component
Natural Q (m3 s−1 )
Dry season low flows Wet season low flows Class I flood Class II flood Class III flood Class IV flood 1 : 2 year flood 1 : 5 year flood 1 : 10 year flood 1 : 20 year flood % MAR as env. flow
0.1–16.0 0.1–50.0 16–48 48–95 95–190 190–380 380 530 665 870
Number per year
6 3 3 2
Scenario 1 (Minimum Change)
Scenario 2
Scenario 3
Scenario 4
0.1–9.0 0.1–25.0 3 2 2 1 P A P P 66
0.1–1.9 0.1–1.2 3 1 2 0 A A P P 33
0.1–1.9 0.1–1.2 2 0.5 0.5 0 A A A P 18
0.5 0.5 1 0 0 0 A A A P 4
MAR = mean annual runoff; env. flow = environmental flow released downstream for river maintenance. Copyright 2003 John Wiley & Sons, Ltd.
River Res. Applic. 19: 619–639 (2003)
634
J. KING, C. BROWN AND H. SABET
• Three of the six Class I floods are lost, one of the three Class II, one of the three Class III, and one of the two Class IV floods. • All larger floods should still occur, except those with around a five-year return period. • Sixty-six per cent of the natural flow remains in the river. Scenario 4, designed to maximize water storage, provided the opposite extreme (Table VIII). • Low-flows remain at a steady year-round dam release of 0.5 m3 s−1 . • All small to medium floods are harvested by the dam, but on average one Class I flood is generated per year by the downstream catchment. • All large floods up to that with a 20-year return period are harvested by the dam. • Four per cent of the natural MAR remains in the river. Scenarios 2 and 3 provided interim conditions (Table VIII), with 33% and 18% of MAR remaining in the river. Knowing the nature of future flows, the database can be queried for the predicted consequences. For each site and each scenario, each part of the flow regime (i.e. each row in Table VIII) is matched with its closest reduction level in the database. All the relevant consequences are extracted and synthesized, and synergistic effects taken into account. This step has to be done by one or more experienced river ecologists, as sometimes decisions will have to be made on the overall impact of a number of linked but slightly different consequences. The resulting river changes can be presented at several levels of resolution, from detailed quantitative descriptions to summary statistics, or a simple summary map of the river system on which the different severities of change are colour-coded. A description, for instance, could include: ‘In reach X, there will be a critically severe (80–100%) decline in numbers of fish species A and B, and species A will probably become locally extinct. All other fish, except species C, will show a severe (60–80%) decline in numbers, whilst species C, which is a bottom feeder, will show no to a negligible (0–25%) increase in numbers’. The sociological component of the scenarios The sociological team translates the descriptions of river change into impacts facing the PAR, using the understanding developed in Module 2. The impacts fall into two categories: changes in resources and changes in health profiles. The impact of changing resources can be quantified because the biophysical scenarios describe the predicted loss or gain in abundance of species or features, and the monetary implications of this are known (Table VII). This information moves directly through to Module 4. The impact of changing health profiles and of overall change in the quality of life is more difficult to quantify. Where appropriate methods exist they should be employed, but in most cases expert opinion may have to be used. A number of considerations aid conclusions on the probable level of impact (Table IX): • • • •
different river uses are linked to different illnesses; different river changes will affect health in different ways; frequency of river use heightens the chance of water-related illnesses; even with a high frequency of river use, a known health threat can be mild and thus of low impact.
The outcome of the health assessment is a description, probably qualitative rather than quantitative, of the social implications of each scenario. This information moves through to Module 4.
MODULE 4–ECONOMIC A taxonomy of values (Figure 8) illustrates the range of values that can be attributed to an ecosystem such as a river. Moving from left to right across the graphic, the values become progressively less easy to quantify. Those to the left, being more amenable to quantification, can be included in the environmental-flow study, whilst those to the right are probably best included in the PPP (Figure 1). In the Lesotho study, only the Copyright 2003 John Wiley & Sons, Ltd.
River Res. Applic. 19: 619–639 (2003)
635
RESPONSES TO FLOW TRANSFORMATION
Table IX. Examples of health risks related to river change (Metsi Consultants 2000e) and hypothetical levels of health consequences Nature of river use
Biophysical change
Health risk
Frequency of river use
Relevance for public health
High Low
High Moderate
High
Low
High
High
High
High
Low
Low
Drinking, washing
Increase in colloidal material leads to an Increased diarrhoeal increase in the protozoan parasite Giardia disease lamblia Grazing and Increase in Simuliidae (blackflies) leads to Faecal–oral route of housing increased pestering of PAR and livestock infection near river and higher levels of disease transmission Decreased livestock production. Swimming, Increase in host snail Bulinus leads to Increase in incidence of baptizing, increased risk of encountering Bilharzia washing Schistosomiasis haematobium Fishing Decrease in fish leads to loss of important Nutritional deficiencies protein source Harvesting Decrease in wild vegetables and herbs leads Nutritional deficiencies to loss of nutritional supplements and and untreated illnesses medicines
Total Economic Value
Non-Use Value
Use Value
Direct Use Value
Output that is Consumed Directly
Indirect Use Value
Ecosystem Functional Benefits
Option Value
Future Direct & Indirect Use Values
Bequest Value
Existence Value
Value of Leaving Use & Non-use Values for Posterity
Value from Knowledge of Continued Existence
Figure 8. Taxonomy of economic values (Metsi Consultants, 2000f). The shaded items were addressed in the Lesotho study
direct resource-use values to the left were included in the flows study, to produce the costs of mitigation and compensation for each scenario. We define mitigation here as changes to project design, operation or management to reduce impacts. Compensation is relevant where mitigation does not entirely reduce the impacts. We define compensation as the provision of cash, goods or services to the PAR, to replace lost resources or impeded activities. Mitigation is inherent in the scenarios described. For instance, Scenario 1 in Table X represents a high level of mitigation, but with a low return in terms of harvested water. Scenario 4 represents a very low level of mitigation, with a high return in terms of harvested water. As yield (and income) from the scheme increases, so do the ecological and social impacts and the cost of compensation (Table X), particularly in the reaches close to the dam. Table 10 summarizes the DRIFT outputs and outlines the trade-offs that should be considered by decisionmakers, along with the macro-economic assessment and the PPP findings. During negotiations, alternative scenarios, or adaptations to the original ones, can be derived from the database as required. Copyright 2003 John Wiley & Sons, Ltd.
River Res. Applic. 19: 619–639 (2003)
636
J. KING, C. BROWN AND H. SABET
Table X. Summary of the trade-offs to be considered by the decision-maker for likely impacts of proposed dams in Lesotho on the downstream environments Scenario
Proximity to dam wall
Change in river condition
Social impact
1 High mitigation
Proximal Distant Proximal Distant Proximal Distant Proximal Distant
Low–moderate Negligible Severe Low Severe Moderate Critically severe Severe
Low Negligible Moderate Low Severe Moderate Critically severe Severe
2 3 4 Low mitigation
Compensation required Low Negligible Medium Low High Medium Very high High
Yield of water (%) 34 67 82 96
Each box has comprehensive supporting data. Dam yield is given as a percentage of natural MAR.
FURTHER DEVELOPMENT OF DRIFT There are two areas in which the quality of DRIFT applications can be enhanced: through better information on flow–ecosystem links, and through improvement of the methodology itself. Within the disciplines, better understanding of flow–ecosystem links is growing (e.g. Birkhead et al. 1997; Jewitt et al. 1998; Tharme and King, 1998; Rowntree and Wadeson, 1999; Breen et al. 2000; Jewitt and G¨orgens, 2000; King and Schael, 2001), and this is not addressed here. Within the methodology, development is focusing on DRIFTHYDRO (the hydrological software for summary statistics), DRIFT-SOLVER (the software package for building scenarios) and methods for quantifying the impacts on subsistence users. The primary area of concern remains the level of uncertainty in any scientific study of this nature. This is discussed below.
CONCLUSIONS Major factors in any water-resource development or operation are likely to be poor understanding of the river ecosystem, and uncertainty on how it will respond to disturbance. The uncertainty is probably greatest in semi-arid regions, where hydrological unpredictability is high, and in developing countries, where data may be sparse. In these, or any, situation, the choice for aquatic scientists lies somewhere along the spectrum of giving no advice until more data are available, to advising with present, limited knowledge. In South Africa, a four-part strategy is being adopted. • A comprehensive national programme of research on environmental flows (increasing the knowledge base). • Use of best available knowledge from these programmes, together with directed short-term research, to answer management questions on flow (moving ahead with limited knowledge). • Monitoring the outcomes of the management actions (learning by doing). • Adjustment of management plans, where indicated by monitoring results (strategic adaptive management). DRIFT is one tool in this strategy. It marks an advance in environmental flow assessments, through its use of scenarios, and linkage of the natural and subsistence components of river ecosystems. It provides decisionmakers with information that usually remains unconsidered in water-resource developments, on potential human and ecosystem costs. The scenarios provide a number of future options on how the river could change with flow changes, and how this would impact overall environmental condition and subsistence users. These scenarios can be used as the basis of negotiations between countries, regions or different interest groups. Additional inputs to the negotiations could be the macro-economic implications of each scenario, and the acceptability of each to the wider community of interested parties. These two additions are external to DRIFT. Copyright 2003 John Wiley & Sons, Ltd.
River Res. Applic. 19: 619–639 (2003)
RESPONSES TO FLOW TRANSFORMATION
637
The outcome of the negotiations is usually selection of one scenario as ‘the desired state’ for the river, with the flow regime described by that scenario becoming ‘the environmental flow’. The detailed descriptions held within that scenario, of predicted impacts to both ecosystem and subsistence users, provide the indicators for a monitoring programme that will measure goal attainment. Application of DRIFT and its predecessors has highlighted knowledge gaps, which have become the subject of research projects. Meanwhile DRIFT, working with present knowledge levels, addresses uncertainties in a number of ways. • Highly experienced river scientists are used, who have a good understanding of the rivers of their region. • The scientists reach consensus on the predicted ecological and subsistence outcomes of any flow manipulation. In law, consensus by an experienced group is a greater strength than the advice of a single specialist (C. Palmer, Institute for Water Research, Rhodes University, pers. comm.). • Quality control of data takes place in standard ways, and also through matching of data sets. As an example, different sized floods, with different return frequencies, should each reach up the banks to a specific zone of riparian vegetation (Figure 4) (hydrological, surveying, hydraulic and botanical data sets in agreement). • The flow assessment is structured, fully recorded and transparent, allowing understanding of the derivation of the scenarios and the levels of uncertainty. • Severity ratings allow a scenario to be illustrated as a ‘risk envelope’ that defines the range of the predicted changes. The wider the envelope, the greater the uncertainty in the prediction. • Monitoring and adaptive management strategies allow learning to continue, predictions to be validated and goal attainment re-assessed. The presentation of several scenarios allows the decision-maker to assess not only the traditional engineering and economic implications of a water development, but also the ecological and subsistence ones. Selection of one scenario is then best done through a structured, transparent decision-making process that facilitates negotiations and trade-offs. Increasingly, the aim of such decisions is to ensure sustainable use of aquatic resources. This aim may not be met if moves by scientists to advise with limited knowledge are not counterbalanced by a management agreement to support knowledge development. Without this, there is the danger that the early advice will become all that is sought and used. Learning may then be limited and wrong thinking could persist. A commitment to sustainable use requires a commitment to implement the selected flow regime, monitor the outcome in a way that will unambiguously indicate if it is achieving its goals, and have the capacity in management structures to adapt either the goals or the flow regime if the monitoring results indicate this is necessary.
ACKNOWLEDGEMENTS
The Lesotho Highlands Development Authority (LHDA) is acknowledged for funding the Lesotho flowassessment study, the South African Department of Water Affairs and Forestry (DWAF) the Palmiet study, DWAF and the South African Water Research Commission the Breede study, and the UK Department for International Development the Zimbabwe study. Senqu Consultants are thanked for their contributions during the Lesotho project. Individual thanks are also due to Erik van der Berg, who was an early supporter of the methodology; Andr´e Greyling and Gerald Howard who developed the DRIFT hydrological software; Les Underhill, who devised the conversions for the severity ratings; and Rebecca Tharme who provided comment on parts of the manuscript. The contributions of the Lesotho team to the development and application of DRIFT were invaluable and are acknowledged with thanks: internal advisor, Barry Hart (Monash University); hydrology, Hossien Sabet and Silver Yance (SMEC International), and Gerald Howard (Ninham Shand Consulting Engineers); hydraulic modelling, Vahid Alavian (Rankin International) and Drew Birkhead (University of the Witwatersrand); habitat mapping, Jackie King, Cate Brown and Justine Fowler (Southern Waters); sedimentology, Albert Rooseboom (University of Stellenbosch); geomorphology, Martin Thoms (Canberra University); water Copyright 2003 John Wiley & Sons, Ltd.
River Res. Applic. 19: 619–639 (2003)
638
J. KING, C. BROWN AND H. SABET
chemistry, Carolyn Palmer (Rhodes University) and Robert Skoroszewski (Senqu Consultants); botany, Charlie Boucher (University of Stellenbosch) and Sophia Tlale (Senqu Consultants); ichthology, Angela Arthington and Mark Kennard (Griffith University), and Johan Rall (Ecosun); invertebrate ecology and microbiology, Robert Skoroszewski (Senqu Consultants); herpetology, Neels Jacobsen (private); water-dependent mammals and birds, Sam Ferreira (Pretoria University); surveying, Lekhetho Lesenyeho (private); sociology and anthropology, Christian Boehm, David Hall and John Gay (Sechaba Consultants); public health, Rose Phillips (SA Medical Research Council); animal health, Daniel Phororo (private); water supply, Silver Yance (SMEC International); economics, Hossein Sabet and Moeketsi Majoro (University of Lesotho); professional support, Roz Townsend, Liz Day and Rebecca Tharme. Additionally, development of DRIFT benefited greatly from inputs from the Panel of Experts appointed by LHDA, in particular, Tom McMahon (Australia), Jane Doolan (Australia), Mike Mentis (South Africa) and Thayer Scudder (USA), and from Stan Hirst (LHDA) and Rafik Hirji (World Bank).
REFERENCES Arthington AH. 1998. Comparative evaluation of environmental flow assessment techniques: review of holistic methodologies. LWRRDC Occasional Paper 26/98. LWRRDC: Canberra. Arthington AH, Bunn SE, Pusey BJ, Bluhdorn DR, King JM, Day JA, Tharme RE, O’Keeffe JH. 1992. Development of an holistic approach for assessing environmental flow requirements of riverine ecosystems. In Proceedings of an international seminar and workshop on water allocation for the environment, November 1991, The Centre for Water Policy Research, University of New England. Pigram JJ, Hooper BP (eds). Armidale, Australia. Birkhead AL, Olbrich BW, James CS, Rogers KH. 1997. Developing an integrated approach to predicting the water use of riparian vegetation. Water Research Commission Report No. 474/1/97. Pretoria, South Africa. Breen C, Dent M, Jaganyi J, Madikezela B, Maganbeharie J, Ndlovu A, O’Keeffe J, Rogers K, Uys M, Venter F. 2000. The Kruger National Park Rivers Research Programme. Water Research Commission Report No. TT130/00. Pretoria, South Africa. Brown CA, Sparks A, Howard G. 2000. Palmiet River Instream Flow Assessment: Instream Flow Requirement for the riverine ecosystem. Proceedings of the IFR Workshop and determination of associated dam yields. In Southern Waters. Report No. G400-000499 to the South African Department of Water Affairs and Forestry. Clarke KR, Warwick RM. 1994. Change in Marine Communities: an approach to statistical analysis and interpretation. Natural Environment Research Council: UK. Jewitt GPW, G¨orgens AHM. 2000. Scale and model interfaces in the context of integrated water resources management for the rivers of the Kruger National Park . Water Research Commission Report No. 627/1/00. Pretoria, South Africa. Jewitt GPW, Heritage GL, Weeks DC, Mackenzie JA, van Niekerk A, G¨orgens AHM, O’Keeffe J, Rogers K, Horn M. 1998. Modelling abiotic-biotic links in the Sabie River. Water Research Commission Report No. 777/1/98. Pretoria, South Africa. King J, Louw D. 1998. Instream flow assessments for regulated rivers in South Africa using the Building Block Methodology. Aquatic Ecosystem Health and Management 1: 109–124. King JM, Schael DM. 2001. Testing the ecological relevance of a spatially-nested geomorphological hierarchy for river management. Water Research Commission Report No 754/1/01. Pretoria, South Africa, 275 pp. King JM, Tharme RE. 1994. Assessment of the instream flow incremental methodology and initial development of alternative instream flow methodologies for South Africa. Water Research Commission Report No. 295/1/94. Pretoria, South Africa. King JM, Tharme RE, Brown CA. 1999. World Commission on Dams Thematic Report: definition and implementation of instream flows. World Commission on Dams: Cape Town. King JM, Tharme RE, de Villiers MS. (eds). 2000. Environmental flow assessments for rivers: manual for the Building Block Methodology. Water Research Commission Technology Transfer Report No. TT131/00. Pretoria, South Africa. Metsi Consultants. 2000a. Consulting services for the establishment and monitoring of the instream flow requirements for river courses downstream of LHWP dams. Final Report: Summary of main findings. Report No. 648-F-02. Lesotho Highlands Development Authority Contract 648: Maseru, Lesotho. Metsi Consultants. 2000b. Consulting services for the establishment and monitoring of the instream flow requirements for river courses downstream of LHWP dams. Hydrology—Volume 1 of 6. Report No. 648-F-13 (Vol 1). Lesotho Highlands Water Development Authority Contract 648: Maseru, Lesotho. Metsi Consultants. 2000c. Consulting services for the establishment and monitoring of the instream flow requirements for river courses downstream of LHWP dams. Habitat Mapping. Report No. 648-F-12. Lesotho Highlands Development Authority Contract 648: Maseru, Lesotho. Metsi Consultants. 2000d. Consulting services for the establishment and monitoring of the instream flow requirements for river courses downstream of LHWP dams. Fish. Report No. 648-F-18. Lesotho Highlands Development Authority Contract 648: Maseru, Lesotho. Metsi Consultants. 2000e. Consulting services for the establishment and monitoring of the instream flow requirements for river courses downstream of LHWP dams. Sociology. Report No. 648-F-08. Lesotho Highlands Development Authority Contract 648: Maseru, Lesotho. Copyright 2003 John Wiley & Sons, Ltd.
River Res. Applic. 19: 619–639 (2003)
RESPONSES TO FLOW TRANSFORMATION
639
Metsi Consultants. 2000f. Consulting services for the establishment and monitoring of the instream flow requirements for river courses downstream of LHWP dams. Economics. Report No. 648-F-22. Lesotho Highlands Development Authority Contract 648: Maseru, Lesotho. Reiser DW, Ramey MP, Wesche TA. 1989a. Flushing flows. In Alternatives in Regulated River Management, Gore JA, Petts GE (eds). CRC Press: Florida. Reiser DW, Wesche TA, Estes C. 1989b. Status of instream flow legislation and practice in North America. Fisheries 14(2):22–29. Rowntree KM, And Wadeson RA. 1999. A hierarchical geomorphological model for the classification of selected South African rivers. Water Research Commission Report No. 497/1/99. Pretoria, South Africa. Stalnaker C, Lamb BL, Henriksen J, Bovee K, Bartholow J. 1995. The Instream Flow Incremental Methodology: A primer for IFIM . Biological Report 29. US Department of the Interior, National Biological Service: Washington, DC. Swales S, Harris JH. 1995. The expert panel assessment method (EPAM): a new tool for determining environmental flows in regulated rivers. In The Ecological Basis for River Management, Harper DM, Ferguson AJD (eds). John Wiley & Sons: New York. Ter Braak CJ. 1987. The analysis of vegetation–environment relationships by Canonical Correspondence Analysis. Vegetatio 64:69–77. Tharme RE. 1996. Review of international methodologies for the quantification of the instream flow requirements of rivers. Water Law Review: final report for policy development, for the South African Department of Water Affairs and Forestry: Pretoria. Freshwater Research Unit: University of Cape Town. Tharme RE, King JM. 1998. Development of the Building Block Methodology for instream flow assessments and supporting research on the effects of different magnitude flows on riverine ecosystems. Water Research Commission Report No 576/1/98. Pretoria, South Africa.
Copyright 2003 John Wiley & Sons, Ltd.
River Res. Applic. 19: 619–639 (2003)