Eurographics/ IEEE-VGTC Symposium on Visualization 2008 A. Vilanova, A. Telea, G. Scheuermann, and T. Möller (Guest Editors)
Volume 27 (2008), Number 3
A Screen Space Quality Method for Data Abstraction J. Johansson† and M. Cooper‡ Norrköping Visualization and Interaction Studio, Linköping University, Sweden
Abstract The rendering of large data sets can result in cluttered displays and non-interactive update rates, leading to time consuming analyses. A straightforward solution is to reduce the number of items, thereby producing an abstraction of the data set. For the visual analysis to remain accurate, the graphical representation of the abstraction must preserve the significant features present in the original data. This paper presents a screen space quality method, based on distance transforms, that measures the visual quality of a data abstraction. This screen space measure is shown to better capture significant visual structures in data, compared with data space measures. The presented method is implemented on the GPU, allowing interactive creation of high quality graphical representations of multivariate data sets containing tens of thousands of items. Categories and Subject Descriptors (according to ACM CCS): I.3.6 [Computer Graphics]: Methodology and Techniques I.3.3 [Computer Graphics]: Picture/Image Generation I.4.7 [Image Processing and Computer Vision]: Feature Measurement
1. Introduction In visual data exploration tasks, data size is a key factor in whether the analysis can be performed efficiently. For large numbers of data items the screen may become cluttered. In addition, a large data set slows interaction, making the process laborious. Depending on the visualization domain this problem has many facets, consequently many different strategies may be applicable. This paper addresses these issues in the domain of information visualization and, in particular, focuses on representations of data as points or lines. A common strategy for speeding the analysis is to make an abstraction of the data set, that is to reduce the amount of data to be visualized and analysed. For the visual analysis to remain accurate, the graphical representation of the abstracted data set must retain the significant features of the original. In information visualization, data sets are often complex and multivariate, and a range of features such as outliers, clusters and correlations, may be of interest. It is therefore important to define appropriate methods to measure the quality of the abstracted data set (similarity with the original data set). This is commonly done in the multivariate †
[email protected] ‡
[email protected] c 2008 The Author(s)
c 2008 The Eurographics Association and Blackwell Publishing Ltd. Journal compilation Published by Blackwell Publishing, 9600 Garsington Road, Oxford OX4 2DQ, UK and 350 Main Street, Malden, MA 02148, USA.
data space but such measures are typically slow and often do not retain structural differences in the visual representation. This paper proposes a screen space quality method based on distance transforms [RP66] that, instead of measuring similarity in data space, measures similarity between the graphical representations of the original and abstracted data sets. Since it focuses on screen space it better captures significant visual features of the representation. Currently only parallel coordinates [Ins85,Weg90] is supported but it would be straightforward to adapt it for other visualization techniques. The main contributions presented in this paper can be summarized as: • a screen space method that can be used to measure the quality of graphical representations of abstracted versions of large, multivariate data sets • distance transforms as a means to create highly abstracted data sets, resulting in de-cluttered graphical representations that preserve significant features in data regardless of the abstraction method used • an efficient, visual quality-driven method that allows users to target and maintain a designated abstraction level The screen space quality method is implemented on the GPU using high precision buffers, allowing interactive abstraction of large, multivariate data sets.
J. Johansson & M. Cooper / A Screen Space Quality Method for Data Abstraction
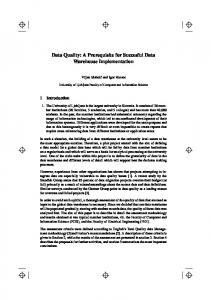
(a) Original data set (2000 items).
(b) 1000 items are removed but outliers are kept (s = 0.97).
(c) Only the five outliers are removed (s = 0.18).
Figure 1: A synthetic data set displayed in parallel coordinates. The data set comprises 2000 items of which five are outliers. The removal of the five outliers has a strong influence on the overall structure, a fact which is clearly captured by the screen space quality method (s=1.0 represents a perfect match).
This paper is organized as follows. Section 2 describes related work on visual quality techniques. 3 and 4 give a detailed description of the presented visual quality method. Section 5 deals with implementation issues while 6 presents the results, and 7 the conclusions and future work. 2. Related Work Finding ways to interactively visualize large data sets is an active research field in information visualization [ED07]. This section focuses on the most closely-related techniques dealing with visualization using points or lines. Many techniques to deal with cluttered displays have been proposed, based, for example, on frequency and density information [WL97, AdOL04, JLJC06] or data abstraction [FWR99, NH06]. These techniques all reveal structures in large data but do not include any visual quality measure so it is hard to know whether important features have been lost. In [PWR04] clutter is measured and reduced by dimension reordering but, since no data abstraction is performed, the method is less suitable for large data. An attempt to define a visual quality metric systematization is presented by Bertini and Santucci in [BS06b]. They also use, in [BS06a], quality metrics together with sampling strategies in an attempt to improve the visual quality of a graphical representation. This method gives a quality measure for a visualization of an abstracted data set but only for sampling and for point based visualization techniques (such as scatter plots) which limits its usefulness. The most similar methods to the work in this paper are presented by Cui et al. [CWRY06]. They use histograms and nearest neighbour measures to compute the similarity between an original data set and its abstracted version. Their methods are based in the data space and can be applied prior to any visualization technique. Data space measures
are, however, typically slow since the data must be traversed several times, but more importantly they fail to capture structural differences in the visualization of the data. Failing to retain such patterns in the visual representation can, in some cases, eliminate the very purpose of visualization. The quality method presented in this paper is based on the screen space, thus it captures differences in graphical representations of the data. It consists of individual steps allowing it to be customized for a range of information visualization techniques, and it can be used with any abstraction method. 3. The Screen Space Quality Method The screen space quality method is used to measure the quality of a data abstraction: how similar it is to the original data set. The comparison is made in screen space by comparing the graphical representations, not the data sets. Figure 1a shows a parallel coordinates visualization of a synthetic data set containing 2000 items, each consisting of two variables. The parallel coordinates technique [Ins85, Weg90] represents variables on uniformly spaced axes, placed in parallel. Each multivariate data item then corresponds to a polyline that intersects the axes at the coordinate values of the data item. In figure 1a, all items except five are part of a large cluster. The remaining five items are considered to be outliers. Figure 1b shows an abstraction of the data set where 1000 items have been removed but the five outliers are still present, and figure 1c shows a different abstraction where only the five outliers have been removed. In the context of preserving structures in data it can be argued that the abstraction shown in figure 1b has a much higher similarity to figure 1a than that shown in figure 1c since it better preserves the overall shape. Applying the screen space quality method presented in this paper gives a similarity value (described in detail below) of 0.97 for the abstraction shown in figure 1b, and only c 2008 The Author(s)
c 2008 The Eurographics Association and Blackwell Publishing Ltd. Journal compilation
J. Johansson & M. Cooper / A Screen Space Quality Method for Data Abstraction Image generation
clusters. Clusters can then be included in the abstracted data set by one or more representative data items.
Distance transform
Original data Abstraction
Image generation
Since the screen space quality method measures the similarity between the transformed graphical representations of the original and abstracted data sets it is not restricted to any specific abstraction method but can be used with any method the user feels is appropriate.
Comparison
Distance transform
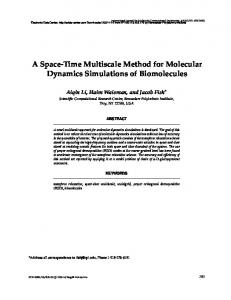
Figure 2: The screen space quality method consists of the following steps: (1) the original data set is abstracted, (2) the graphical representations of the original and abstracted data sets are rendered as images, (3) the images are transformed using distance transforms, and (4) a comparison function gives the quality value.
a value of 0.18 for the abstraction shown in figure 1c (a similarity value of 1.0 represents a perfect match). This is one example of structures that the data space methods described in [CWRY06] fail to capture since the large number of small changes from the 1000 removed items give a larger error than the removal of just the five outliers. Relative densities in the abstracted data sets are, however, lost in favour of retaining structures such as outliers and overall shape in the graphical representation. 3.1. General Method The screen space quality method comprises the following four steps (also illustrated in figure 2): 1. an abstracted version of the original data set is created 2. the graphical representations of the original and abstracted data sets are rendered as two, equally sized images (IO and IA ). 3. the images are transformed using a distance transform, φD , according to DO = φD (IO ) DA = φD (IA )
(1)
where DO and DA are new images of the same size as IO and IA representing the corresponding distance maps 4. the similarity between the distance maps is calculated as s = Ψ(DO , DA ), where Ψ is a comparison function 3.2. Data Abstraction Data abstraction can be carried out in a number of ways. User selection can be used, for example, or sampling or clustering as automated methods. Sampling is the process of selecting, usually at random, a subset of the data which will, hopefully, be representative of the original. Clustering involves the identification of groups of data items which are similar to each other and different from those in the other c 2008 The Author(s)
c 2008 The Eurographics Association and Blackwell Publishing Ltd. Journal compilation
3.3. Image Generation In this step, the graphical representations of the original and abstracted data sets are stored as high precision density maps. Each pixel contains information about the number of primitives (such as points or lines) intersecting it. Currently only parallel coordinates are supported but other visualization techniques such as scatter plots, line charts, radviz, etc, could be included. 3.4. Distance Transformation Distance transforms [RP66] are often used in the field of image processing and have many applications [Rag93] such as image matching, data compression and skeletonizing, just to mention a few. A distance transform operates on an image and produces a new image, the distance map, in which each pixel describes the distance from that pixel to the closest object. In this context an object is a pixel with a value greater than zero, corresponding to one or more primitives intersecting that pixel. The distance transform is sensitive to small changes and the removal of isolated objects has a high influence on the distance map. Comparing distance maps therefore puts the emphasis on preserving the overall structure. Having several primitives covering the exact same area does not contribute to the overall shape and removing one should therefore not affect the similarity value. This is handled by the distance transform since an object may comprise one or more primitives. If the abstracted data set does not contain the original items in the data set but, instead, consists of representative items (as in the case of clustering where a cluster centroid might be used to represent a number of similar items) a comparison of the graphical representations of the original and abstracted data sets may give an incorrect result. This is illustrated in figure 3 where the blue primitives represent items in the original data set and the brown primitives represent items in the abstraction. Since the original and abstracted primitives do not overlap, a pixel by pixel comparison is not possible. Using a distance transform, however, and computing the similarity value for the corresponding distance maps these types of comparisons are made possible. When applying the distance transform the Euclidean or City-block distance metrics are often used. When working in the parallel coordinates space, however, the values of the
J. Johansson & M. Cooper / A Screen Space Quality Method for Data Abstraction Image generation
Distance transform
Original data Abstraction
Image generation
Figure 3: Two cases where pixel by pixel comparison of original (blue) and abstracted (brown) versions is not possible since the primitives do not overlap. The left and right images show a scatter plot and parallel coordinates.
Comparison
Distance transform
Figure 5: Quality-driven abstraction. A visual quality is predefined and controls the abstraction process. Generating the image and computing the distance map for the original data set is only done once (steps in white) while the corresponding steps for the abstracted data set together with the comparison are made for each new abstraction (steps in blue).
32) vertical segments. The correlation coefficient measure is then applied to each segment and the final correlation is the average value.
Object
0
1
2
3
Figure 4: An illustration of the distance transform used for parallel coordinates. The left figure shows a graphical representation consisting of two lines, each resulting in several objects (in blue). The right figure shows the corresponding distance map where each pixel describes the vertical distance to the closest object, colour coded from black (a distance of 0) to light grey (a distance of 3).
variables only change in the vertical direction and the width of the parallel coordinates display is arbitrary. Because of this only the vertical distances need be considered in the distance transform, see figure 4 for an illustration. To further emphasize isolated objects the distance can be raised to any arbitrary power. Powers in the range of 1–3 seem to work well for the data sets that have been tested. 3.5. Comparison The comparison function computes the similarity between the distance maps, DO and DA . Any comparison function that compares two images could be used. In this paper the Pearson correlation coefficient is used which is a standard measure for image comparison [GW02], yielding a value between −1 and +1 representing perfect negative and positive correlations, respectively. A value of 0 indicates that there is a complete absence of correlation. To emphasize local changes the images can be partitioned into (typically 16–
The interpretation of the correlation coefficient is highly application dependent but, in the current context, values above 0.90 have been found to produce abstracted data sets of acceptable visual quality.
4. Visual Quality-Driven Abstraction The screen space quality method can also be used to construct abstracted data sets of a user-defined minimum visual quality. This can be achieved by increasing the abstraction level until a visual quality value, T , is reached. This means that for each new abstraction level, the graphical representation of the abstracted data set, IA , and its distance map, DA , are generated, and s = Ψ(DO , DA ) is computed (the image generation and transformation of the original data set need only be performed once). This is shown in figure 5 where the steps in white are performed only once, and the steps in blue each time the abstraction level is changed. How to change the abstraction level depends on the chosen method. In the case of random sampling, which is the abstraction method focused on for the quality-driven abstraction, an item is randomly removed from the representation of the abstracted data set (originally equal to that of the original data set). If the removal affects the representation such that s < T , the item is put back and not tested again. This process is repeated until all items have been tested. In the case of using clustering as the abstraction method, which approach to take depends on the nature of the clustering algorithm. For example, constructing exclusive clusters using the K-means algorithm, one approach would be to start with few clusters and repeatedly re-cluster the data with an increasing number until T is reached. c 2008 The Author(s)
c 2008 The Eurographics Association and Blackwell Publishing Ltd. Journal compilation
J. Johansson & M. Cooper / A Screen Space Quality Method for Data Abstraction
(a) The original data set containing 16384 items.
(b) Targeting a visual quality of 0.99 retains 1281 items.
(c) Targeting a visual quality of 0.95 retains 987 items.
(d) Targeting a visual quality of 0.85 retains 102 items.
Figure 6: The out5d data set displayed in parallel coordinates (a). Six areas, showing different structures, have been labelled A–F. Targeting graphical representations having qualities of 0.99 (b) or 0.95 (c) significantly reduces the number of items in the display while maintaining structures. Targeting a quality value of 0.85, however, results in an almost complete loss of structure.
5. Implementation The screen space quality method has been implemented in C++ using OpenGL, the OpenGL Shading Language and frame buffer objects (FBOs). A laptop with a 2.0 GHz processor, 1.0 GB RAM and an NVIDIA GeForce Go 6800 graphics card has been used for testing. To generate images (IO and IA ) of the parallel coordinates representations, high precision buffers, as presented in [JLJC05], are used. A density map is created by rendering each item (polyline) to a high precision texture using additive blending. FBOs are used in order to directly render to textures, avoiding time consuming texture copying. The distance transform, φD , is implemented on the GPU using a fragment shader. The special case of taking only vertical distances into consideration yields a parallel operation that is well-suited to the GPU. For each texel the vertical distance to the closest object is found by simultaneously checking both vertical directions. In order to compute the similarity between the two generated distance maps (DO and DA ) they are copied to the CPU. This is a quite time consuming operation but is done since computing the correlation coefficient is a global operation and not well suited to the GPU. When performing a quality-driven abstraction, IA and DA have to be generated for each new abstraction level. When random sampling is used as the abstraction method, testing after the removal of each individual item is time consumc 2008 The Author(s)
c 2008 The Eurographics Association and Blackwell Publishing Ltd. Journal compilation
ing. Instead sets of items are removed between each test. If s ≥ T after the removal of the set, the set is discarded and not tested again (s is obtained from the comparison function and T is the target minimum value). If s < T the entire set is added back and each item within the set is tested individually. Adding and removing individual items or sets of items from IA is done using additive and subtractive blending, thus it is not necessary to completely recreate the entire image. 6. Results The effectiveness of the screen space quality method is demonstrated using two data sets. The first is the ‘out5d’ data set, courtesy of Peter Ketelaar, obtained from http://davis.wpi.edu/∼xmdv. This data set has 5 variables and 16384 items. The second, from Statistics Sweden (the Swedish Census Bureau), comprises eight variables concerning household economics in 7342 regions of Sweden. 6.1. Comparison of Targeted Quality Levels In figure 6a, the out5d data set is displayed with parallel coordinates. This example will focus on the six regions that have been labelled A–F. A and C are two high density regions where many similar items share a small area. D is a less dense region where the large number of items makes it difficult to see any details. B is an area where the items from area C spread out. Finally, E and F are two regions that are slightly denser than their surroundings.
J. Johansson & M. Cooper / A Screen Space Quality Method for Data Abstraction
(a) The representation obtained when using the density map in (b) for transformation and comparison.
(b) Using a density map of size 512 × 256 pixels retains 215 items.
(c) The representation obtained when using the density map in (d) for transformation and comparison.
(d) Using a density map of size 256 × 128 pixels retains 242 items.
(e) The representation obtained when using the density map in (f) for transformation and comparison.
(f) Using a density map of size 128 × 64 pixels retains 231 items.
Figure 7: The size of the images in which the graphical representations of the original and abstracted data sets are rendered, transformed and compared, influences the time taken to construct the abstracted data set. Targeting a visual quality of 0.90 using image sizes of 512 × 256, 256 × 128 and 128 × 64 results in times of 18, 8 and 2 seconds, respectively. b, d and f show the density maps of the abstracted data sets for the corresponding image sizes. The resulting abstracted data sets are all displayed using an image size of 512 × 256 (a, c and e).
The screen space quality method is used to target different graphical representations of abstracted data sets (as described in section 4) using sampling. Targeting a quality of 0.99 produces a graphical representation having 1281 items (figure 6b). This corresponds to 7.8 percent of the original data set and the structure is well preserved in all the specified regions. In addition, the relative densities in region D and the spread of items in region B are actually made more apparent due to the de-cluttering of the data in those regions. In figure 6c the targeted visual quality is 0.95 which produces a graphical representation having 987 items (6.0 percent of the original data set) and only subtle differences in the six regions are found, compared to the representation in figure 6b. Targeting a significantly lower visual quality of
0.85 gives a graphical representation having 102 items (0.6 percent of the original data set). As seen in figure 6d, the only regions in which the structures are still preserved are A and C. The others are still present but are less apparent. 6.2. Performance and Complexity Aspects The time required to compute each screen space comparison is governed by two things: the number of data items present in the abstracted data set and the size of the images used to perform the comparison. Considering the stages in figure 2, the time required for image generation increases linearly with the number of data items. The time taken to perform the distance transformation and comparison increases c 2008 The Author(s)
c 2008 The Eurographics Association and Blackwell Publishing Ltd. Journal compilation
J. Johansson & M. Cooper / A Screen Space Quality Method for Data Abstraction
(a) Original data set comprising 7342 items.
(b) Targeting a visual quality of 0.90 retains 155 items.
(c) Using 155 randomly picked items results in a visual quality of 0.74.
(d) Using the K-means algorithm to construct 155 clusters results in a visual quality of 0.76.
Figure 8: Producing an abstraction of the household economics data set (a) by (b) targeting a visual quality of 0.90 using sampling retains 155 items. Structures are preserved in B–E and outliers are revealed in A. Randomly picking 155 items with no quality control (c) only preserves structures in D. Using 155 cluster centroids (d) also preserves structures in A and E.
with the number of pixels in the image but is constant for any particular image size. Consequently the time required to perform a comparison for a given image size varies linearly with the number of data items. The time taken for the abstraction will depend on the method used. Considering figure 5, the time taken to construct an abstracted data set by targeting a visual quality depends on the size of the data, the chosen abstraction method and on the image size used. Using sampling together with an image size of 512 × 256 pixels for the screen space comparison, it takes around 150 seconds to target a visual quality of 0.90 if individually testing each of the 16384 items of the out5d data set. Here the complexity of the comparison process is constant since the image generation is implemented using additive and subtractive blending. The number of iterations required, however, depends upon the number of data items and increases no more than linearly. Since the abstraction method is carried out repeatedly, its complexity might prove prohibitive but using random sampling the approach remains linear in the number of data items. Removing and testing sets (as described in section 5), rather than individual items, reduces the overall time significantly. Partitioning the 16384 items into 100 sets reduces the time from 150 to 18 seconds. The appropriate number of sets to use will vary between different data sets. The creation time can be further decreased by reducing the image size. Using a size of 256 × 128 reduces the time to c 2008 The Author(s)
c 2008 The Eurographics Association and Blackwell Publishing Ltd. Journal compilation
around 8 seconds and 128 × 64 to 2 seconds. Figures 7a, c and e show the abstracted data sets obtained using image sizes of 512 × 256 (figure 7b), 256 × 128 (figure 7d), and 128 × 64 (figure 7f), respectively. Regardless of the image size used for the visual quality measurement, resulting graphical representations are ultimately rendered at 512 × 256 pixels in figures 7a, c and e, a sufficiently large size to permit the inspection of the data. Clearly each of the three resulting abstracted data sets shows little difference between them and all retain the overall structure of the original data set (figure 6a). Each of the abstracted data sets has also been re-tested using the image size of 512 × 256 and each still gives a similarity value of 0.90 (the targeted value). 6.3. Comparison of Abstraction Methods The household economics data set is displayed in figure 8a. A small number of items that seem to be outliers are seen in region A. B and E are two sparse regions while C has only a single strong outlier. D is one of the denser regions. Targeting an abstraction level of 0.90 using sampling results in a graphical representation having 155 items (see figure 8b). Examining this image it can be seen that B–E are preserved and the previously suspected outliers in A have been revealed. By comparison, randomly picking 155 items without any quality control gives the result shown in figure 8c. This representation has a similarity value of only 0.74 and
J. Johansson & M. Cooper / A Screen Space Quality Method for Data Abstraction
visual inspection shows that the outliers in A and C have disappeared, and the sparse regions in B and E are no longer present. The only structure still remaining is the dense region D. As a final comparison the K-means clustering algorithm is used to construct 155 clusters. The cluster centroids are then used as the visual representation, see figure 8d. This representation has a similarity value of 0.76. In addition to the retained density in D, the outliers in A and E are partly preserved. However, The strong outlier in C is lost, as is the sparse region B. The abstracted data sets in figures 8c and d were pregenerated using the various abstraction methods. Computing the quality value in each case: generating density maps, transforming and comparing them, takes 20 milliseconds. 7. Conclusions and Future Work This paper has introduced a screen space quality method based on distance transforms for data abstraction. The method measures similarities in the screen space which has been shown to better retain significant features in the graphical representation of the data. As has been demonstrated the method retains structures such as outliers and overall shape in the graphical representation. Relative densities are, however, not retained when favouring the retention of structure in the data abstraction. The visual quality of the graphical representation of an abstracted data set can be compared with that of the original data in about 20 ms. When targeting a user-defined quality the creation time of the abstracted data set depends on the abstraction method and on the size of the images used for rendering, transformation and comparison. Using random sampling it has been shown that by using low resolution images it is possible, with little loss of precision, to construct highly abstracted data sets on interactive time scales, resulting in de-cluttered graphical representations that retain the significant features in data sets with tens of thousands of items.
[BS06a] B ERTINI E., S ANTUCCI G.: Give chance a chance—modeling density to enhance scatter plot quality through random data sampling. Information Visualization 5, 2 (2006), 95–110. [BS06b] B ERTINI E., S ANTUCCI G.: Visual quality metrics. In Proceedings 2006 AVI workshop on Beyond Time and Errors (BELIV ’06) (2006), pp. 1–5. [CWRY06] C UI Q., WARD M. O., RUNDENSTEINER E. A., YANG J.: Measuring data abstraction quality in multiresolution visualizations. IEEE Transactions on Visualization and Computer Graphics 12, 5 (2006), 709– 716. [ED07] E LLIS G., D IX A.: A taxonomy of clutter reduction for information visualisation. IEEE Transactions on Visualization and Computer Graphics 13, 6 (2007), 1216– 1223. [FWR99] F UA Y.-H., WARD M. O., RUNDENSTEINER E. A.: Hierarchical parallel coordinates for exploration of large datasets. In Proceedings IEEE Visualization 1999 (1999), pp. 43–50. [GW02] G ONZALEZ R. C., W OODS R. E.: Digital Image Processing, second ed. Prentice Hall, 2002. [Ins85] I NSELBERG A.: The plane with parallel coordinates. The Visual Computer 1, 4 (1985), 69–91. [JLJC05] J OHANSSON J., L JUNG P., J ERN M., C OOPER M.: Revealing structure within clustered parallel coordinates displays. In Proceedings IEEE Symposium on Information Visualization 2005 (2005), pp. 125–132. [JLJC06] J OHANSSON J., L JUNG P., J ERN M., C OOPER M.: Revealing structure in visualizations of dense 2D and 3D parallel coordinates. Information Visualization 5, 2 (2006), 125–136. [NH06] N OVOTNÝ M., H AUSER H.: Outlier-preserving focus+context visualization in parallel coordinates. IEEE Transactions on Visualization and Computer Graphics 12, 5 (2006), 893–900.
Future work will include extending the method to other visualization techniques and investigating new comparison functions. A user study should also be performed to determine whether the objective visual quality corresponds with the subjective opinion.
[PWR04] P ENG W., WARD M. O., RUNDENSTEINER E. A.: Clutter reduction in multi-dimensional data visualization using dimension reordering. In Proceedings IEEE Symposium on Information Visualization 2004 (2004), pp. 89–96.
Acknowledgements
[Rag93] R AGNEMALM I.: The Euclidean Distance Transform. PhD thesis, Linköping University, 1993.
This work has been supported by the Swedish Foundation for Strategic Research through the Strategic Research Centre MOVIII and the VISIMOD II project, grant A3 02:116.
[RP66] ROSENFELD A., P FALTZ J. L.: Sequential operations in digital picture processing. Journal of the Association for Computing Machinery 13, 4 (1966), 471–494.
References
[Weg90] W EGMAN E. J.: Hyperdimensional data analysis using parallel coordinates. Journal of the American Statistical Association 85, 411 (1990), 664–675.
[AdOL04]
A RTERO A. O., DE O LIVEIRA M. C. F., L EVH.: Uncovering clusters in crowded parallel coordinates visualizations. In Proceedings IEEE Symposium on Information Visualization 2004 (2004), pp. 81–88. KOWITZ
[WL97] W EGMAN E. J., L UO Q.: High dimensional clustering using parallel coordinates and the grand tour. Computing Science and Statistics 28 (1997), 352–360. c 2008 The Author(s)
c 2008 The Eurographics Association and Blackwell Publishing Ltd. Journal compilation