IEEE TRANSACTIONS ON NUCLEAR SCIENCE, VOL. 49, NO. 1, FEBRUARY 2002
195
A Segmentation Technique to Determine Fat Content in NMR Images of Beef Meat Lucia Ballerini, Student Member, IEEE, Anders Högberg, Gunilla Borgefors, Senior Member, IEEE, Ann-Christin Bylund, Ann Lindgård, Kerstin Lundström, Olivier Rakotonirainy, and Bassam Soussi
Abstract—There is a constant need for new methods of meat-quality evaluation. Recent advances in the area of computer and video processing have created new ways to monitor quality in the food industry. In this paper, we describe an image-processing technique to determine fat content in beef meat. To achieve this, nuclear magnetic resonance (NMR) images of beef meat have been used. The inherent advantages of NMR images are many. Chief among these are unprecedented contrasts between the various structures present in meat, such as muscle, fat, and connective tissue. Moreover, the three-dimensional nature of the NMR method allows the analysis of isolated cross-sectional slices of the meat and the measure of the volumetric content of fat, and it is not limited to measurements of the superficially visible fat. We propose a segmentation algorithm for the detection of fat and a filtering technique to remove intensity inhomogeneities in NMR images, caused by nonuniformities of magnetic field during acquisition. Measurements have been successfully correlated with chemical analysis and digital photography. We also propose a method to quantify the distribution of fat. Our results show that the NMR technique is a promising noninvasive method to determine fat content in meat. Index Terms—Beef meat, fat content, food quality, image processing, nuclear magnetic resonance (NMR).
I. INTRODUCTION
T
HERE is a constant need for new methods of meat-quality evaluation, resulting from the demand from researchers for improved techniques to deepen the understanding of meat features, as well as the demand from consumers for high-quality meat products [1]. Fat content in meat influences some important meat-quality parameters. The quantitative fat content has been shown to influence the palatability characteristics of meat. There are several methods of analyzing quantitative fat content and its visual appearance in meat. However, compared with nuclear magnetic resonance (NMR), few of them are satisfactory enough in terms of fat quantification in a cross-section of a consumer-size meat slice without using large amounts of organic solvents or being too time-consuming. Manuscript received November 4, 2000; revised March 17, 2001. This work was supported by MISTRA under the Swedish National FOOD21 research program. L. Ballerini and G. Borgefors are with the Centre for Image Analysis, Swedish University of Agricultural Sciences, SE-75237 Uppsala, Sweden (e-mail:
[email protected]). A. Högberg, A.-C. Bylund, and K. Lundström are with the Department of Food Science, SLU, SE-75007 Uppsala, Sweden. A. Lindgård, O. Rakotonirainy, and B. Soussi are with the Wallenberg Laboratory, Sahlgrenska University Hospital, SE-41345 Göteborg, Sweden. Publisher Item Identifier S 0018-9499(02)01629-5.
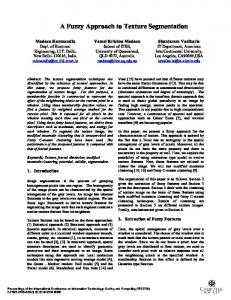
Fig. 1. Example of NMR image of beef meat: note the connective tissue in the middle (darker area), lean muscle on the right side, and some amount of fat (lighter areas) on the left side.
Recent advances in the area of computer and video processing have created new ways to monitor quality in the food industry. Gerrard et al. [2] have developed an image-processing system to evaluate beef quality, in particular to determine beef marbling and color scores. In the work of Li et al. [3], color, marbling, and image texture features were used to develop tenderness prediction models by using statistical and neural network techniques. Texture features have also been used by Shiranita et al. [4], [5]. They study a method to detect meat quality using the concept of “marbling score” and texture analysis. In [5], they propose the implementation of a meat grading system using neural network techniques and multiple regression analysis. Basset et al. [6] use texture analysis to classify photographic images of meat slices according to three biological factors: muscle type, age, and breed. We investigate the use of a new technology to control the quality of meat: NMR imaging. The NMR technique has been developed and greatly improved for medical imaging and is in common clinical use. Recently, NMR has been applied in different fields of food science [7]. Therefore, we applied NMR on beef meat. There are several advantages with NMR images compared with camera images. There is a clear contrast between different structures in meat, such as muscle, fat, and connective tissue. In particular, fat and connective tissue appear very contrasting in NMR images (see Fig. 1) but are almost indistinguishable in camera images.
0018-9499/02$17.00 © 2002 IEEE
196
IEEE TRANSACTIONS ON NUCLEAR SCIENCE, VOL. 49, NO. 1, FEBRUARY 2002
In addition, NMR imaging allows a three-dimensional analysis of the meat composition and the volumetric content of fat, and it is not limited to measurements of the superficially visible fat. Few preliminary studies of the use of NMR to determine fat content can be found in the literature. Geers et al. [8] compare three methods to quantify intramuscular fat content in pigs: in vivo NMR spectroscopy, in vitro gravimetry, and FTIR spectroscopy. Foster et al. [9] have made some preliminary studies of body fat amount and distribution in live pigs. Bonny et al. [10], [11] developed NMR imaging techniques to measure the distribution of fat and connective tissue in meat. In their work, chemical-shift selective inversion recovery sequence was adapted to generate two spatially registered images, where the signals coming from the water protons or from the lipid protons were suppressed. This paper describes an investigation of image-processing techniques for determining fat content in beef meat using NMR images. The aim is to find a low-cost, fast, and nondestructive method of determining fat content through image analysis. In particular, we propose a segmentation method and the use of median filters to deal with the intensity inhomogeneities of NMR images. We also propose a method to quantify the distribution of fat. II. METHODS NMR images of eight heifer longissimus dorsi muscle were acquired on a Bruker Biospec wide-bore horizontal magnet at 2.35 T. The contrast multislice multiecho is a commonly used NMR pulse sequence [12] and was used in this study with 19.5 ms, 345 ms, and 48 averages with a total scan time of 1 h 20 min. Meat pieces are 12 cm 6 cm. Slices are 2 mm thick. Nine slices with an interslice distance of 10 mm were acquired. The images are 512 256 pixel matrices with 256 gray levels per pixel at a resolution of approximately 0.2 mm 0.2 mm (see Fig. 2, as an example). We have developed automatic image-analysis methods for the specific problem of measuring the percentage of fat. In particular, segmentation algorithms (i.e., classification of different substances) have been optimized for these kinds of images. The segmentation algorithm to isolate fat from the remaining parts of each NMR image consisted of the following steps: 1) background suppression (histogram thresholding); 2) nonuniformity removal (median filtering and subtraction); 3) fat extraction (convolved image thresholding). The first step is performed through image thresholding based on histogram analysis techniques [13], since two well-separated peaks could be observed in the image histogram, the higher representing background pixels and the lower representing meat. in the background suppressed Each pixel at coordinates based on the corresponding gray image had a gray level in the original according to the following equation: level if otherwise
(1)
As regards fat extraction, a simple global threshold was not adequate to extract the fat from the meat muscle because of
Fig. 2. Original NMR image of the longissimus dorsi muscle from representative beef meat.
noise, gray-level intensity variability (probably due to nonuniformities of the magnetic field), and the low and space-varying contrast of fat structures. Thus, we used spatial filtering to enhance and detect such structures. We applied a correction algorithm, followed by the segmentation algorithm. Many different approaches to correction of low-frequency inhomogeneity artifacts in MR images have been reported in the literature [14]–[16]. Our line of reasoning is independent of these references. We used a nonlinear filtering method: the median filtering. Median filters are a subset of the order-statistic filters, so called because they are based on statistics derived from ordering (ranking) the elements of a set [17], [18]. The pixels in the neighborhood are ranked in the order of their gray levels, and the midvalue of the group is stored in the output pixel. In practice, we did not use the median filter directly on the spatial neighborhood, but we applied the local histogram processor as suggested by Lashin [19]. The local histogram processor in each image pixel performs a transformation , where is a nonlinear function that calculates a new value of the given pixel from a histogram over a spatial neighborhood of this pixel. In fact, this function consists of four subfunctions, as shown in Fig. 3. Here, the spatial neighborhood (S-neighborhood) of element is composed of pixels spatially surrounding , which is included. The preliminary the “central” element
BALLERINI et al.: DETERMINING FAT CONTENT IN NMR IMAGES OF BEEF MEAT
Fig. 3.
197
Block diagram of the local histogram processor.
estimation is the arithmetic mean value over the spatial 3 3 neighborhood of the current pixel. The histogram neighborhood (H-neighborhood) is defined as a subset of the pixels surrounding the current pixel in the hisnearest togram over the spatial neighborhood. We used the on value (KNV) neighborhood, i.e., the subset of the pixels belonging to the S-neighborhood whose values are the nearest to the current pixel value
KVN (2) where
is the variational row over the spatial neighborhood (3)
where is the pixel rank (number in the variational row), is and is the minimal the rank of the current pixel, sum of distances to the current pixel. The final estimation is the median value of the variational row over the H-neighborhood is (4) is the variational row from the pixels belonging to where is the size of the H-neighborhood. the H-neighborhood and is shown in Fig. 4. The output of the median filtering Ranks can be determined from the local histogram of the signal distribution over a neighborhood. There exists a fast recursive algorithm for calculation of local histograms for the neighborhood of each element at successive scanning of the picture by an aperture covering the desired spatial neighborhood. Therefore, the computational complexity of rank filtration algorithms is barely dependent on the size of the neighborhood. Moreover, further simplifications of computational costs, due to information redundancy in images, are possible. Therefore, the rank algorithms are, in principle, not computationally more complicated than those of linear filters. They are on a par with, or even superior to, linear filtration algorithms in another important aspect: simplicity of local adaptation. The rank algorithms are essentially adaptive or, more precisely, locally adaptive because, by definition, their parameters are functions of the local characteristics of pictures, namely, their local histogram [19]–[21]. (shown in Fig. 5) has been The difference image computed as (5) where
is the background suppressed image and is the median filter processed image.
Fig. 4. Median filter-processed image.
In this image, a suitable threshold value to separate fat from muscle has been chosen based on histogram observation. We computed the percentage of fat in this meat area as (6) where is the meat area and tion obtained as follows:
is the binary segmentaif otherwise
"fat"
(7)
For example, the percentage of fat calculated in this way is approximately 8% for the image of meat shown in Fig. 2. The segmentation results are shown in Fig. 6. Also, the distribution of fat is an important criterion for meatquality evaluation and its expected palatability. We propose a new method to describe and quantify the distribution of fat at different resolutions. The method is based on scale-based region homogeneity [22]. We consider a pyramid image representation, where the image is divided into four quadrants at each hierarchical level (see Fig. 7). The homogeneity of fat distribution can be easily
198
IEEE TRANSACTIONS ON NUCLEAR SCIENCE, VOL. 49, NO. 1, FEBRUARY 2002
Fig. 5. Nonuniformity removal: difference image between the background suppressed image and Fig. 4.
Fig. 6. Binary image containing all the fat flecks extracted from the image in Fig. 2.
related to the levels of the pyramid representation. Mean and standard deviation of fat percentage is computed for each level. Low values of standard deviation at low levels mean uniform distribution, while high values mean nonuniform distribution. We demostrated the validity of this method in [23]. We performed several simulations of different distributions on synthetic images and described the application to meat images. Fat distribution measures for the image shown in this paper are reported in Fig. 8. Fig. 7.
Pyramid image representation.
III. RESULTS The contents of fat in the longissimus dorsi muscle from eight heifers were analyzed. The percentage of fat extracted by the method proposed in this paper was compared with the percentage measured by chemical analysis. For each meat piece, we segmented and analyzed the NMR image closest to the meat sample collected for chemical analysis. Regression between fat content measured by chemical analysis and by NMR image analysis is reported in Fig. 9. was obtained beA good correlation tween the mean fat content measured by chemical analysis and by the present method. This value was better than the correlation value we obtained between chemical analysis and image analysis applied to digital photographs of the same meat samples [24], probably because NMR imaging provided the three-dimensional structure of the meat samples
Fig. 8. Quantification of fat distribution for image in Fig. 2: mean values of fat percentage for levels 1 and 2.
based on the chemical information of the proton mobility and distribution. In our case, the reconstructed two-dimensional images are based on the fat contained in the 2-mm-thick slice. The preliminary results show great promise in the use of image processing for evaluating fat contents in meat. The combined use of measurements of fat percentage and distribution can lead to a more precise description of meat quality.
BALLERINI et al.: DETERMINING FAT CONTENT IN NMR IMAGES OF BEEF MEAT
Fig. 9. Comparison of fat percentage measured by chemical analysis and by NMR image analysis.
Further validation studies on a larger set of data are necessary, however, to better evaluate method performance. An improvement of the NMR acquisition procedure will be necessary in order to develop a standard and fully automatic analysis method. The segmentation procedure itself could probably be improved by a more accurate estimation of intensity inhomogeneities. IV. CONCLUSION AND FUTURE WORK The aim of this paper was to investigate the possibility to using image analysis and NMR technique in the field of meat science. In this paper, we propose an image-processing application for a quantitative evaluation of percentage and distribution of fat in NMR meat images. Although this work is a pilot experiment and many improvements are still possible, the preliminary results seem promising enough to deserve to be released, also in order to get feedback from the scientific community. We have seen many possible applications of image analysis and NMR technology in the field of food science. Future work should consider ways to improve image-analysis methods for fat distribution variation and the extraction of other features related to meat components contributing to tenderness and palatability. Future work may also be directed at obtaining three-dimensional images, which might give new insights into the spatial organization of meat structural components and its relation to meat quality. ACKNOWLEDGMENT The authors would like to thank Prof. J. Udupa for useful discussions and ideas. REFERENCES [1] G. Monin, “Recent methods for predicting quality of whole meat,” Meat Sci., vol. 49, no. Suppl. 1, pp. S231–S243, 1998.
199
[2] D. E. Gerrard, X. Gao, and J. Tan, “Beef marbling and color score determination by image processing,” J. Food Sci., vol. 61, no. 1, pp. 145–148, 1996. [3] J. Li, J. Tan, F. A. Martz, and H. Heymann, “Image texture features as indicator of beef tenderness,” Meat Sci., vol. 53, pp. 17–22, 1999. [4] K. Shiranita, T. Miyajima, and R. Takiyama, “Determination of meat quality by texture analysis,” Pattern Recognit. Lett., vol. 19, pp. 1319–1324, 1998. [5] K. Shiranita, K. Hayashi, A. Otsubo, T. Miyajima, and R. Takiyama, “Grading meat quality by image processing,” Pattern Recognit., vol. 33, pp. 97–104, 2000. [6] O. Basset, B. Buquet, S. Abouelkaram, G. Gimenez, and J. Culioli, “Photographic image analysis for the classification of bovine meat,” in New Developments, in Guaranteeing the Optimal Sensory Quality of Meat, Toldrà and Troy, Eds. Madrid, Spain, 1999. [7] Proc. 5th Int. Conf. Applications of Magnetic Resonance in Food Science, Aveiro, Portugal, 2000. [8] R. Geers, C. Decanniere, H. Villé, P. Van Hecke, and L. Boss-Chaerts, “Variability within intramuscular fat content of pigs as measured by gravimetry, FTIR and NMR spectroscopy,” Meat Sci., vol. 40, pp. 373–378, 1995. [9] M. A. Foster, P. A. Fowler, G. Cameron, M. Fuller, and C. H. Knight, “NMR imaging studies of live animals,” in Application of NMR Techniques on the Body Composition of Live Animals, E. Kallweit, Ed., 1989, pp. 107–120. [10] J. M. Bonny, W. Laurent, and J. P. Renou, “Characterization of meat structure by NMR imaging at high field,” in Proc. 5th Int. Conf. Applications of Magnetic Resonance in Food Science, Aveiro, Portugal, 2000. [11] W. Laurent, S. Abouelkaram, J. Culioli, J. M. Bonny, and J. P. Renou, “Imaging of meat structure by ultrasonic and magnetic resonance,” in Proc. 46th Int. Conf. Meat Science and Technology, Buenos Aires, Argentina, 2000. [12] J. Tritt-Goc et al., “Proton magnetic resonance microimaging of human trabecular bone,” Solid State Nucl. Magn. Reson., vol. 15, no. 2, pp. 91–98, 1998. [13] D. Ballard and C. Brown, Computer Vision. Englewood Cliffs, NJ: Prentice-Hall, 1982. [14] B. H. Brinkmann, A. Manduca, and R. A. Robb, “Optimized homomorphic unsharp masking for MR grayscale inhomogeneity correction,” IEEE Trans. Med. Imaging, vol. 17, no. 2, pp. 161–171, Apr. 1998. [15] B. M. Dawant, A. P. Zijdenbos, and R. A. Margolin, “Correction of intensity variation in MR images for computer-aided tissue classification,” IEEE Trans. Med. Imaging, vol. 12, no. 4, pp. 770–781, Dec. 1993. [16] J. G. Sled, A. P. Zijdenbos, and A. C. Evans, “A nonparametric method for automatic correction of intensity nonuniformity in MRI data,” IEEE Trans. Med. Imaging, vol. 17, pp. 87–97, Feb. 1998. [17] K. R. Castleman, Digital Image Processing. Englewood Cliffs, NJ: Prentice-Hall, 1996. [18] R. Klette and P. Zamperoni, Handbook of Image Processing Operators. London, U.K.: Wiley, 1996. [19] V. V. Lashin, “Local histogram processor: Implementation of local histogram algorithms for image processing,” Centre for Image Analysis, Uppsala, Sweden, Tech. Rep. 8, 1992. [20] V. Kim and L. Yaroslavsky, “Rank algorithms for picture processing,” Comput. Vision, Graph., Image Processing, vol. 35, pp. 234–258, 1986. [21] L. P. Yaroslavsky, “Linear and rank adaptive filters for picture processing,” in Digital Image Processing and Computer Graphics, E. Wenger and L. Dimitrov, Eds., Oldenbourg, 1991. [22] P. K. Saha and J. K. Udupa, “A new optimum thresholding method using region homogeneity and class uncertainty,” in Medical Imaging 2000: Image Processing, vol. 3979, J. K. Loew, Ed., San Diego, CA, 2000. Proc. SPIE. [23] L. Ballerini, “A simple method to measure homogeneity of fat distribution in meat,” in Proc. 12th Scandinavian Conf. Image Analysis, Bergen, Norway, June 2001. [24] L. Ballerini, A. Högberg, K. Lundström, and G. Borgefors, “Color image analysis technique for measuring of fat in meat: An application for the meat industry,” in Machine Vision Applications in Industrial Inspection IX, San Jose, CA, 2001. vol. 4301 of Proc. SPIE Electronic Imaging.