Basic Research Paper
Autophagy 9:6, 894–904; June 2013; © 2013 Landes Bioscience
A sensitive and quantitative autolysosome probe for detecting autophagic activity in live and prestained fixed cells Juan-Juan Chen,1 Jing Jing,1 Hao Chang,2 Yueguang Rong,3 Yang Hai,1 Juan Tang,1 Jun-Long Zhang1,* and Pingyong Xu2,* Beijing National Laboratory for Molecular Sciences; State Key Laboratory of Rare Earth Materials Chemistry and Applications; College of Chemistry and Molecular Engineering; Peking University; Beijing, China; 2Key Laboratory of Interdisciplinary Research; Institute of Biophysics; Chinese Academy of Sciences; Beijing, China; 3 State Key Laboratory of Biomembrane and Membrane Biotechnology; School of Life Science; Tsinghua University; Beijing, China
Keywords: autophagy, autolysosome, ZnSalen, optical imaging, probe Abbreviations: GFP, green fluorescent protein; EGFP, enhanced green fluorescent protein; CFP, cyan fluorescent protein; LC3, microtubule-associated protein 1 light chain 3; LAMP2, lysosomal-associated membrane protein 2; FYVE, four cysteinerich proteins of Fab1, YOTB, Vac1 and EEA1; EHD1, EH-domain containing protein 1; EEA1, early endosome antigen 1; TFR, transferrin receptor; ATG, autophagy-related; 3-MA, 3-methyladenine; DMSO, dimethyl sulfoxide; 2PFM, two-photon fluorescence microscopy; NIR, near infrared
Autophagy is a complex, multi-step and biologically important pathway mediated by autophagosomes and autolysosomes. Accurately dissecting and detecting different stages of autophagy is important to elucidate its molecular mechanism and thereby facilitate the discovery of pharmaceutical molecules. We herein reported a small-molecule synthetic probe, Zn-G4, which is only fluorescent upon starvation- or chemical agent-induced autophagy within the autolysosome or possible the late endosome/lysosome networks. The probe can be detected by one-photon microscopy, which gives a high signal-to-noise ratio readout of autophagic activity. The pH gradient-independent fluorescence can be detected both in live and prestained fixed cells. Moreover, the fluorescent recording can be used to quantify autophagic activity at a single point without transfection or false positive signals due to protein aggregation. Furthermore, autophagy-induced fluorescence in autolysosomes can also be detected by two-photon microscopy, suggesting potential applications in deep tissue and in vivo. In conclusion, we have developed a sensitive and specific autolysosomal probe that can be used for monitoring autophagy during later stages along with quantitative assays together with widely used early markers or microtubule-associated protein 1 light chain 3 (LC3)-based probes.
Introduction Macroautophagy, often referred to as autophagy, is the major lysosomal degradative pathway in mammalian cells.1,2 It is an important biological process involved in maintaining cellular homeostasis, development and energy balance.3,4 A disruption of the autophagy pathway is closely linked to a broad spectrum of mammalian diseases such as neurodegenerative disorders, cancer, heart disease and infectious diseases.5-8 Upon the induction of autophagy, the phagophores (also sometimes termed isolation membranes) elongate and subsequently enclose a portion of cytoplasm (protein aggregates and organelles) to form doublemembrane structures called autophagosomes. Consequently, the outer membranes of the autophagosomes fuse with endosomes or lysosomes to generate autolysosomes, leading to the degradation of the enclosed materials and the inner autophagosomal membrane.2,9 Therefore, autophagy is a complex, multistep and dynamic process. To elucidate its molecular mechanisms and
further regulate the biological process, there is a rapidly growing need to develop effective methods for detecting the different stages of the autophagic pathway.9,10 A widely used fluorescent probe for the detection of early autophagy is GFP-LC3, a fusion of the autophagosome marker LC3 (microtubule-associated protein 1 light chain 3) and GFP (green fluorescent protein).9,11 Upon starvation, a diffuse cytoplasmic pool of GFP-LC3 fluorescence forms punctate or ring-shaped structures. After fusion with lysosomes to generate autolysosomes, LC3 content becomes very low as the result of LC3 cleavage on the outer membrane by autophagy-related 4 (ATG4) and LC3 degradation on the inner membrane by lysosomal enzymes.9 Moreover, GFP fluorescence in autolysosomes is attenuated due to degradation and acid quenching.12 Thus, GFP-LC3 is a good marker of early autophagic events, but it is unable to detect autophagy at later stages or over long time intervals. To circumvent this problem, Kimura et al., have used monomeric red fluorescent protein (mRFP), which is resistant to both acidic conditions
*Correspondence to: Jun-Long Zhang or Pingyong Xu; Email:
[email protected] or
[email protected] Submitted: 08/08/12; Revised: 03/03/13; Accepted: 03/08/13 http://dx.doi.org/10.4161/auto.24241 894
Autophagy
Volume 9 Issue 6
©2013 Landes Bioscience. Do not distribute.
1
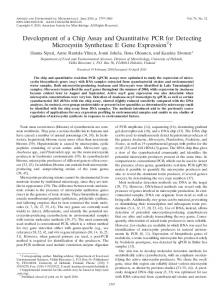
Figure 1. Photophysical properties of Zn-G4 in DMSO or in mixed solvents (H2O% in DMSO, 0 to 100%). (A) Normalized absorption spectrum (black line), steady-state, one-photon excitation, fluorescence emission (red line) and two-photon excitation fluorescence emission spectrum (blue line) in DMSO. (B) Absorption spectra in the mixed solvents. (C) The relative emission spectra in the mixed solvents. (D) Plot of the relative fluorescence intensity vs. water percentage in the mixed solvents.
and lysosomal proteases, and have fused it with GFP-LC3 to investigate the dynamics of the conversion of autophagosomes to autolysomes.12 However, LC3-based probes have been reported to aggregate easily if overexpressed or coexpressed with other proteins prone to aggregation, thereby giving false-positive results.13 To monitor the later stages of autophagic events, several pHdependent fluorescent proteins have been developed to detect autolysosomes. Rosella, a fusion of a fast-maturing, pH-stable red fluorescent protein, DsRed.T3, and a pH-sensitive green fluorescent protein variant, pHluorin, has been developed to report the delivery of cellular compartments to autolysosomes for degradation.14 However, intramolecular fluorescence resonance transfer, proteolytic cleavage and maturation rates can interfere with its red and green fluorescence intensities. Keima, a coral-derived, acid-stable fluorescent protein, which can exhibit different colored fluorescence at acidic and neutral pH, has been designed to monitor the maturation of autolysosomes by dualexcitation ratiometric imaging.15 However, its different excitation wavelengths and dual color emission are not convenient to monitor autophagosomes and other organelles simultaneously. Furthermore, optimization is required for high transfection efficiency, especially in primary cells and in cells that are difficult to transfect. Moreover, these probes are dependent on the pH gradient between the cytoplasm and autolysosomes, so they can be only used in live cells but not fixed or in other conditions that disturb the pH gradient.14,15 In this study, we reported a highly fluorescent probe, Zn-G4, for detecting the later stages of autophagy. It stably accumulates within autolysosomes and is only fluorescent upon autophagy induction. The fluorescence is independent of the low pH in autolysosomes, which provides a high signal-to-noise ratio readout of autophagic activity in both live cells and “Zn-G4prestained” fixed cells. As a small-molecule fluorophore, Zn-G4 does not require transfection and can be easily used for primary cells and cells that are difficult to transfect, minimizing the false positive signals resulting from the aggregation of fluorescent protein probes. Moreover, it can detect autophagic activity by two-photon fluorescence microscopy (2PFM) using NIR (nearinfrared) or longer wavelength excitation, which could increase penetration depth for in vivo studies.
Results Synthesis, characterization and photophysical properties of Zn-G4. The use of luminescent transition metal complexes as biological probes has attracted increased attention for their photostability, large Stokes shift and long lifetime, among other reasons.16,17 We have recently reported that ZnSalens exhibit high fluorescence with nonlinear optical properties, which renders a platform for one- and two-photon fluorescent probes suitable for NIR excitation.18-20 To increase the water-solubility of ZnSalen, we chose D-glucose as a neutral hydrophilic conjugate. In this work, ZnSalen conjugated with four glucose molecules, referred to as Zn-G4, was synthesized and well characterized by 1H-NMR, IR, HR-MS and UV-vis spectrometries and spectroscopies (supporting information). As shown in Figure 1A, Zn-G4 shows intense absorption at approximately 382, 408 and 588 nm, and emission with λmax at 626 nm in DMSO (ex = 588 nm for one-photon excitation, 840 nm for two-photon excitation). Photophysical data such as fluorescence quantum yields (0.31) and two-photon absorption cross-sections (547 GM) are summarized in Table S1 and Figure S1. These results suggest that the glycosylation of ZnSalen does not result in significant changes to the photophysical properties of ZnSalens. In aqueous media (DMSO/H2O, v/v = 1:99), Zn-G4 displays absorption bands blue shifted 11 and 24 nm compared with its absorption in DMSO (Fig. 1B). The emission of Zn-G4 exhibits a distinguishable linear fluorescence decrease along with the ratio of H2O/DMSO, increasing from 0 to 100% (v/v) (Fig. 1C and D), indicating that Zn-G4 disperses in water with good water solubility but with low fluorescence intensity. The Zn-G4 fluorescence signal selectively depends on autophagy induced by starvation. To take advantage of its specific photophysical properties and to determine its potential applications in biological processes, we first studied the behavior of Zn-G4 in mammalian cells. In HEK293 (human embryonic kidney 293) cells, we found no fluorescence of Zn-G4 in complete medium for 20 h, whereas bright red fluorescence was observed in serum-free medium. We assumed that the difference may be related to the starvation stimulus and to starvation-induced
www.landesbioscience.com Autophagy
895
©2013 Landes Bioscience. Do not distribute.
Basic Research Paper
Basic Research Paper
“switching on” of intracellular Zn-G4 fluorescence is selectively dependent on autophagy induced by starvation. Zn-G4 selectively and quantitatively detects autophagy modulated by chemical agents. In addition to starvation, strong autophagy inducers such as Torin 1,24,25 autophagy enhancer ZnCl2,26 and autophagy inhibitors 3-methyladenine (3-MA)27 were applied to L6 myoblasts. As shown in Figure 3A, fluorescent puncta of EGFP-LC3 and a significant induction of Zn-G4 fluorescence were observed in L6 myoblasts treated with Torin 1 or ZnCl2. Upon treatment with 3-MA, a phosphoinositide/ phosphatidylinositol 3-kinase inhibitor, EGFP-LC3 became diffuse, and the number of LC3 (+) vacuoles decreased (45%, p ≤ 0.01, Fig. 3A). As expected, this induction of Zn-G4 fluorescence could be 90% quenched (Fig. 3A) and showed a statistically significant difference compared with the ZnCl2 group (p ≤ 0.001) but not compared with the vehicle group (p > 0.05). Interestingly, we found that some structures stained by Zn-G4 appeared to be large and may represent protein aggregates. To address this possibility, puromycin, which can increase the production of truncated and misfolded proteins,28 was used to determine whether the observed Zn-G4 structures included protein aggregates. A short-term treatment with puromycin (2 h) resulted in positive puncta for Zn-G4 in WT MEF cells (Fig. S3A). However, upon the puromycin treatment of atg7−/− MEF cells, no Zn-G4 positive puncta were observed, indicating that Zn-G4 is specific for the induction of autophagy and the Zn-G4 fluorescence is not resulted from simple protein aggregation. Although it was reported that ZnCl2 accumulated in most acidic LC3 + autophagic vacuoles and may play a role in autophagy,26,29 the relationship between Zn2+ ions and autophagy has not been investigated in detail. In this work, we performed western blots for LC3 protein using chloroquine and bafilomycin A1, which are lysosomotropic reagents that inhibit acidification inside the lysosome or inhibit autophagosome-lysosome fusion.9 As shown in Figure S3B, the ratio of LC3-II/β-actin under normal conditions was increased after addition of ZnCl2 alone. Moreover, when the turnover of LC3-II was blocked by chloroquine, the level of LC3-II/β-actin was markedly increased by addition of ZnCl2 compared with that treated with chloroquine alone. Thus, under our experiment conditions, ZnCl2 is capable of activating autophagy. Western blots results stimulated us to apply Zn-G4 as a quantitative probe for detecting autophagic activity. Western blots were performed with an LC3 antibody and the results correlated with the fluorescence of Zn-G4 at different concentrations of ZnCl2. As shown in Figure 3B, the intracellular fluorescence intensity of Zn-G4 was increased along with the concentration of ZnCl2, which ranged from 0 to 25 μM, and reached a plateau at 25 to 50 μM. Although the
Figure 2 (See opposite page). The Zn-G4 fluorescence signal specifically depends on autophagy induced by starvation. (A) Confocal images of HEK293 cells or L6 myoblasts transfected with the EGFP-LC3 plasmid or incubated with Zn-G4 in complete media (control group), in serum-free medium (serum starvation group), or in EBSS (amino acid starvation group). Scale bar: 10 μm. (B) Relative changes in the number of EGFP-LC3+ AVs in cells from the control, serum starvation, and amino acid starvation groups (mean ± SEM; paired t-test, *p ≤ 0.01, #p > 0.05, n = 20–30). (C) Relative intracellular fluorescence intensity of Zn-G4 in cells from the control, serum starvation, and amino acid starvation groups (mean ± SEM; paired t-test, **p ≤ 0.001, #p > 0.05, n = 30–50). (D) Confocal images and relative fluorescence intensity of WT and atg7−/− MEF cells incubated with Zn-G4 in complete medium (control group), in serum-free medium (serum starvation group), or in EBSS (amino acid starvation group) (mean ± SEM; paired t-test, **p ≤ 0.001, #p > 0.05, n = 30–50). Scale bar: 10 μm. 896
Autophagy
Volume 9 Issue 6
©2013 Landes Bioscience. Do not distribute.
autophagy. To confirm this hypothesis, the well-known autophagy marker, EGFP (enhanced green fluorescent protein)-LC3 was used to determine the correlation between Zn-G4 fluorescence and EGFP-LC3 puncta formation. Under basal conditions, few EGFP-LC3 puncta were found; and accordingly, very low levels of Zn-G4 fluorescence could be observed (Fig. 2A). However, upon the stimulation of serum starvation, HEK293 cells displayed many EGFP-LC3 puncta accompanied by the obviously increased fluorescence of Zn-G4 (Fig. 2A–C). Then we examined the correlation in another cell line, L6 myoblasts. However, we found few EGFP-LC3 puncta and extremely low Zn-G4 fluorescence in L6 myoblasts that were untreated or longtime serum starved (Fig. 2A–C). The insensitivity to serum starvation in L6 myoblasts was further confirmed by western blot shown in Figure 3. Interestingly, under harsher amino acid starvation in L6 myoblasts, we observed increased EGFP-LC3 puncta and the enhanced fluorescence of Zn-G4 (10-fold) (Fig. 2A–C). Additionally, when glucose was deprived from the medium, a greater enhancement of Zn-G4 fluorescence (26 fold) was observed (Fig. S2A). Furthermore, to examine the generality of Zn-G4 in detecting starvation-induced autophagy, we examined commonly used cell lines in autophagy studies, such as HeLa and MEF (mouse embryonic fibroblasts) cells. As shown in Figure 2D and Figure S2C, starvation-induced Zn-G4 fluorescence enhancement can also be obtained in HeLa and MEF cells under autophagy-inducible conditions such as amino acid starvation and serum starvation. These results strongly suggest a good correlation between Zn-G4 fluorescence and EGFP-LC3 puncta formation, and the fluorescence of Zn-G4 can be “switched on” by starvation-induced autophagy. To further demonstrate that the fluorescence of Zn-G4 is specifically dependent on autophagy, we used atg7- and atg5-deficient MEF cells (atg7−/− and atg5−/− MEF cells) to demonstrate that the starvation-induced increase of Zn-G4 fluorescence is indeed caused by autophagy activation. As we know, autophagyrelated (Atg) genes 5 and 7 are essential for autophagy processes, and their knockdown would greatly reduce autophagy.9,21,22 As shown in Figure 2D, upon amino acid and serum starvation, a greatly increased fluorescence intensity (10 to 11-fold) of Zn-G4 was observed in WT MEF cells, whereas significantly decreased fluorescence (ca. 70% quenched) was observed in atg7−/− MEF cells. Similar fluorescence reduction (ca. 70% quenched) was observed in atg5−/− MEF cells under serum starvation conditions (Fig. S2B). There remained a 3- to 4-fold increase in Zn-G4 fluorescence in atg7−/− and atg5−/− MEF cells compared with the untreated group, which was consistent with a previous report and may be related to a new form of autophagy that is independent of Atg5 and/or Atg7.23 Thus, these results clearly indicated that the
©2013 Landes Bioscience. Do not distribute. Figure 2. For figure legend, see page 896.
www.landesbioscience.com Autophagy
897
fold increase of LC3-II/β-actin is much lower compared with that of Zn-G4 fluorescence, which may be because of the semiquantitative measurement and lower sensitivity of western blots, a similar trend can be found by plotting the ratio of LC3-II/βactin and the intracellular fluorescence intensity of Zn-G4 vs. ZnCl2 concentration. Moreover, when bafilomycin A1 was used to block the autophagy flux, the addition of ZnCl2 increased the level of bafilomycin A1-induced LC3-II in a dose-dependent way, which further supported the real activation of autophagy by ZnCl2 (Fig. 3B). Through this quantitative study, we found that Zn-G4 would be a powerful and convenient quantitative probe for selectively detecting autophagic activity. Zn-G4 application in high-throughput screening and twophoton detection. To demonstrate the potential application of Zn-G4 assay, we applied Zn-G4 assay in high-throughput screening 898
for autophagy inducers. It has been reported that Mn2+ and Co2+ may interfere with MTOR (mammalian target of rapamycin) activity in PC3 and yeast cells when used in much higher concentrations.30,31 However, their further effects on autophagy have not been elucidated. We chose seven biologically available metal ions (Co2+, Mn2+, Mg2+, Cu2+, Ca 2+, Ni2+ and Hg2+) and five rare earth metal ions (Tb3+, Gd3+, Er3+, and La 3+) to establish a platform to perform high-throughput screening experiments. The confocal microscopy images in Figure 4A show that Zn-G4 exhibited strong intracellular fluorescence only in the presence of Co2+ or Mn2+. An analysis of the relative intracellular fluorescence intensity of Zn-G4 in L6 myoblasts treated with Co2+ or Mn2+ ions showed a statistically significant enhancement in fluorescence (8- to 11-fold higher than in the absence of metal ions). These results suggested that Zn-G4 assay could convenient to perform
Autophagy
Volume 9 Issue 6
©2013 Landes Bioscience. Do not distribute.
Figure 3. The Zn-G4 fluorescence signal specifically depends on autophagy. (A) Left panel: Confocal images of L6 myoblasts transfected with the EGFP-LC3 plasmid or incubated in complete medium, with Torin 1 in complete medium, with Zn2+ in serum-free medium or with Zn2+ and 3-MA in serum-free medium in presence of Zn-G4 (scale bar: 10 μm); Right panel: Relative changes in the number of EGFP-LC3+ AVs and relative intracellular fluorescence intensity of Zn-G4 in cells after the above treatment (mean ± SEM; paired t-test, *p ≤ 0.01, **p ≤ 0.001, #p > 0.05, n = 25 to 50). (B) Left panel: confocal images of L6 myoblasts incubated with 2 μM Zn-G4 and immunoblotting with LC3 antibodies in the presence of 0 or 100 nM bafilomycin A1 and different concentrations of ZnCl2 (0 to 50 μM) (scale bar: 10 μm); Right panel: comparison of the ratio of LC3-II and β-actin analyzed from immunoblotting (normalized to control group, mean ± SEM, n = 3) and the relative fluorescence intensity of Zn-G4 as analyzed from confocal images in response to various ZnCl2 concentrations. (green solid, ZnCl2 only; green dash, ZnCl2 plus bafilomycin A1; red, fluorescence intensity of Zn-G4).
by noninvasive fluorescence detection and would therefore be suitable for high-throughput, high-content applications. As mentioned above, the two-photon absorption cross-section of Zn-G4 is as large as 507 GM, which may make it a suitable two-photon probe for the detection of autophagy. To demonstrate this possibility, we excited Zn-G4 under a pulsed 840 nm laser to detect Zn2+ -induced autophagy in L6 myoblasts. Twophoton fluorescence microscopy images and the merged images confirm that the fluorescence of Zn-G4 is present within the cells after Zn2+ -induced autophagy (Fig. 4B, right panels). However, the control cells only display negligible intracellular fluorescence (Fig. 4B, left panels). These results are in accordance with those obtained by one-photon fluorescence microscopy (Fig. 3). Therefore, Zn-G4 can be applied to study autophagy by 2PFM, allowing NIR or longer wavelength excitation to increase the
penetration depth and minimize the background for further applications in tissue imaging. Zn-G4 serves as a late autophagy marker that specifically labels autolysosomes independent of pH. To determine during which stage of the autophagy pathway Zn-G4 can be detected, we characterized the Zn-G4-labeled punctate structures in colocalization studies. As shown in Figure 5A, we observed good colocalization of Zn-G4 with LysoTracker Green (acid vacuoles) and EGFP-LAMP2 (lysosomes, late endosome or autolysosomes), partial colocalization with EGFP-LC3 (autophogosomes) but no colocalization with EGFP-FYVE (early endosomes), EGFPEHD1 and EGFP-RAB11 (recycling endosomes), EGFP-ER (endoplasmic reticulum), EGFP-Golgi (Golgi apparatus) or MitoTracker Green FM (mitochondria) in L6 myoblasts. To more precisely characterize the localization of Zn-G4, normal rat kidney
www.landesbioscience.com Autophagy
899
©2013 Landes Bioscience. Do not distribute.
Figure 4. The application experiments of Zn-G4 for different ions screening and two-photon imaging. (A) Left panel: confocal microscopy images of the metal ion screening experiments (scale bar: 10 μm); Right panel: the relative intracellular fluorescence intensity of L6 myoblasts treated with 2 μM ZnG4 in the presence of 50 μM metal salts (1) no metal ion, (2) CoCl2, (3) MnCl2, (4) MgCl2, (5) CuCl2, (6) CaCl2, (7) NiCl2, (8) HgCl2, (9) TbCl3, (10) GdCl3, (11) ErCl3, (12) LaCl3. (mean ± SEM; n = 30–50). (B) Two-photon images of L6 myoblasts treated with 2 μM Zn-G4 with 0 (vehicle group) or 50 μM ZnCl2 (ZnCl2 group) in serum-free media for 20 h. (a) Two photon image of Zn-G4; (b) images of (a) merged with DIC (differential interference contrast). Scale bar: 10 μm.
Discussion Autophagy plays a role in the degradation of a wide range of cellular components, including long-lived proteins, protein aggregates, lipids, organelles and even intracellular pathogens. During autophagy, autophagosomes engulf portions of the cytoplasm for delivery to lysosomes to form autolysosomes. In this study, we developed a highly fluorescent probe, Zn-G4 that can stably accumulate within autolysosomes. Its fluorescence intensity is selectively dependent on autophagy with a high signal-to-noise ratio. More importantly, the probe can be used to quantify autophagic activity and can potentially be applied in high-throughput screening. Most importantly, Zn-G4 can be used as a two-photon fluorescence probe to monitor autophagy using NIR or longer wavelength excitation, which could increase the penetration depth for in vivo studies. Therefore, Zn-G4 is a useful autophagic imaging probe and can be used in a complementary manner to examine the entirety of autophagic events with LC3-based probes or pH-dependent autophagy probes.
Results from Zn-G4 prestained fixed cells show that the fluorescence intensity of Zn-G4 is independent of pH, suggesting that the mechanism of Zn-G4 fluorescence induction is unlike that of pH-dependent autophagy probes such as Keima and Rosella. As shown in Figure 1, the fluorescence intensity of Zn-G4 is quenched in aqueous solution and shows a linear relationship with the water percentage. Therefore, we propose that other hydrophobic components in autolysosomes such as lipids and proteins may provide a polar environment and play a role in the induction of Zn-G4 fluorescence during autophagy. Previous reports have shown that autophagic vacuoles are characterized by a high content of lipids originating from membrane material, regularly filling the internal space of these vacuoles as myelinlike whirls.32 Upon autophagy induction, the amount of lipids detected is increased until it becomes the predominant component in autophagic vacuoles.33,34 This observation raises the question of why Zn-G4 selectively stains autolysosomes but not the plasma membrane or other organelles. One possible explanation could be the higher concentration of lipids or membrane materials in autolysosomes than in other organelles. In autolysosomes, membrane material might be concentrated in a small volume, and the intensity of Zn-G4 fluorescence is thereby sufficiently increased for imaging by confocal microscopy. However, in other organelles or autophagosomes, the decreased concentration of membrane material cannot increase the fluorescence intensity of Zn-G4 above the threshold of fluorescent microscopic sensitivity. Another possible explanation could be the presence of autolysosome-specific hydrophobic lipids or proteins with a high affinity for Zn-G4. The partial colocalization of Zn-G4 and LipidTOX Green, which stains lipids droplets (Pearson’s coefficient: 0.64 ± 0.08) (Fig. S5) suggests that lipids may play a role on the “switching on” of Zn-G4 during autophagy activation. However, hydrophobic proteins might also contribute to the fluorescence of Zn-G4. Whether the specific “switching on” of Zn-G4 in autolysosomes upon autophagy depends only on the high content of lipids or on its selective interaction with lipid molecules or proteins unique to autolysosomes is under investigation. Materials and Methods Reagents, antibodies and plasmids. Commercially available chemical reagents, solvents, and silica gels were used without further purification. Metal chlorides were dissolved in ddH2O to make 50 mM stock solutions and were filter-sterilized with a 0.22 μm syringe filter. Torin 1 and 3-MA were dissolved in DMSO to make 1 mM and 100 mM stock solutions, respectively.
Figure 5 (See opposite page). Subcellular localization of Zn-G4. (A) Subcellular colocalization of Zn-G4 in L6 myoblasts with LysoTracker Green (acid vacuoles, Pearson’s coefficient: 0.79 ± 0.07), EGFP-LAMP2 (lysosomes or autolysosomes, Pearson’s coefficient: 0.74 ± 0.04), EGFP-LC3 (autophagosomes, Pearson’s coefficient: 0.53 ± 0.10), TFR-EGFP (early/recycling endosomes, Pearson’s coefficient: 0.38 ± 0.15), EGFP-EHD1 (recycling endosomes, Pearson’s coefficient: 0.43 ± 0.10), EGFP-RAB11 (recycling endosomes, Pearson’s coefficient: 0.27 ± 0.05), EGFP-FYVE (early endosomes, Pearson’s coefficient: 0.33 ± 0.01), MitoTracker Green FM (mitochondria, Pearson’s coefficient: 0.40 ± 0.06), EGFP-ER (endoplasmic reticulum, Pearson’s coefficient: 0.41 ± 0.10), and EGFP-Golgi (Golgi apparatus, Pearson’s coefficient: 0.22 ± 0.04). n = 10, scale bar: 10 μm. (B) Subcellular colocalization of Zn-G4 in NRK cells. NRK cells were transfected with CFP-LC3 and EGFP-LAMP2, then incubated with Zn-G4 in complete medium for 20 h before starvation in serum-free medium for 2 h. (a) Images of CFP-LC3; (b) images of EGFP-LAMP2; (c) Images of Zn-G4; (d) merged images of CFP-LC3 and EGFP-LAMP2 (Pearson’s coefficient: 0.55 ± 0.06); (e) merged images of EGFP-LAMP2 and Zn-G4 (Pearson’s coefficient: 0.68 ± 0.06); (f) merged images of CFP-LC3 and Zn-G4 (Pearson’s coefficient: 0.50 ± 0.06); (g) merged images of CFP-LC3, EGFP-LAMP2 and Zn-G4. (Inset) A close-up of autophagosomes (orange arrow) marked by CFP-LC3, and autolysosomes (pink arrow) marked by CFP-LC3 and EGFP-LAMP2. Zn-G4 accumulated in autolysosomes (n = 10, scale bar: 1 μm). 900
Autophagy
Volume 9 Issue 6
©2013 Landes Bioscience. Do not distribute.
(NRK) cells stably coexpressing CFP (cyan fluorescent protein)LC3 and EGFP-LAMP2 were used (Fig. 5B). After starvation, Zn-G4 localized within discrete ring-like structures marked by EGFP-LAMP2; these structures were also LC3-positive, which suggests that they were autolysosomes. However, CFP-LC3 was only partially colocalized with Zn-G4, indicating that Zn-G4 and CFP-LC3 do not accumulate in the same location within autolysosomes. Moreover, Zn-G4 did not colocalize with structures that were marked by CFP-LC3 but not by EGFP-LAMP2, which is a characteristic of autophagosomes (Fig. 5B). These results suggest that Zn-G4 can specifically label autolysosomes in the later stages of the autophagic pathway. However, because LysoTracker or LAMP2 are generally used as the late endosome and lysosome marker, we cannot exclude the possibility that Zn-G4 also labels the late endosome/lysosome network upon autophagy induction. To determine whether the pH gradient of autolysosomes affects the fluorescence and labeling of Zn-G4, we performed autophagy detection in “Zn-G4-prestained” cells and fixed cells, which abolish the pH gradient between the cytoplasm and autolysosomes. Unlike other pH-sensitive fluorescent probes for autolysosomes, Zn-G4 can also reveal punctate structures after paraformaldehyde fixation in “Zn-G4-prestained” cells. However, the fluorescence of Zn-G4 became diffused when Zn-G4 was added after the cells were fixed (Fig. S4). These results suggest that Zn-G4 can be used in Zn-G4-prestained fixed cells but cannot be used for staining of fixed cells.
©2013 Landes Bioscience. Do not distribute. Figure 5. For figure legend, see page 900
www.landesbioscience.com Autophagy
901
Φ(sample) = Φ(ref ) OD (ref )I(sample)n2 (sample)/OD (sample)I(ref )n2 (ref ) where Φ is the quantum yield, I is the integrated emission signal, OD is the optical density at the excitation wavelength, and n is the refractive index of pure solvent; subscript ‘ref’ stands for the reference sample, which was Rhodamine B in ethanol (Φ(ref ) = 0.65),38 ‘sample’ stands for the samples. The two-photon absorption spectra of the probes were determined over a broad spectral region by the typical two-photoninduced fluorescence (2PF) method relative to Rhodamine B in ethanol as the standard.39 The two-photon fluorescence data were acquired using a Tsunami femtosecond Ti: Sapphire laser (pulse width ≤ 100 fs, 80 M Hz repetition rate, tuning range 800 to 870 nm, Spectra Physics Inc.). The quadratic dependence of the two-photon induced fluorescence intensity on the excitation power was verified for the excitation wavelength at 840 nm. The two-photon absorption cross-section of the probes was calculated at each wavelength according to Equation 2:39 δ(sample) = δ(ref ) Φ(ref ) C (ref )I(sample)n (sample) /Φ(sample) C (sample)I(ref )n (ref ) where I is the integrated fluorescence intensity, C is the concentration, n is the refractive index, and Φ is the quantum yield,
902
subscript ‘ref’ stands for reference samples and ‘sample’ stands for the samples. Cell culture and transfection. Normal embryonic kidney (HEK293) cells, human cervical carcinoma (HeLa) cells, normal rat kidney (NRK) cells, and autophagy-related 5 (ATG5)- and ATG7-deficient (from recessive homozygous atg5−/− and atg7−/− phenotypes) and wild-type (WT) mouse embryonic fibroblast (MEF) cell lines were cultured in Dulbecco’s modified Eagle medium (DMEM, Gibco, 31600-034) supplemented with 10% fetal bovine serum (FBS), 100 μg/mL penicillin and 100 U/mL streptomycin. Rat L6 myoblasts were cultured in α-modified minimum essential medium (αMEM, Gibco, 11900-024) supplemented with 10% fetal bovine serum (FBS), 100 μg/mL penicillin and 100 U/mL streptomycin. All cells were grown at 37°C in a humidified atmosphere containing 5% CO2. Cells were transiently transfected with plasmids using LipofectamineTM 2000 (Invitrogen, 11668-019) in accordance with the manufacturer’s protocol. After transfection, cells were grown in complete media for 24 h. Autophagy activation and inhibition experiments. Cells were plated on sterile glass coverslips in cell culture dishes, six-well plates or PeCon open chambers containing complete media and allowed to grow to approximately 70% confluence. For starvation induction experiments, three starvation protocols were used. Protocol 1 was amino acid starvation: cells were washed with PBS 3 times, the media was aspirated, and Earle’s Balanced Salt Solution (Gibco, 14155) was added followed by 1 h incubation. Protocol 2 was serum starvation: cells were washed in serum-free medium for 2 h, the media was aspirated, and fresh serum-free medium was added followed by 20 h incubation. Protocol 3 was glucose deprivation: cells were washed with PBS 3 times, the media was aspirated, and glucose-free DMEM (Gibco, 11966025) was added followed by 20 h incubation. For experiments using the autophagy inducer Torin 1, cells were incubated with 250 nM Torin 1 in complete medium for 4 h before imaging. For ZnCl2 quantitative or high-throughput screening experiments in L6 myoblasts, cells were washed in serum-free medium for 2 h and then the media was aspirated, and 0 to 50 μM ZnCl2 or 50 μM metal chlorides in fresh serum-free medium was added followed by 20 h incubation. For 3-MA inhibition experiments, cells were washed in serum-free medium for 2 h, the media aspirated and 50 μM ZnCl2 and 2.5 mM 3-MA in fresh serum-free medium was added followed by 20 h incubation. For Zn-G4 imaging, the probes were simultaneously incubated within the cells. Confocal microscopy. Confocal fluorescent microscopy of living cells was performed using an FV500 scanning laser inverted microscope (Olympus, Tokyo, Japan) at 37°C. Before imaging, cells were washed with PBS (8 g/L NaCl, 0.2 g/L KCl, 1.44 g/L Na 2HPO4, 0.24 g/L KH2PO4, pH 7.4) 3 to 5 times. The coverslips were overlaid with PBS and examined. The settings for confocal microscopy were as follows: 60× oil immersion objective with 512 × 512 resolution, 543 nm laser excitation and a > 560 nm detector slit to detect Zn-G4, 488 nm laser excitation and 520 to 560 nm detector slit to detect EGFP or Green Tracker. Differential interference contrast (DIC), fluorescent images, the number of EGFP-LC3-positive puncta and the protein level were
Autophagy
Volume 9 Issue 6
©2013 Landes Bioscience. Do not distribute.
Chloroquine and bafilomycin A1 were dissolved in ddH2O to make 50 mM and 100 μM stock solutions, respectively. All chemicals were from Sigma unless indicated otherwise. Zn-G4 was dissolved in DMSO to make a 2 mM stock solution. LysoTracker Green and MitoTracker Green FM were from Invitrogen (L7526 and M7514). The cDNA coding for EGFP was cloned into pDsRed-ER and pDsRed-Golgi (Clontech, 632409 and 632480) to replace DsRed and generate pEGFP-ER and pEGFP-Golgi. The plasmid pEGFPRAB11 and pTFR-EGFP tagged with EGFP at the N and C termini, respectively, were constructed as described before.35,36 The cDNAs coding for EHD1 and the FYVE domain of EEA1 were purchased from Addgene (36459 and 3609) and constructed with EGFP at their N terminus to generate pEGFP-EHD1 and pEGFPFYVE(EEA1). The plasmid pEGFP-LC3 was a gift from Dr. Junying Yuan at National Center for Drug Screening (Shanghai, China). The plasmids pCFP-LC3 and pEGFP-LAMP2 were gifts from Dr. Li Yu at School of Life Science, Tsinghua University (Beijing, China). Anti-LC3 antibody was from Cell Signaling or Novus Biologicals (2775 and NB100-2220) and horseradish peroxidase-conjugated secondary anti-rabbit antibodies was from Jackson ImmunoResearch (LK2001). Spectroscopic measurements. Solutions were prepared to absorb less than 0.1 AU to prevent reabsorption and selfquenching. The absorption and excitation/emission spectra were recorded using an Agilent 8453 UV/V spectrophotometer (Santa Clara, G1103A) and an Edinburgh Instruments FLS920 (Livingston), respectively. Extinction coefficients were obtained from the absorbance band vs. the concentration and path length of the quartz cuvette. Corrected emission spectra for quantum yield determination were recorded with nm bandwidth. The values of the fluorescence quantum yield, Φ (sample), were calculated according to Equation 1:37
References 1. Mizushima N, Komatsu M. Autophagy: renovation of cells and tissues. Cell 2011; 147:728-41; PMID:22078875; http://dx.doi.org/10.1016/j. cell.2011.10.026 2. Mizushima N. Autophagy: process and function. Genes Dev 2007; 21:2861-73; PMID:18006683; http:// dx.doi.org/10.1101/gad.1599207 3. Rabinowitz JD, White E. Autophagy and metabolism. Science 2010; 330:1344-8; PMID:21127245; http:// dx.doi.org/10.1126/science.1193497 4. Mizushima N, Levine B. Autophagy in mammalian development and differentiation. Nat Cell Biol 2010; 12:823-30; PMID:20811354; http://dx.doi. org/10.1038/ncb0910-823 5. Shintani T, Klionsky DJ. Autophagy in health and disease: a double-edged sword. Science 2004; 306:9905; PMID:15528435; http://dx.doi.org/10.1126/science.1099993 6. Mathew R, Karantza-Wadsworth V, White E. Role of autophagy in cancer. Nat Rev Cancer 2007; 7:961-7; PMID:17972889; http://dx.doi.org/10.1038/nrc2254 7. Levine B, Kroemer G. Autophagy in the pathogenesis of disease. Cell 2008; 132:27-42; PMID:18191218; http://dx.doi.org/10.1016/j.cell.2007.12.018 8. Mizushima N, Levine B, Cuervo AM, Klionsky DJ. Autophagy fights disease through cellular self-digestion. Nature 2008; 451:1069-75; PMID:18305538; http:// dx.doi.org/10.1038/nature06639 9. Mizushima N, Yoshimori T, Levine B. Methods in mammalian autophagy research. Cell 2010; 140:31326; PMID:20144757; http://dx.doi.org/10.1016/j. cell.2010.01.028
were horseradish peroxidase (HRP)-conjugated (1:5000), and the signal was detected by autoradiography using an enhanced chemiluminescence western blotting kit (Perkin Elmer, NEL 104001EA). Statistical analyses. Fluorescence intensity of Zn-G4, LC3 puncta numbers, protein levels and Pearson’s coefficient of colocalization were analyzed by ImageJ and expressed as the fold-change from three independent experiments performed in triplicate, and the error bars denote standard error of the mean but standard deviation for Pearson’s coefficient. p vales were determined by Student’s t-test using Microsoft Excel or t-test using SigmaPlot software. Disclosure of Potential Conflicts of Interest
No potential conflicts of interest were disclosed. Acknowledgments
We thank Dr. Li Yu for critical reading of the manuscript, helpful comments and for providing the plasmids (pCFP-LC3 and pEGFP-LAMP2) and cells (NRK cells, atg7−/− and atg5−/− MEF cells). We gratefully acknowledge support by the National Key Basic Research Support Foundation of China (NKBRSFC, grants 2010CB912302 and 2013CB910103), the National Scientific Foundation of China (grants 20971007 and 31170818), and the project from Chinese Academy of Sciences (KSCX2-EW-Q-11). Supplemental Materials
Supplemental materials may be found here: www.landesbioscience.com/journals/autophagy/article/24241
10. Baek K-H, Park J, Shin I. Autophagy-regulating small molecules and their therapeutic applications. Chem Soc Rev 2012; 41:3245-63; PMID:22293658; http:// dx.doi.org/10.1039/c2cs15328a 11. Kabeya Y, Mizushima N, Ueno T, Yamamoto A, Kirisako T, Noda T, et al. LC3, a mammalian homologue of yeast Apg8p, is localized in autophagosome membranes after processing. EMBO J 2000; 19:57208; PMID:11060023; http://dx.doi.org/10.1093/ emboj/19.21.5720 12. Kimura S, Noda T, Yoshimori T. Dissection of the autophagosome maturation process by a novel reporter protein, tandem fluorescent-tagged LC3. Autophagy 2007; 3:452-60; PMID:17534139 13. Kuma A, Matsui M, Mizushima N. LC3, an autophagosome marker, can be incorporated into protein aggregates independent of autophagy: caution in the interpretation of LC3 localization. Autophagy 2007; 3:323-8; PMID:17387262 14. Rosado CJ, Mijaljica D, Hatzinisiriou I, Prescott M, Devenish RJ. Rosella: a fluorescent pH-biosensor for reporting vacuolar turnover of cytosol and organelles in yeast. Autophagy 2008; 4:205-13; PMID:18094608 15. Katayama H, Kogure T, Mizushima N, Yoshimori T, Miyawaki A. A sensitive and quantitative technique for detecting autophagic events based on lysosomal delivery. Chem Biol 2011; 18:1042-52; PMID:21867919; http://dx.doi.org/10.1016/j.chembiol.2011.05.013 16. Koo C-K, So LKY, Wong K-L, Ho Y-M, Lam Y-W, Lam MHW, et al. A triphenylphosphonium-functionalised cyclometalated platinum(II) complex as a nucleolus-specific two-photon molecular dye. Chemistry 2010; 16:3942-50; PMID:20309966; http://dx.doi. org/10.1002/chem.200902919
17. Zhao Q, Huang C, Li F. Phosphorescent heavymetal complexes for bioimaging. Chem Soc Rev 2011; 40:2508-24; PMID:21253643; http://dx.doi. org/10.1039/c0cs00114g 18. Hai Y, Chen J-J, Zhao P, Lv H, Yu Y, Xu P, et al. Luminescent zinc salen complexes as single and twophoton fluorescence subcellular imaging probes. Chem Commun (Camb) 2011; 47:2435-7; PMID:21170447; http://dx.doi.org/10.1039/c0cc04113k 19. Cai Y-B, Zhan J, Hai Y, Zhang J-L. Molecular assembly directed by metal-aromatic interactions: control of the aggregation and photophysical properties of Zn-salen complexes by aromatic mercuration. Chemistry 2012; 18:4242-9; PMID:22378231; http://dx.doi. org/10.1002/chem.201103332 20. Jing J, Chen J-J, Hai Y, Zhan J, Xu P, Zhang J-L. Rational design of ZnSalen as a single and two photon activatable fluorophore in living cells. Chem Sci 2012; 3:3315-20; http://dx.doi.org/10.1039/c2sc20764h 21. Mizushima N, Yamamoto A, Hatano M, Kobayashi Y, Kabeya Y, Suzuki K, et al. Dissection of autophagosome formation using Apg5-deficient mouse embryonic stem cells. J Cell Biol 2001; 152:657-68; PMID:11266458; http://dx.doi.org/10.1083/jcb.152.4.657 22. Komatsu M, Waguri S, Ueno T, Iwata J, Murata S, Tanida I, et al. Impairment of starvation-induced and constitutive autophagy in Atg7-deficient mice. J Cell Biol 2005; 169:425-34; PMID:15866887; http:// dx.doi.org/10.1083/jcb.200412022 23. Nishida Y, Arakawa S, Fujitani K, Yamaguchi H, Mizuta T, Kanaseki T, et al. Discovery of Atg5/ Atg7-independent alternative macroautophagy. Nature 2009; 461:654-8; PMID:19794493; http://dx.doi. org/10.1038/nature08455
www.landesbioscience.com Autophagy
903
©2013 Landes Bioscience. Do not distribute.
processed and analyzed using Olympus FluoView 2.0a Viewer software or ImageJ (NIH). The intracellular fluorescence intensity of Zn-G4 was analyzed using ImageJ. First, the cell area was selected by using freeform selection tools, and then the intracellular fluorescence intensity of Zn-G4 was calculated by measuring the mean gray value of the selected area. All fluorescence intensity was normalized to that in controls. Two-photon microscopy imaging. Two-photon fluorescence microscopy (2PFM) images were collected on a modified Olympus Fluoview FV1000MPE microscope system equipped with a 60 × water immersion objective. The excitation light was provided by a mode-locked Ti: sapphire laser (Mai Tai, Spectra-Physics Inc.) tuned to 840 nm. The settings for confocal microscopy were as follows: 840 nm excitation wavelength and > 560 nm detector slit. Immunoblotting. Immunoblotting was performed as described.40 Briefly, for chloroquine and ZnCl 2 experiment, L6 myoblasts in six-well plates were treated with starvation as described above or 50 μM chloroquine with or without 50 μM ZnCl 2 or 50 μM ZnCl 2 alone in complete medium. For the experiments using bafilomycin A1 with different concentration ZnCl2 experiments, L6 myoblasts in six-well plates were washed in serum-free medium for 2 h and the media was aspirated, 0 to 50 μM ZnCl 2 with or without 100 nM bafilomycin A1 in fresh serum-free medium was added followed by 20 h incubation. Proteins from cell lysates were separated by SDS-PAGE, followed by western blotting with anti-LC3 antibody made in rabbit (1:1000) or anti-β-actin antibody made in mouse (1:2000). Secondary rabbit or mouse antibodies
904
30. Hudson CC, Liu M, Chiang GG, Otterness DM, Loomis DC, Kaper F, et al. Regulation of hypoxia-inducible factor 1α expression and function by the mammalian target of rapamycin. Mol Cell Biol 2002; 22:7004-14; PMID:12242281; http://dx.doi. org/10.1128/MCB.22.20.7004-7014.2002 31. Devasahayam G, Burke DJ, Sturgill TW. Golgi manganese transport is required for rapamycin signaling in Saccharomyces cerevisiae. Genetics 2007; 177:231-8; PMID:17603109; http://dx.doi.org/10.1534/genetics.107.073577 32. Papadopoulos T, Pfeifer U. Protein turnover and cellular autophagy in growing and growth-inhibited 3T3 cells. Exp Cell Res 1987; 171:110-21; PMID:3622627; http://dx.doi.org/10.1016/0014-4827(87)90255-2 33. Lajoie P, Guay G, Dennis JW, Nabi IR. The lipid composition of autophagic vacuoles regulates expression of multilamellar bodies. J Cell Sci 2005; 118:19912003; PMID:15840653; http://dx.doi.org/10.1242/ jcs.02324 34. Singh R, Kaushik S, Wang Y, Xiang Y, Novak I, Komatsu M, et al. Autophagy regulates lipid metabolism. Nature 2009; 458:1131-5; PMID:19339967; http://dx.doi.org/10.1038/nature07976 35. Chang H, Zhang M, Ji W, Chen J, Zhang Y, Liu B, et al. A unique series of reversibly switchable fluorescent proteins with beneficial properties for various applications. Proc Natl Acad Sci U S A 2012; 109:445560; PMID:22375034; http://dx.doi.org/10.1073/ pnas.1113770109
Autophagy
36. Chen Y, Wang Y, Zhang J, Deng Y, Jiang L, Song E, et al. Rab10 and myosin-Va mediate insulin-stimulated GLUT4 storage vesicle translocation in adipocytes. J Cell Biol 2012; 198:545-60; PMID:22908308; http:// dx.doi.org/10.1083/jcb.201111091 37. Crosby GA, Demas JN. Measurement of photoluminescence quantum yields. [Review]. J Phys Chem 1971; 75:991-1024; http://dx.doi.org/10.1021/j100678a001 38. Arbeloa IL, Rohatgi-Mukherjee KK. Solvent effects on the photophysics of the molecular forms of rhodamine B. Internal conversion mechanism. Chem Phys Lett 1986; 129:607-14; http://dx.doi.org/10.1016/00092614(86)80409-2 39. Xu C, Webb WW. Measurement of two-photon excitation cross sections of molecular fluorophores with data from 690 to 1050 nm. J Opt Soc Am B 1996; 13:48191; http://dx.doi.org/10.1364/JOSAB.13.000481 40. Korolchuk VI, Mansilla A, Menzies FM, Rubinsztein DC. Autophagy inhibition compromises degradation of ubiquitin-proteasome pathway substrates. Mol Cell 2009; 33:517-27; PMID:19250912; http://dx.doi. org/10.1016/j.molcel.2009.01.021
Volume 9 Issue 6
©2013 Landes Bioscience. Do not distribute.
24. Thoreen CC, Kang SA, Chang JW, Liu Q, Zhang J, Gao Y, et al. An ATP-competitive mammalian target of rapamycin inhibitor reveals rapamycin-resistant functions of mTORC1. J Biol Chem 2009; 284:802332; PMID:19150980; http://dx.doi.org/10.1074/jbc. M900301200 25. Fleming A, Noda T, Yoshimori T, Rubinsztein DC. Chemical modulators of autophagy as biological probes and potential therapeutics. Nat Chem Biol 2011; 7:9-17; PMID:21164513; http://dx.doi.org/10.1038/ nchembio.500 26. Hwang JJ, Kim HN, Kim J, Cho DH, Kim MJ, Kim YS, et al. Zinc(II) ion mediates tamoxifen-induced autophagy and cell death in MCF-7 breast cancer cell line. Biometals 2010; 23:997-1013; PMID:20524045; http://dx.doi.org/10.1007/s10534-010-9346-9 27. Seglen PO, Gordon PB. 3-Methyladenine: specific inhibitor of autophagic/lysosomal protein degradation in isolated rat hepatocytes. Proc Natl Acad Sci U S A 1982; 79:1889-92; PMID:6952238; http://dx.doi. org/10.1073/pnas.79.6.1889 28. Pankiv S, Clausen TH, Lamark T, Brech A, Bruun JA, Outzen H, et al. p62/SQSTM1 binds directly to Atg8/LC3 to facilitate degradation of ubiquitinated protein aggregates by autophagy. J Biol Chem 2007; 282:24131-45; PMID:17580304; http://dx.doi. org/10.1074/jbc.M702824200 29. Lee S-J, Koh J-Y. Roles of zinc and metallothionein-3 in oxidative stress-induced lysosomal dysfunction, cell death, and autophagy in neurons and astrocytes. Mol Brain 2010; 3:30-9; PMID:20974010; http://dx.doi. org/10.1186/1756-6606-3-30