A SIGNATURE TREE CONTENT-BASED IMAGE RETRIEVAL SYSTEM Konstantinos C. Athanasakos, Anastasios D. Doulamis and Nikitas N. Karanikolas Technological Educational Institute of Athens, Department of Informatics Ag. Spyridonos street, 122 10, Aigaleo, Athens, Greece
[email protected],
[email protected],
[email protected]
ABSTRACT This paper presents a new innovative Content-based Image Retrieval (CBIR) architecture for mining and searching image in large scale distributed volumes. The architecture exploits signature tree information and colour coherence. It also efficiently combines colour information with spatial information to improve the retrieval performance. Relevance feedback mechanisms are also incorporated in the proposed architecture. The platform has been developed using the Java language and it has been applied on a large scale multimedia volumes. Experimental results and objective evaluation using the precision-recall curve as being averaging over a large scale randomly selected image used as query demonstrate the robustness and efficiency of the proposed scheme. Keywords: CBIR, Content-Based Image Retrieval, Signature Trees, S-Trees, Colour-Spatial Features
1.
INTRODUCTION
The reality is that people in our days have to deal in a daily basis with a huge amount of information. And the remarkable part is that they only need a small percentage of that information. It is known that this overload occurs mostly when an individual is trying to satisfy a custom ‘information need’ of his own. That is why during the last 5 to 10 years a lot of effort has been put in developing systems and methods that will obtain a certain input from a user and after filtering all the superfluous information, they will point out the, most related to the user’s input, information they can retrieve. Having that said, while a lot of progress has been made when the desired information is text-based, very little has been made when trying to retrieve visual information. Nevertheless, several attempts have been made concerning this indeed complex task. Traditionally, the systems that were developed for that scope were at first based on some textual annotations of the existing images. Although such a system, depending on its inner structure, could have a great efficiency, it would also require a lot of continuous human effort when new images would have to be inserted to the system, because of the need to describe the
images and generally associate them with textbased information such as keywords, comments, etc. Furthermore, there is also the problem of inconsistency of keywords assigned between different indexers. However, with the rapid progress in capturing and encoding of visual information, the need to better organize, more compactly store and at last more efficiently search among visual data has increased tremendously. This explosion of visual information has emerged a series of applications in the field of entertainment, education, medicine and communication services. For all the reasons previously mentioned, an alternative mechanism has been recently proposed in the literature, which performs the retrieval of images based on their visual content (Content-Based Image Retrieval, CBIR). In this framework, the Moving Picture Expert Group (MPEG) has developed a multimedia content description interface, the MPEG-7 standard [1]. No doubt, the performance of a CBIR system depends on how efficiently the image visual content is represented. Efficient visual representation is achieved, apart from extracting appropriate descriptor values, through a proper organization of them. Such organization schemes aim at suppressing possible noise, existing in the descriptors, or at providing a
more physical interpretation of the visual information, which is closer to the human perception. Many CBIR systems have been recently implemented or proposed in the literature. In particular, the color histogram along with a texture descriptor, implemented using the Tamura's feature set, has been adopted in the QBIC system [2]. Extraction of color information by exploiting the human visual system is investigated in [3]. Similarly, color, texture and shape information is supported by the Photobook prototype [4], while the PicToSeek system combines color and shape invariant features to perform the image retrieval [5]. Other more complicated systems exploit local image characteristics by applying, for example, object segmentation and/or regions tracking algorithms [6]. Image content characterization using motion information has been presented in [7], [8] and [9] respectively. In particular in [7] the image events are characterized by modeling the motion information of objects, while in [8], a 3-D wavelet decomposition scheme has been adopted, appropriate for motion indexing. Finally, in [9], a motion segmentation and tracking algorithm is applied to extract moving objects from video sequences with application to image retrieval. Furthermore, an interest commercial prototype for for multimedia analysis and retrieval is the IBM created Marvel system [10]. Marvel consists of two components; the Multimedia Analysis Engine and the Search Engine. Other approaches have been concentrated on the development of search engines able to mine 3D graphics objects, such as the work of [11]. Such an approach is very useful for digital libraries used in construction engineering, visualization, artistic performance and animations. Other works apply the search mechanisms for retrieving medical data in large scale biological and/or medical imaging volumes [12]. This paper extends the aforementioned approaches by proposing a new innovative content-based image retrieval (CBIR) system which exploits signature trees and color coherence. The adopted method is very robust to content-based multimedia data retrieval yielding
high precision and recall results. We also efficiently combine the color information with spatial characteristics to obtain a reliable CBIR system. The proposed architecture has been implemented using a Java technology platform which exploits a large image database, of data covering a various number of thematic areas, such as animals, landscapes, buildings, etc. Concerning the content of this paper, it is organized as follows. We first give an overview of the way a typical CBIR procedure works. Later in sections 3 and 4, we refer to three specific methods which are implemented in the project and are considered to improve its performance. In section 5 we describe the interface and the program’s functions and innovations, while in section 6 we give some experimental results after testing the project and the precision-recall curve which points out the efficiency of the system. Finally, in section 7 we draw a conclusion.
2.
OVERVIEW OF THE CBIR PROCESS
The first step of a typical CBIR process is to insert a set of images into a database and then to extract features from those images. Usually these features are descriptors of color, texture and/or shape. In some cases, an effort is made to select methods and kinds of descriptors that seem to approximate the human visual model, as in other cases more low-level features are used. These features are a set of numerical values that represent the image from which they were extracted and are used finally to index our collection. The heart of such a system consists of two things: the data structures and the algorithms used for indexing. And this is where an analyst-developer should put the most of his effort when designing a CBIR system. A crucial part of such a system is its user interface which is usually designed to fit to the Query-By-Example (QBE) paradigm. The user specifies an image that represents his custom ‘information need’. Many systems give the user the ability to define a specific region of interest (ROI) of the image specified, or even draw a sketch. After the user’s submission, the system follows a rather standard procedure. At first, the system analyzes the user’s input and extracts
features of the same kind to those that are stored in the database. These features are then compared to those of every image that is previously inserted into the database using a similarity measure, usually the Euclidean distance. Then the system ranks the images based on the results from the previous comparisons in decreasing order and returns the top-n or those which have a similarity percentage above a given threshold. The interface displays the images, also in decreasing order of similarity. A very important tool, which is not implemented in all CBIR systems, is Relevance Feedback (RF), since it gives the user the opportunity to further refine his/her ‘information need’. The user indicates, through the UI, whether a returned image is relevant or not. After that the system has two ways to respond. The first way is to execute a query for every image indicated as relevant or irrelevant and merge the results, while the second is to create a single query after reweighing the features based on the user’s feedback.
3. SIGNATURE TREES EMBEDDED IN THE CBIR PROCESS In respect with the storage and the efficiency of the retrievals, after a lot of consideration, the Signature Trees, proposed in [13], have been used. Every feature extracted is encoded to a binary signature using the Variable Bin Allocation method (VBA). In this way the storage requirements are kept low and also, we achieve maximum efficiency, since the binary signatures used to index the entire collection allow us to load them all into the main memory and perform much faster retrievals. In addition to that, the use of Signature Trees, gives us the benefit of smarter, non-sequential, even faster retrievals. What follows is an attempt to describe the way that the S-trees are integrated in the proposed architecture. Initially, just after the extraction from an image of the desired features that later will be used in the retrievals, compact binary signatures are generated. A binary signature is only a string consisting of 0s and 1s. Such a bit string can represent either the histogram of an image, no matter which method is used (GCH or CCV), or
even other attributes used for indexing and retrieving. Further information on how to extract a binary signature from a color histogram can be found in [17]. Now that we have generated the binary signatures that represent our images, they have to be structured in a tree form (S-tree), so that we minimize the number of comparisons in a query until we find the image inside the database with the minimum distance in terms of similarity with the query image. The distance between two images Q and S is given by Formula (1) d (Q, S ) = ∑ j =1[ pos ( BQj ) − pos ( BSj )] 2 n
(1)
where pos ( BAj ) gives the position of the j set bit within the set B of bins for image A. Each child node consists of pairs where s is a signature and p is a pointer to a child node. Two parameters need to be set when constructing an S-Tree, M and m. The root can hold at least 2 and at most M pairs, whilst any other node can contain at least m and at most M pairs, with 1 ≤ m ≤ M / 2 . In that way, the height of a tree containing n signatures would be h = log m n − 1 . All the image signatures are located in the leaves, while the internal nodes are formed by superimposing their child nodes’ signatures. When a new signature needs to be inserted, we traverse the tree in a top-down direction by choosing the appropriate node in each level according to a distance criterion. In case the node we end up to is already full, thus containing M pairs, we need to split the node and redistribute the M+1 pairs appropriately. In the first phase of the split, we select the two most distant signatures according to a distance function, while in the second phase we distribute the remaining signatures also using the same function to the two new parent nodes. At this point it should be mentioned that due to the superimposition, we cannot use the distance function given by Formula (1) anywhere else, than the leaves. On the internal nodes, we apply the minimum distance function given by Formula (2)
d (Q, S ) = ∑ j =1[ pos ( BQj ) − optPos ( BSj )]2 n
(2)
where optPos ( B Aj ) gives the position of j the physically closer set bit within the set B of bins of the superimposed signature. When trying to retrieve the k nearest neighbors to the query image, we need two buffers, one in decreasing order for the k more similar signatures, and one for the nodes that still need to be searched. While traversing the tree, when visiting a node, its children are stored in the second buffer. In case of a leaf, we compare the distance values of its signatures with the distance value of the k-th signature in the first buffer and if it is smaller, it is inserted in that buffer in the appropriate position. In case of an internal node, we compare its optimal distance value also to the k-th signature in the first buffer and only if it is found smaller, we add it to the second buffer. In this way we don’t traverse the whole tree which saves us processing time. Eventually the first buffer will contain our k most similar results.
Figure 1. Example state of a signature tree.
4.
COLOR DESCRIPTORS 4.1.
THE COLOR COHERENCE VECTORS
The use of color coherence vectors (CCV) presented in [14] is one of the proposed methods to index the entire collection. It is a variation of the common Global Color Histogram, but with the following alteration. Instead of 1 value per bin, we store 2 values, one indicating the number of coherent pixels belonging to that bin, and another for the non-coherent ones. Let ai denote the number of coherent pixels in the ith color bin and bi denote the number of incoherent pixels in the same color bin. The CCV is defined
as the vector . Note that would be the color histogram of the image. To determine whether a pixel is coherent, which would instantly mean that it belongs to a wide area, or not, we compare the pixel in question with everyone of its neighbors using the Euclidean distance. We then add each of the results and compare the sum with a, given by the user, threshold. In case the sum exceeds the threshold, the pixel is considered to be part of an edge of an object; otherwise it belongs to the inner unvarying part of a surface. The advantage of this method is that spatial information is incorporated into the color histogram, making the separation between images which have either mostly uniform color or mostly texture regions, now feasible.
Figures 2, 3. Sample pictures showing the performance of the colour coherent algorithm that is used in the colour coherence vectors. Setting the threshold equal to 150.
4.2. COMBINATION OF COLOR-SPATIAL INFORMATION Another method that is used and was designed to combine color and spatial features is the one proposed in [15]. This approach, which makes use of the HSV color space, was designed to be closer to the human visual model. The color values are quantized into 36 bins, which is considered to be a very low number of bins and thus the computational complexity is decreased tremendously. Except that, this quantization scheme due to its 8 level gray colors, is suitable for both color images and gray images. The quantization scheme is based
on the fact that hue as well as SV values as shown in Figures 4 and 5 “can be quantized non-uniformly”. Note that [15] is also the source for the Figures 4 and 5 showing the HSV quantization scheme.
Saturation → Hue Value ↓ → (330,22] (22,45] (45,70] (70,155] (155,186] (186,278] (278,330]
(0.2,0.65] (0.2,0.7]
(0.65,1]
(0.7,1]
(0.2,0.7]
(0.7,1]
0,0,0 0,0,1 0,1,0 1,0,0 1,0,1 1,1,0 2,0,0 2,0,1 2,1,0 3,0,0 3,0,1 3,1,0 4,0,0 4,0,1 4,1,0 5,0,0 5,0,1 5,1,0 6,0,0 6,0,1 6,1,0 Table 1. Quantization table
l = 4A + 2B + C + 8
0,1,1 1,1,1 2,1,1 3,1,1 4,1,1 5,1,1 6,1,1
(4)
We now have constructed a vector representing the color histogram H. H = (c1 , c 2 , .., c k , ..., c n )
Figure 4. Hue panel quantization
Then we construct another vector, P.
P = (p[c1 ], p[c2 ], .., p[cn ]), p[ck ] = = (x [ck ] , y[ck ]) (5) where: Figure 5. Saturation-Value panel quantization
N1 −1 N 2 −1
Consider an image I [N1 x N2] and let H, S and V denote the HSV values of the pixel in question; we then get the following quantization scheme:
x [c k ] =
i =0 j =0 N1 −1 N 2 −1
N1 × ∑ ∑ f (i, j , k )
(6)
i =0 j =0
If V є [0, 0.2) then l=0
N1 −1 N 2 −1
If S є [0, 0.2) and V є [0.2, 0.8) then
l = [(V 0.2) × 10] + 1
∑ ∑ i × f (i, j, k )
(3)
y[ck ] =
i =0 j =0 N1 −1 N 2 −1
N 2 × ∑ ∑ f (i, j , k )
(7)
i =0 j =0
If S є [0, 0.2) and V є [0.8, 1) then l=7 If S є [0.2, 1) and V є [0.2, 1) then we use Table 1, to get three other values, A, B and C. For example, if H є (186,278], S є (0.2,0.65] and V є ((0.7,1]], then A=5, B=0 and C=1. Then we apply equation (4) on those three values.
∑ ∑ j × f (i, j, k )
f (i, j , k ) =
1 if the color of I [i, j ] ∈ c k (8) 0 if not
Finally, we compare each element of the two vectors with those of a target image using a common similarity measurement method, such as the Euclidean distance. When comparing this method with the Global Color Histograms or even the Color Coherence Vectors, one would expect that the
system’s efficiency would be substantially increased. Nevertheless, in reality we get the exact opposite results. Although the incorporation of spatial characteristics guarantees us more specific results since the
query image submitted; in our case a house. Below of the query image there is an area that provides ways to control the methods that will be used as well as the output. The user can request either a specific number of results to be
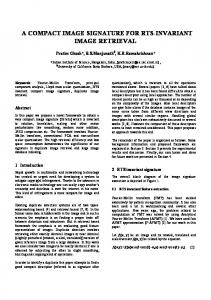
Figure 6. Retrieval using the Colour Coherence Vectors. Exterior view of a house submitted.
user’s submission is more accurately defined, other ways of comparing spatial characteristics should be integrated. The basic idea is that spatial characteristic of two images should be compared relatively rather than absolutely, so for example two images displaying the exact same scene viewed from two different angles would considered to be similar to each other, since the relative position of the objects shown would be the same.
5.
APPLICATION
5.1. GUI DESCRIPTION In Figure 6, we are looking at an example query. In the upper left corner we can see the
returned or all the images that seem to have a result above a given percentage. For example, all the images that are at least 90% similar to the query image. For every one of the results the image, as well as its histogram is displayed in different tabs. By double-clicking the image a new window opens displaying the image in actual size. Also below every result, there is a checkbox with the annotation “Relevant Image”, through which, the user can submit sequential queries that will help him/her achieve better results. Relevance feedback is an important and very helpful utility. In every resubmitting, the features of the query image are compared to those of every result marked as relevant, and a
readjustment of weights for every bin occurs just before the next retrieval takes place. The user can also control the number of the results displayed per page and then navigate through the results using the navigation bar on the bottom of the right part of the application. Just after a query, another one can start as simply as by dragging a result image to the query place and pressing the button ‘Retrieve Similar Images’.
possible so only the directories containing the images of the same category as the sample query image would be enabled and thus participating in the retrieval. Also concerning the color features, the interface lets the user choose which features to extract, selecting among 3 types of color histograms, 3 color spaces (RGB, HSV and HSB), and specifying the number of bins used for the histograms. Another innovative part, concerning the
Figure 7. Extracting features and storing in the database.
Concerning the image storing and feature extraction, we can look at Figure 7. Three tabs, one for the import of images, one for the color histogram construction, and one for the texture feature extraction exists doing all that has to be done so the user is ready to submit queries. An interesting part is that when the user is importing images into the database, filesystem directories are specified. Such a directory can later be disabled so it doesn’t participate in image retrievals. So in case the user had organized his/her images in different directories per category, in a future retrieval, exclusion of all the other directories/categories would be
interface by itself and not the CBIR process, is the fact that it can support unlimited number of different languages. Anyone with basic XML knowledge can import a translation of the environment in a different language only by editing a single xml file. Then, by clicking the additional flag displayed at the left bottom corner of the application, the GUI is instantly displayed translated. 5.2.
USING ONLY FREE AND OPEN SOURCE TOOLS Although it may not seem to be of great importance, it should be mentioned that the
whole project has been developed using free, open source tools and libraries. Some of them are the Java SE Development-Kit, JFreeChart (Charts & Histograms), MySQL (Database Used) and JDom (XML parsing). Dealing with the images, both in low and high level, was
6.
EXPERIMENTAL RESULTS 6.1. DATABASE DESCRIPTION
During the testing procedure, the program was applied on 3000 pictures downloaded from the Internet, displaying a variety of subjects,
Figure 8. Retrieval results using Color Histograms. Beach photo submitted.
made possible using the ImageIO technology Java offers, which gives the developer support for almost every existing image filetype. The use of the previous mentioned tools, apart from the obvious benefits, such as the low cost and the clear advantage of maintaining the source code and applying custom changes, guarantees us lifetime updates and low cost migration to newer versions.
such as animals, trees, flowers, gardens, football fields, mountains, landscapes, monuments, houses, buildings, people, etc. 6.2. SUBJECTIVE EVALUATION In Figure 6 we can see what the application’s response was like when the query image that is shown in the upper left corner of the interface was submitted. The query image in this example was the exterior view of a typical American suburban house. The algorithm indeed returned a very specific and relevant to the query image result set. The RGB color space was used and the color histogram was
constructed using the color coherence vectors and 4 bins per color. In Figure 8 a beach photo was submitted. The RGB color space was selected along with 4 bins per color for the color histogram and the selected type of histogram was the normal Global Color Histogram. We could notice that although most of the results are similar, presenting different beaches, there is also an irrelevant one, the one located in the first column and second row. None the less, the return of an irrelevant result like that one, is, in a way, justified by the program since we ourselves could notice that the colors and their distribution are very likely to those of the query image and of the other results returned. Additional queries are shown in figures 9 and 10.
6.3. OBJECTIVE EVALUATION To compare the performance of the previously described relevance feedback algorithms, measurements are required to evaluate the retrieval efficiency. Usually, two different approaches are adopted; the qualitative and the quantitative approach. In the first approach, the evaluation is performed on a subjective basis according to the user’s perception, who compares the content of the best retrieved images with the content of the query image (i.e., the user evaluates the system response). Instead, in the second case the evaluation is performed on an objective basis by using appropriate criteria, which judge the retrieval efficiency. In the following, we focus on objective evaluation criteria. The most common objective criterion used for evaluating a CBIR system is the precisionrecall curve, initially used in traditional textbased information retrieval systems. Precision for a query q is defined as the ratio of the number of retrieved relevant images, say L(q), over the number of total retrieved images, say M [15][16]. That is Pr(q ) =
Figure 9. Retrieval using the Color Coherence Vectors. Nature scene of woods submitted.
Figure 10. Retrieval results using the Color Coherence Vectors and a picture of a horse as the query image.
L(q ) M
(9)
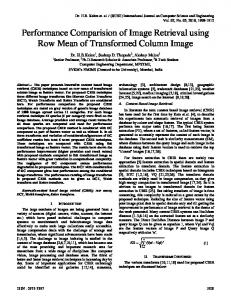
On the other hand, recall is defined as the ratio of the number of retrieved relevant images L(q) over the total number of relevant images in the database for the respective query, G (q ) [15]. For an “ideal” system, both Pr(q) and Re(q) should be high. However, in a real content-based retrieval system, as the number M of images returned to the user increases, precision decreases, while recall increases. Because of this, instead of using a single value of Pr(q) or Re(q), the Precision-Recall curve is usually adopted to characterize the performance of a CBIR system. In equations (10) and (11), precision and recall have been estimated for a given query q. However, to evaluate the performance of a CBIR system, many queries should be applied and the average value is used. Assuming that Q queries are submitted, the average precision/recall, APr, ARe are defined as
APr =
1 Q ∑ Pr(q) Q q =1
(10)
ARe =
1 Q ∑ Re(q) Q q =1
(11)
In the following figure (Figure 11), the system’s precision is showed as the recall increases. The system was tested on a set of queries with randomly selected query images and the average values from those tests were used in order to calculate the systems average efficacy.
efficiency of the proposed scheme. Using the objective criterion of precision-recall, we observe that very accurate results are obtained on average. In the present form, the database is based on a MySQL sequential organization scheme. A better index structuring can be applied to improve the search computational efficiency especially in cases of distributed volumes the access of which is tedious. This will be addressed in a future work. (42) 8.
MPEG-7: Context and Objectives (v.5). ISO/ IEC /JTC1/SC29/WG11 N1920 MPEG-7, Oct. 1997. [2] M. Flickner, H. Sawhney, W. Niblack, J. Ashley, Q. Huang, B. Dom, M. Gorkani, J. Hafner, D. Lee, D. Petkovic, D. Steele and P. Yanker, “Query by Image and Video Content: the QBIC System”, IEEE Computer Magazine, pp. 23-32, Sept. 1995. [3] S.-C Pei and C.-M. Cheng, “Extracting Color Features and Dynamic Matching for Image Database Retrieval”, IEEE Trans. on Circuits & Systems for Video Technology, Vol. 9, No. 3, pp. 501-512, April 1999. [4] A. Pentland, R. W. Picard and S. Sclaroff, “Photobook: Content-Based Manipulation of Image Databases”, Int. J. Comput. Vision, Vol. 18, No. 3, pp. 233-254, 1996. [5] T. Gevers and A. W. M. Smeulders, “PicToSeek: Combining Color and shape Invariant Features for Image Retrieval”, IEEE Trans. on Image Processing, Vol. 9, No. 1, pp. 102-119, January 2000. [6] S.-F. Chang, W. Chen, H. J. Meng, H. Sundaram and D. Zhong, "A Fully Automated Content-based Video Search Engine Supporting Spatiotemporal Queries", IEEE Trans. on Circuits on Systems For Video Technology, Vol. 8, No. 5, September 1998. [7] S. Dagtas, W. Al-Khatib, A. Ghafoor and R. Kashyap, “Models for Motion-Based Video Indexing and Retrieval”, IEEE Trans. on Image Processing, Vol. 9, No. 1, pp. 88-101, January 2000. [1]
Precision - Recall
Precision
1 0.8 0.6 0.4 0.2 0 0.1
0.2
0.3
0.4
0.5
0.6
0.7
Recall Precision-Recall
Linear (Precision-Recall)
Figure 11. Evaluation of the system using the precisionrecall curve. Illustrates the CBIR system’s efficiency.
7.
CONCLUSION
A new innovative Content-based Image Retrieval (CBIR) architecture for mining and searching image in large scale distributed volumes has been proposed in this paper. The architecture exploits signature tree information and color coherence. It also efficiently combines color information with spatial information to improve the retrieval performance. Relevance feedback mechanisms are also incorporated in the proposed architecture. The platform has been developed using the Java language and it has been applied on a large scale multimedia volumes. The platform has been tested on 3000 pictures downloaded from the Internet, displaying a variety of subjects, such as animals, trees, flowers, gardens, football fields, mountains, landscapes, monuments, houses, buildings, people, etc. Several randomly selected queries have been submitted to test the
REFERENCES
J. Nam and A. Tewfik, “Progressive Resolution Motion Indexing of Video Object”, Proc. of IEEE Inter. Conf. on Acoustics Speech & Sign. Processing (ICASSP), Seattle WA, USA, May 1998. [9] E. Sahouria and A. Zakhor, “Motion Indexing of Video”, in Proc. Inter. Conf. on Image Proc. (ICIP), Vol. 2, pp. 526-529, 1997. [10] The IBM Marvel Project: mp7.watson.ibm.com/marvel [11] M. Koutsokeras, I. Pratikakis and G. Miaoulis, “A web-based 3D graphical model search engine”, In Proceedings of the Eighth International Conference on Computer Graphics and Artificial Intelligence, May 1112, Limoges, France, pp. 79-90. [12] C. Fraggos, G. Miaoulis and C. Skourlas, “Declarative Modeling for Content Based Medical Image Retrieval”, Craiova Medicala Journal, ISSN 1454-6876, Vol. 5, Sup. 3, (2003): 258-261 [13] M. Nascimento, V. Chitkara, E. Tousidou, and Y. Manolopoulos. “Color Based Image Retrieval Using Signature Trees”, Technical Report TR-0102, Department of Computing Science, University of Alberta Edmonton, Albert, 2001. [14] G. Pass and R. Zabith, “Comparing images using joint histograms”, Multimedia Systems, Vol.7, pp. 234-240, 1999. [15] Zhang Lei (
[email protected]), Lin Fuzong and Zhang Bo, “A CBIR METHOD BASED ON COLOR-SPATIAL FEATURE”, State Key Laboratory of Intelligent Technology and Systems, Department of Computer Science and Technology, Tsinghua University [16] G. Salton and M. J. McGill, “Introduction to Modern Information Retrieval”, New York: McGraw-Hill Book Company, 1982. [17] Vishal Chitkara, “Color-Based Image Retrieval Using Compact Binary Signatures”, Department of Computing Science, University of Alberta, Edmonton, Alberta, Canada, Technical Report TR 01-08, May 2001 [8]