Frederic Allain,a) and Ilie Petre-Lazara). A fundamental issue that arises in the framework of probabilistic seismic risk analysis is the choice of ground motion ...
EARTHQUAKE ENGINEERING PRACTICE
A Simple and Efficient Intensity Measure to Account for Nonlinear Structural Behavior Marco De Biasio,a), b) M.EERI, Stephane Grange,b) Frederic Dufour,b) Frederic Allain,a) and Ilie Petre-Lazara)
A fundamental issue that arises in the framework of probabilistic seismic risk analysis is the choice of ground motion intensity measures (IMs). A new structure-specific IM, namely, relative average spectral acceleration (ASAR ), is being proposed herein, and a comparison with current IMs is performed based on (1) a large data set of recorded earthquake signals; (2) numerical analyses conducted with state-of-the-art finite element (FE) models, representing actual load-bearing walls and frame structures, and validated against experimental test; and (3) systematic statistical analyses of the results. According to a comparative study of the case of nonlinear structural behavior, the ASAR proves to be the most efficient IM with respect to demand parameters, such as maximum interstory drift, frequency drop and maximum ductility demand. Beyond the sufficiency and simplicity of its formulation, which allow for the use of existing ground motion prediction models, the ASAR offers a promising IM for performance-based seismic design and/or assessment. [DOI: 10.1193/ 010614EQS006M]
INTRODUCTION PERFORMANCE BASED EARTHQUAKE ENGINEERING
Performance-based earthquake engineering (PBEE) refers to a methodology aimed at improving seismic risk decision-making through implementing assessment/design methods with strong scientific bases and capable of expressing options in terms that promote wellinformed stakeholder decisions (Deierlein 2004). In its form developed by the Pacific Earthquake Engineering Research (PEER) Center, which has been adopted herein as a reference, the PBEE methodology can be broken down into four processes (Porter 2003): hazard analysis, structural analysis, damage analysis, and loss analysis. During the hazard analysis, the seismic hazard is evaluated for the facility site and ground-motion time histories, whose intensity measures (IMs) correspond to the various hazard levels, are produced. During the structural analysis phase, nonlinear time-history analyses are performed in order to calculate
a) b)
EDF SEPTEN, Structural Dynamics and Earthquake Engineering Division, Villeurbanne, France University Grenoble-Alpes, 3SR Laboratory, 38000 Grenoble, France 1403
Earthquake Spectra, Volume 30, No. 4, pages 1403–1426, November 2014; © 2014, Earthquake Engineering Research Institute
1404
DE BIASIO ET AL.
the facility’s response to ground motions of a given IM in terms of drift, roof displacement, floor response spectrum features or other engineering demand parameters (EDPs). During the damage analysis phase, these EDPs are used along with component fragility functions to determine damage measures (DMs) specific to facility components. Lastly, given these DMs, a set of variables including operability, repair costs/duration and potential for casualties can be evaluated. Such performance measures are referred to as decision variables (DVs) since they serve to inform stakeholder decisions regarding future performance. Each relationship in this four-phase process, from location and design to IMs, IMs to EDPs, EDPs to DMs, and DMs to DVs, involves uncertainties and is treated probabilistically. One focus of the present research is to reduce uncertainties existing between IMs and EDPs. INTENSITY MEASURE AND HAZARD ANALYSIS
In hazard analysis, seismic hazard at a facility is evaluated in considering the seismic environment, location, and structural features. The hazard curve describes the annual frequency used to estimate seismic excitation exceeding various assigned thresholds. Excitation is parameterized via an IM, typically the peak ground acceleration (PGA) or the low-damped elastic spectral acceleration at the fundamental period of the structure [Spa ðT 1 Þ]. In addition to quantifying IM, the hazard analysis leads to the selection of a sufficient number of appropriate (in terms of IM) ground motion records for nonlinear time-history analyses. The IM therefore is the primary parameter used to define the seismic hazard. The choice of IM exerts great impact on the assumptions and methods potentially used to accurately and efficiently evaluate the risk integral, which aggregates the results of the four PBEE process subtasks (Conte et al. 2003). In addition to reducing record-to-record variability, an improved IM (i.e., one able to better capture the damaging features of a record, as well as the site hazard) provides criteria for selecting input ground motions to loosen restrictions on inelastic time-history analyses (Cornell 2004). The two main characteristics defining IMs are efficiency and sufficiency: An IM is deemed to be efficient if it yields, for a given value, reduced variability in the structural response. A sufficient IM, on the other hand, is defined as the one that, for a given value, renders the structural response conditionally independent of earthquake magnitude and source-to-site distance (Luco and Cornell 2007). Furthermore, an IM is effective and of practical utility if it allows for the computation of the probabilistic seismic hazard (i.e., whereby the ground motion prediction equations (GMPEs) must be easily computable for such an IM). The aim of the present work is to propose a new intensity measure and compare its efficiency and sufficiency with those of well-known IMs, that is, peak ground acceleration and velocity (PGA, PGV); low-damped spectral acceleration at the fundamental period, Spa ðT 1 Þ; Arias intensity, I A (Arias 1970); cumulative absolute velocity, CAV (EPRI 1988); standardized cumulative absolute velocity, S-CAV (EPRI 1991); Housner intensity, I H (Housner 1959); effective peak acceleration, EPA (ATC 1978); acceleration spectral intensity, ASI (Von Thun et al. 1988); root-mean-square acceleration, aRMS (Housner et al. 1964); characteristic intensity, I C (Park et al. 1985); S� (Cordova et al. 2001); and I NP (Bojorquez et al. 2011). The definition of each of these IMs is summarized in Table 1. The possibility of using IMs is a critical aspect within the framework of probabilistic seismic hazard analysis (PSHA). Highly efficient IMs, which due to their complex
A SIMPLE AND EFFICIENT IM TO ACCOUNT FOR NONLINEAR STRUCTURAL BEHAVIOR
Table 1.
1405
The IMs compared in this study, as extracted from the literature
Type Frequency response-based
IM
Notes
Spa ðT 1 Þ
Spa ðT 1 Þ ¼ pseudo-spectral acceleration at the fundamental period Sv ¼ spectral velocity ξ ¼ damping ratio
I H ∫ 2.5 0.1 Sv ðT,ξÞ dT 1 ∫ 2.5 EPA ¼ 2.5 0.1 Spa ðT,ξÞdT
ASI ¼ ∫ 0.5 0.1 Spa ðT,ξÞdT � � S ðT 2 Þ 0.5 S� ¼ Spa ðT 1 Þ Spa ðT Þ pa 1 I NP ¼ Spa ðT 1 Þ
�
�
SpaAV ðT 1 , : : : ,T 2 Þ 0.4 Spa ðT 1 Þ
Amplitude-based
PGA ¼ max jaðtÞj PGV ¼ max jvðtÞj
Duration-based
I A ¼ 2πg ∫ 0f aðtÞ2 dt
t
t
CAV ¼ ∫ 0f jaðtÞjdt i jaðtÞjdt SCAV ¼ CAV i þ ∫ ti�1
aRMS ¼
qffiffiffiffiffiffiffiffiffiffiffiffiffiffiffiffiffiffiffiffiffi 1 2 T d ½aðtÞ� dt
0.5 I c ¼ a1.5 RMS T d
Spa ¼ pseudo-spectral acceleration ξ ¼ damping ratio Spa ¼ pseudo-spectral acceleration ξ ¼ damping ratio Spa ¼ pseudo-spectral acceleration T 1 ¼ fundamental period T2 ¼ 2 � T1 SpaAV ¼ averaged pseudo-spectral acceleration between T 1 and T 2 T 1 ¼ fundamental period T2 ¼ 2 � T1 aðtÞ ¼ acceleration time history vðtÞ ¼ velocity time history aðtÞ ¼ acceleration time history t f ¼ total duration of the record aðtÞ ¼ acceleration time history t f ¼ total duration of the record aðtÞ ¼ acceleration values during a 1 s interval, with at least one value exceeding 0.025 g i ¼ 1, : : : ,n with n equal to the record length, in seconds aðtÞ ¼ acceleration time history T d ¼ time elapsed between the first and last excursions of acceleration above 0.05 g T d ¼ time elapsed between the first and last excursions of acceleration above 0.05 g
formulation render seismic hazard computations impossible, tend not to be employed in engineering practice despite their high performance. For this reason, IMs requiring more substantial structural information than natural period are not considered in this comparative study. Furthermore, such advanced, complex, and even elaborate IMs often show slight improvements in performance with respect to simpler ones (Fontara et al. 2012). This comparative study is performed by following three main steps: (1) computer analyses of accelerograms derived from the ground motion data set to provide values of the selected IMs; (2) nonlinear dynamic time-history analyses (conducted with the FE code
1406
DE BIASIO ET AL.
Cast3m, developed by the French Atomic Energy Agency) to generate the structural response of the chosen reinforced concrete structures, for given seismic excitations; and (3) statistical analyses of outputs from the two aforementioned steps to determine the efficiency and sufficiency grade for the IMs being examined. ACCOUNTING FOR NONLINEAR STRUCTURAL BEHAVIOR IN IMs TOWARD ASAR
Currently, the most commonly used IMs are PGA and the structure-specific, low-damped spectral pseudo-acceleration at the fundamental period of the structure Spa ðT 1 Þ. The horizontal PGA has commonly been used to describe ground motions by virtue of its natural relationship to inertial forces. Despite the fact that the greatest dynamic forces induced in very stiff structures are closely correlated with PGA, the efficiency of this IM is known to be lower than that of Spa ðT 1 Þ. It has been noted, particularly in connection with near-source motions due to low-tomoderate magnitude earthquakes, that structures perform much better during earthquakes than would be predicted when considering the instrumental PGA applied to them (NUREG 1984). Spa ðT 1 Þ is widely used given its perfect efficiency (and sufficiency) as an IM for elastic SDOF systems and the widespread GMPEs expressed in his terms. With respect to real structures however, this IM has two major drawbacks: it ignores both the contributions of higher modes to the overall dynamic response and the lengthening of the fundamental period associated with damage accumulation. The first drawback will not be addressed in this work, and instead attention will be turned to the second. A structure exhibiting inelastic behavior is not actually characterized by a “single-value” fundamental period; when the elastic limit is reached, irreversible damage processes (e.g., concrete cracking, joint failure) cause a gradual loss of stiffness with ensuing period elongation. The efficiency of Spa ðT 1 Þ tends to be high in the case of a linear-elastic structure but, based on the foregoing, is expected to decrease once structural damage appears. In the definition of an efficient IM that takes nonlinear structural behavior into account, it seems reasonable to enrich the information given by Spa ðT 1 Þ by considering additional spectral pseudo-acceleration values computed over periods other than the fundamental one. This procedure has been adopted in various IMs, for instance EPA, ASI, S� , and I NP , among which the structure-specific S� and I NP combine with the Spa ðT 1 Þ factors in order to account for the spectral shape within the period lengthening zone. Such factors are computed based on one or more spectral pseudo-acceleration values over a period longer than T 1 . Put another way, without considering damage phenomena and subsequent period lengthening, EPA and ASI are defined as general (as opposed to structure-specific) IMs. For both of them, the pseudo-acceleration response spectrum is integrated over a period range assumed typical of civil engineering structures (0.1–2.5 s in EPA) and reinforced concrete dams (0.1–0.5 s in ASI). THE RELATIVE AVERAGE SPECTRAL ACCELERATION (ASAR )
Based on the aforementioned discussion, it will now be attempted to create an efficient IM for nonlinear structures. Frequency will be used instead of the common period to describe the IM. This modification is solely the authors’ preference, and the equivalent definition in terms of period will ultimately be given.
A SIMPLE AND EFFICIENT IM TO ACCOUNT FOR NONLINEAR STRUCTURAL BEHAVIOR
1407
The intention here is to define a structure-specific IM; the key idea consists of considering the structure’s relative frequency-drop (i.e., period elongation) interval as the “core” of this IM. The frequency range to be taken into account has an upper bound at the fundamental frequency and a lower bound at the maximum expected “softened” frequency, which is evaluated as a percentage of the fundamental value. A new IM is thus being proposed: The relative average spectral acceleration (ASAR ) is defined as the average spectral pseudo-acceleration over the fundamental frequency f 1 evolution interval. The term “relative” indicates the dependence of ASAR on the structure, that is, its fundamental frequency of vibration. ðf 1 1 ASAR ð f 1 Þ ¼ S ð f ; ξÞdf (1) f 1 ð1 � X f Þ X f ·f 1 pa where EQ-TARGET;temp:intralink-;e1;62;542
• • • • •
f 1 is the fundamental frequency of the structure. X f ¼ 1 � ðR∕100Þ is a factor that accounts for the drop in fundamental frequency f 1 . R indicates the amount of drop (expressed as a percentage) in fundamental frequency f 1 . Spa is the spectral pseudo-acceleration. ξ is the damping value.
The exact value of R depends on the nonlinearity experienced by the structure, which in turn depends on both ground motion intensity and structural design properties. A general optimal R value (i.e., ASA40 ), derived from numerical sensitivity analyses, will be suggested in the last section of this paper. The formulation of ASAR therefore captures, in the simplest manner, the presence of significant spectral acceleration ordinates over the range of fundamental frequency evolution. This constitutes a key characteristic required of a seismic signal in order to be destructive (NUREG 1986, Kennedy et al. 1988). With T 1 ¼ 1∕f 1 , ASAR can be written with respect to the period as: ð T1 T1 X f Spa ðT; ξÞ ASAR ðT 1 Þ ¼ dT ð1 � X f Þ T 1 T2 EQ-TARGET;temp:intralink-;e2;62;268
(2)
Moreover, it is worth noting that the simple formulation in Equations 1 or 2 of ASAR as based exclusively on spectral pseudo-acceleration values can lead to performing PSHA with respect to ASAR using widespread ground motion prediction models available for Spa ðT 1 Þ (Bazzurro and Cornell 2002, Stewart et al. 2002, Baker and Cornell 2006a, Inoue and Cornell 1990). COMPARATIVE ANALYSES TEST-CASE STRUCTURES
To compare IM performance, analyses are performed on two experimentally tested structures, which serve as a validation tool for the numerical models and, provided a sufficiently
1408
DE BIASIO ET AL.
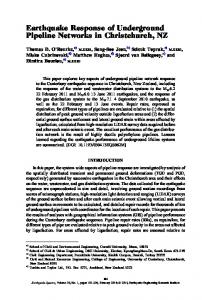
precise agreement between numerical simulation output and experimental test results, give credence to the results extracted from the numerical model. The selected structures feature different design characteristics (hence different dynamic properties): one is a stiff (highfrequency) load-bearing wall, that is, the CAMUS1 mock-up (IAEA 2011), while the other is a ductile (low-frequency) frame structure, that is, the EC8-FRAME (JRC 1994). CAMUS1 is a one-third-scale model tested in 1998 on the shaking table of the French Atomic Energy Agency (CEA), as well as in an international blind design contest. The mockup (Figure 1a) is composed of two parallel reinforced concrete (RC) walls without openings linked by five slabs. The mock-up is unidirectionally loaded along the wall planes thus preventing any orthogonal displacements. The total height of the structure is 5.10 m, and the total mass is approximately 36 tons. The mock-up has been designed and tested in accordance with precise similitude criteria to ensure its behavior is representative of a full-scale structure. The EC8-FRAME is a full-scale, four-story, high-ductility RC frame designed according to the European seismic code (EC8 1988) and tested in 1994 on the reaction wall at the European Joint Research Center (JRC). The structure (Figure 1b) is symmetrical in one direction with two equal 5-m spans, while slightly irregular in the other direction due to the different span lengths (6 m and 4 m). NUMERICAL MODELS
To ensure adequacy for this study, the numerical models needed to possess three fundamental characteristics: (1) accurate representation of the linear structural dynamic behavior, that is, natural vibration modes; (2) accurate representation of the nonlinear structural behavior in order to replicate the key damage mechanisms under seismic loading; and (3) low computational cost to allow, within a reasonable timeframe, for the extension of the analysis to a large number of seismic signals, thus adding statistical value to the study. The numerical modeling technique suited to the selected test-case structures (Powell 2010) and able to satisfy these constraints is referred to herein as “semi-global.” This approach makes use of comprehensive local behavior laws within the framework of a
Figure 1. Test-case structures: (a) CAMUS1 and (b) EC8-FRAME.
A SIMPLE AND EFFICIENT IM TO ACCOUNT FOR NONLINEAR STRUCTURAL BEHAVIOR
1409
simplified kinematic associated with finite beam elements, that is, multi-fiber modeling (Spacone et al. 1996). The damage-based constitutive law chosen to represent concrete behavior (La Borderie et al. 1994) can take into account the decrease in stiffness due to cracking, as well as the stiffness recovery that occurs at crack closure and the inelastic strains concomitant with damage. For the steel reinforcement bars, a constitutive relation that includes kinematic hardening (Menegotto and Pinto 1973) has been selected. Material model parameters have been calibrated against elementary tests on both the concrete and steel of the two test-case structures. The predictive capabilities of these numerical models have been checked with results stemming from the respective experimental campaigns of the two structures. The CAMUS1 numerical model has been checked with results of shaking table tests, in terms of natural frequencies, roof displacement time-history (Figure 2a), maximum interstory drift ratio, floor response spectrum at the roof, and damage pattern in the concrete. In the case of the EC8-FRAME, the predictive capabilities of the numerical model have been checked with results derived from the pseudo-dynamic (reaction wall) tests (Takanashy 1975) in terms of natural frequencies, roof displacement time-history (Figure 2b), and damage pattern in the concrete. The comparison of numerical and experimental results reveals the ability of numerical models to predict with a good level of agreement the structures’ linear, as well as nonlinear, behavior, both qualitatively and quantitatively. It is important to mention that the CAMUS1 numerical model has been validated with respect to the one-third-sale mock-up. Nevertheless, once validated, such a model can be rescaled to a full-scale; this step allows for the performance of comparative analyses without the need to scale the entire ground motion data set.
LOAD, BOUNDARY CONDITIONS, AND DEMAND PARAMETERS
Regarding the application of loads, for CAMUS1, the horizontal unidirectional (seismic) load has been applied along the horizontal direction parallel to the wall planes. Orthogonal
(a)
(b)
Figure 2. Numerical model validation: (a) CAMUS1, top displacement time-history and (b) EC8-FRAME, top displacement time-history.
1410
DE BIASIO ET AL.
horizontal displacements have been prevented (as in the shaking table tests). Gravitational load has also been applied. Moreover, in order to test the robustness of the proposed IM with respect to a modified structural response due to the soil-structure interaction (SSI), two different boundary conditions have been simulated using the CAMUS1 test case. In the first condition, the structure is projected onto a stiff rock site, and then the model is simply clamped at the base (CAMUS1 model). In the second condition, the structure is projected on a soft soil site (i.e., V S30 ¼ 270 m∕s), and then SSI is taken into consideration (CAMUS1-SSI). The SSI has been incorporated by means of an experimentally validated discrete linear model (Wolf 1988). This rheological (spring-dashpots-masses) model is able to reproduce the inertial soil-structure interaction (i.e., where superstructure masses and foundation transmit the inertial force to the soil, thus causing further soil deformation), as well as the radiative damping (i.e., wave radiation from the foundation to infinity). These two SSI effects reflect the possibility of displacement at the foundation level, a natural period change, and the capability of dissipating radiative energy. In the case of EC8-FRAME, a three-dimensional (3-D) seismic load (one vertical and two horizontal components) has been applied to the model clamped at the base. Gravitational load has also been applied. Structural demand is measured in the numerical models in terms of maximum interstory drift ratio (IDR), maximum global ductility demand (μmax ), and fundamental frequency drop (f D ). This last parameter has been chosen because, as demonstrated by Di Pasquale and Cakmak (1989), it provides a good measure of the average reduction in structural stiffness and therefore of the average damage. The frequency drop is evaluated by means of a fast Fourier transform analysis of the structure’s post-earthquake response under a white noise signal. In other words, following the earthquake record, the structure is excited by a white noise signal; next, the “softened” frequency is extracted by means of a frequency-domain analysis of the structural response to the applied white noise (for a detailed explanation of the method, see for instance Brincker et al. 2001 and Michel et al. 2010). The maximum global ductility demand is computed with respect to the first yielding point, which is evaluated through visual inspection of the capacity curve (Figure 3b). This last is obtained by means of a conventional pushover analysis (arbitrarily executed along the X-direction, Table 2, for the EC8-FRAME) of the test-case structures, which is performed disregarding P-delta effects. GROUND MOTION DATA SET
The ground motion data set used as input for the FE simulations has been extracted from the 2013 version of the RESORCE database (Akkar et al. 2013), which compiles ground motions recorded in Europe and nearby countries during the past several decades that are related to events with a moment magnitude (M w ) lying between 2 and 8. The records with moment magnitudes smaller than 4.5 and a hypocentral distance (Rhyp ) greater than 100 km have been excluded in order to focus on earthquake excitations of engineering significance. Selecting records with respect to soil type has not been considered an essential step (Singh 1985, Boore 2004, Bommer and Acevedo 2004). The conditional independence (i.e., sufficiency; Luco and Cornell 2007) of IMs with respect to the V S30 (i.e., shear
A SIMPLE AND EFFICIENT IM TO ACCOUNT FOR NONLINEAR STRUCTURAL BEHAVIOR
1411
(b)
(a)
Figure 3. (a) Capacity curves for the test-case structures; (b) close-up on both the first yielding points (circles) and the points with ductility demand μ ¼ 2 (squares).
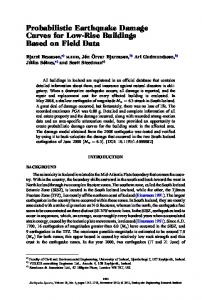
wave velocity in the upper 30 m) of records will be discussed below in the final section of this paper. The records (Figure 4) were then clustered for specific moment magnitude and hypocentral distance intervals. In theory, magnitude-dependent clustering implies a more realistic consideration of frequency content and the strong-motion duration of ground motions (Stewart et al. 2002, Bommer and Acevedo 2004). Two magnitude groups are described in order to account for the above facts: small magnitude (SM; 4.5 ≤ M w ≤ 6.0), and large magnitude (LM; 6.0 < M w ≤ 7.6). Records in the data set are also classified into two Rhyp bins: short distance (SR, 0 km < Rhyp ≤ 20 km), and large distance (LR, 20 km < Rhyp ≤ 100 km). No screening has been carried out to isolate “pulse-like” records. Finally, the 2,045 records composing the data set are divided into four bins, each with different magnitude and source-to-site distance intervals (Table 3).
Table 2. Numerical models: Natural participation factors
vibration modes, periods (frequencies) and
Structure
Mode
Description
Period (s)
Frequency (Hz)
qx
qy
qz
CAMUS1
1 2 3
Bending X Vertical Bending X
0.171 0.037 0.036
5.85 27.03 27.78
1.39 0.00 0.63
— — —
0.00 1.26 0.00
CAMUS1 SSI
1 2 3
Bending X Vertical Bending X
0.263 0.208 0.089
3.80 4.80 11.23
1.30 0.00 0.32
— — —
0.00 1.01 0.00
EC8 FRAME
1 2 3
Bending X Bending Y Torsion
0.636 0.629 0.483
1.57 1.59 2.07
1.21 0.00 0.00
0.00 1.31 0.12
0.0 0.0 0.0
1412
DE BIASIO ET AL.
8
10
7.5 7
1 PGA [m/s2]
Mw
6.5 6 5.5
0.1
0.01
5 4.5
0.001
4 1
10
100
1
10 R
RHYP [Km]
HYP
(a)
100 [Km]
(b)
Figure 4. Ground motions used in this study: (a) moment magnitude versus hypocentral distance; (b) PGA (geometric mean of the horizontal components) versus hypocentral distance.
Regarding the computation of IMs, for the one-dimensionally loaded CAMUS1 (and CAMUS1-SSI) structure, the first horizontal component of the aforementioned data set has been input into the FE simulations; hence, the IMs have been computed on such a single component. For the three-dimensionally loaded EC8-FRAME structure on the other hand, the IMs have been computed as the geometric mean of the two horizontal IM component values (Baker and Cornell 2006b). RESULTS ANALYSIS METHOD
To evaluate IM efficiency, the relationship between EDPs and IMs (whose values have been normalized) is written using a logarithmic transformation, as expressed in Equation 3, where a1 and a2 are constant coefficients and ei is a random variable representing the randomness in the relationship (Cornell et al. 2002): EQ-TARGET;temp:intralink-;e3;41;268
lnðEDPi Þ ¼ a1 þ a2 lnðIM i Þ þ ei
(3)
A linear least square (LLS) regression has been used to estimate regression coefficients a1 and a2 in Equation 3, whose term ei (called “residual”) represents the error between the computed and estimated values of EDPi . The validity of the LLS method requires the satisfaction of the normal distribution condition with a constant variance of the residual ei . Such a study data condition has been examined via residual versus fit plots (e.g., Figure 5) and quantilenormal plots of the residuals, both of which were found to be sound. Consequently, IM Table 3.
Number of records in each M w and Rhyp interval pair SR 0 km < Rhyp ≤ 20 km LR 20 km < Rhyp ≤ 100 km
SM 4.5 ≤ M w ≤ 6.0 LM 6.0 ≤ M w ≤ 7.6
403 34
1,286 322
A SIMPLE AND EFFICIENT IM TO ACCOUNT FOR NONLINEAR STRUCTURAL BEHAVIOR
1413
(a)
(b)
(c)
(d)
(e)
(f)
Figure 5. Damage records (μmax ≥ 2): Scatter plots, regression and logarithmic standard deviation (β) of the residual with respect to the maximum ductility demand for: (a) CAMUS1, Spa ð f 1 Þ; (b) CAMUS1, ASA40 ; (c) CAMUS1-SSI, Spa ð f 1 Þ; (d) CAMUS1-SSI, ASA40 ; (e) EC8-FRAME, Spa ð f 1 Þ; (f) EC8-FRAME, ASA40 .
efficiency could be evaluated by computing the standard deviation of residual ei between the computed and estimated values of EDPi (Baker and Cornell 2004); the lower the standard deviation, the higher the IM efficiency. In addition, IM sufficiency can be evaluated (Cornell 2004) by verifying whether residuals obtained from the regression carried out using the above statistical procedure show any dependence on other ground motion parameters (i.e., magnitude, source-to-site
1414
DE BIASIO ET AL.
distance, and V S30 ). In the absence of dependence, it is then possible to assume that these parameters do not affect the structural response for a given IM value. In other words, this finding implies that with respect to the EDP considered, the selected IM provides a sufficient description of the ground motion features affecting the structural response. Consequently, in order to assess IM sufficiency, a regression is performed between regression-residuals EDPs-IMs and M w , Rhyp , and V S30 . Next, attention is focused on the slope c of such a regression (Luco 2002); the statistical significance of the regression estimate of c on M w or Rhyp or V S30 , and thereby the sufficiency of IM can be quantified by the p-value (i.e., F-test) for the c estimate. The p-value is defined as the probability of finding an estimate of c at least as large (in absolute value) as that observed if, in fact, the true value of c is zero (Benjamin and Cornell 1970). Hence, a small p-value (i.e., less than 0.05) suggests that the estimated coefficient c on M w or Rhyp or V S30 is statistically significant, and therefore that IM is insufficient. However, the p-value analysis provides only a binary evaluation of the IM (i.e., sufficient or insufficient) without offering any indication concerning the degree of insufficiency, when this is detected. Therefore, in order to assess the “engineering significance” of the identified IM insufficiency, the rank correlation coefficient according to Spearman (1925) has been calculated between regression residuals EDPs-IMs and M w , Rhyp , and V S30 . The Spearman rank correlation coefficient between two variables X and Y is given by the following relation: P 6 Ni¼1 D2 ρSpearman ¼ 1 � (4) NðN 2 � 1Þ EQ-TARGET;temp:intralink-;e4;41;397
where D denotes the differences between the ranks of corresponding values of X i and Y i , and N is the number of pairs of values ðX; YÞ in the data set. Such a coefficient measures how well the data agree with the monotonic (whether linear or nonlinear) ranking; that is, it measures the “strength” of the relationship between the variables X and Y. In the case of a perfect positive correlation, the coefficient assumes a “1” value, whereas if the correlation is perfect negative, a “�1” value is assumed. Lastly, when the correlation is not perfect, it lies within the [�1; 1] interval; hence, the further the absolute value of the correlation coefficient from unity, the more sufficient the IM. IM EFFICIENCY COMPARISON
The results of the comparative statistical analysis on IM efficiency will first be presented with respect to the four ground motion bins (see Tables 4–6). With special attention on the performance of IMs in the case of nonlinear structural behavior, results will be presented (Table 7, Figure 5) with respect to the selected ground motions (among the four bins) capable of producing damage in the structure. These records have been identified as those able to generate maximum global ductility demand at least equal to 2, as computed relative to the first yielding point (Figure 3). Such a set of ground motions will hereinafter be referred to as “damage records.” For a comparison with the other IMs, ASAR has been computed with two R values: 20% and 40% (i.e., ASA20 and ASA40 ). Choosing an “optimal R value” will be addressed below in the final section of this paper.
A SIMPLE AND EFFICIENT IM TO ACCOUNT FOR NONLINEAR STRUCTURAL BEHAVIOR
Table 4.
CAMUS1: Logarithmic standard deviation of the residual Large magnitude
IM type
IM
ASA20 ASA40 Spa ðT1 Þ S� INP EPA ASI IH Amplitude-based PGA PGV Duration-based IA CAV SCAV aRMS IC Frequency response-based
Small magnitude
Short distance
Long distance
Short distance
Long distance
23 of 34
30 of 322
39 of 403
14 of 1,286
Damage records
Table 5.
1415
μmax IDR
fD 0.6 0.63 0.66 0.58 0.61 1.00 0.62 1.19 0.69 1.11 0.79 1.08 0.94 1.13 0.81
0.28 0.25 0.39 0.31 0.31 0.83 0.37 0.99 0.5 0.93 0.58 0.88 0.75 0.92 0.59
0.25 0.25 0.34 0.24 0.26 0.7 0.28 0.87 0.39 0.81 0.48 0.78 0.64 0.84 0.49
μmax IDR
fD 0.64 0.64 0.63 0.64 0.63 0.67 0.64 0.71 0.64 0.71 0.64 0.7 0.78 0.75 0.73
0.29 0.34 0.26 0.37 0.28 0.75 0.44 0.92 0.48 0.84 0.66 0.93 0.81 0.84 0.79
0.28 0.33 0.24 0.35 0.26 0.73 0.42 0.91 0.46 0.82 0.64 0.92 0.8 0.83 0.78
μmax IDR
fD 0.62 0.64 0.62 0.65 0.62 0.71 0.66 0.74 0.65 0.71 0.67 0.71 0.78 0.77 0.75
0.23 0.32 0.16 0.36 0.19 0.62 0.4 0.76 0.44 0.63 0.49 0.66 0.66 0.68 0.64
0.24 0.32 0.17 0.36 0.20 0.62 0.41 0.77 0.45 0.64 0.5 0.68 0.69 0.71 0.66
fD 0.29 0.29 0.29 0.29 0.29 0.29 0.29 0.29 0.29 0.29 0.29 0.29 0.29 0.28 0.28
μmax IDR 0.28 0.34 0.22 0.39 0.25 0.67 0.43 0.84 0.40 0.68 0.53 0.75 0.77 0.99 0.99
0.27 0.33 0.22 0.38 0.24 0.66 0.42 0.83 0.39 0.66 0.51 0.74 0.77 0.99 0.99
CAMUS1-SSI: Logarithmic standard deviation of the residual Large magnitude Short distance
Long distance
Short distance
Long distance
26 of 34
43 of 322
34 of 403
16 of 1,286
Damage records IM type
IM
ASA20 ASA40 Spa ðT1 Þ S� INP EPA ASI IH Amplitude-based PGA PGV Duration-based IA CAV SCAV aRMS IC Frequency response-based
Small magnitude
fD 1.45 1.52 1.36 1.56 1.38 1.99 1.41 2.19 1.59 2.12 1.63 1.88 1.74 2.16 1.72
μmax IDR 0.24 0.25 0.29 0.36 0.26 0.58 0.29 0.70 0.46 0.65 0.39 0.59 0.48 0.68 0.41
0.32 0.32 0.34 0.41 0.31 0.66 0.34 0.79 0.52 0.74 0.45 0.65 0.53 0.78 0.49
fD 1.35 1.37 1.34 1.39 1.35 1.5 1.37 1.63 1.41 1.61 1.44 1.64 1.82 1.71 1.65
μmax IDR 0.22 0.27 0.16 0.32 0.19 0.58 0.27 0.76 0.38 0.70 0.5 0.76 0.69 0.72 0.67
0.27 0.32 0.21 0.36 0.23 0.63 0.31 0.83 0.43 0.77 0.55 0.83 0.79 0.8 0.74
fD 1.35 1.36 1.34 1.36 1.34 1.40 1.36 1.47 1.43 1.4 1.42 1.48 1.64 1.63 1.60
μmax IDR 0.22 0.29 0.12 0.33 0.16 0.45 0.29 0.6 0.52 0.5 0.47 0.59 0.68 0.72 0.67
0.26 0.33 0.16 0.37 0.2 0.49 0.32 0.65 0.55 0.54 0.51 0.64 0.75 0.78 0.73
fD 0.77 0.77 0.77 0.77 0.77 0.78 0.77 0.78 0.77 0.78 0.78 0.78 0.78 0.76 0.74
μmax IDR 0.26 0.34 0.18 0.37 0.22 0.51 0.34 0.68 0.48 0.54 0.47 0.64 0.83 1.03 1.02
0.28 0.35 0.19 0.38 0.23 0.53 0.35 0.70 0.49 0.55 0.48 0.65 0.83 1.04 1.03
1416
Table 6.
DE BIASIO ET AL.
EC8-FRAME: Logarithmic standard deviation of the residual Large magnitude Short distance
Long distance
Short distance
Long distance
32 of 34
100 of 322
75 of 403
64 of 1,286
Damage records IM type
IM
ASA20 ASA40 Spa ðT1 Þ S� INP EPA ASI IH Amplitude-based PGA PGV Duration-based IA CAV SCAV aRMS IC Frequency response-based
Table 7.
Small magnitude
μmax IDR
fD 0.38 0.39 0.39 0.39 0.38 0.42 0.50 0.43 0.50 0.44 0.49 0.53 0.50 0.56 0.50
0.40 0.36 0.47 0.41 0.42 0.43 0.64 0.43 0.63 0.47 0.56 0.62 0.57 0.72 0.59
0.30 0.28 0.35 0.28 0.30 0.29 0.56 0.30 0.52 0.27 0.50 0.64 0.55 0.62 0.48
fD 0.58 0.59 0.58 0.61 0.57 0.61 0.69 0.68 0.70 0.70 0.64 0.76 0.82 0.79 0.76
μmax IDR 0.26 0.29 0.26 0.33 0.25 0.36 0.52 0.44 0.51 0.49 0.42 0.53 0.68 0.71 0.68
0.22 0.24 0.22 0.30 0.21 0.33 0.51 0.41 0.50 0.47 0.40 0.52 0.67 0.70 0.67
fD 0.63 0.63 0.63 0.64 0.63 0.69 0.81 0.66 0.87 0.70 0.79 0.76 0.93 0.91 0.89
μmax IDR 0.27 0.30 0.25 0.34 0.26 0.48 0.75 0.40 0.92 0.55 0.75 0.69 1.00 1.02 1.00
0.21 0.24 0.20 0.28 0.18 0.41 0.70 0.33 0.87 0.48 0.70 0.64 0.97 0.98 0.95
fD 0.51 0.52 0.51 0.52 0.51 0.52 0.55 0.52 0.55 0.52 0.54 0.53 0.53 0.53 0.52
μmax IDR 0.32 0.35 0.29 0.39 0.31 0.46 0.68 0.43 0.78 0.50 0.62 0.57 0.98 1.11 1.10
0.29 0.32 0.25 0.36 0.27 0.43 0.67 0.40 0.76 0.47 0.60 0.55 0.97 1.11 1.10
Damage records (μmax ≥ 2): Logarithmic standard deviation of the residual
Damage records IM type Frequency response-based
Amplitude-based Duration-based
CAMUS1
CAMUS1-SSI
EC8-FRAME
106
119
271
IM
fD
μmax
IDR
fD
μmax
IDR
fD
μmax
IDR
ASA20 ASA40 Spa ðT1 Þ S� INP EPA ASI IH PGA PGV IA CAV SCAV aRMS IC
0.25 0.23 0.31 0.27 0.26 0.33 0.26 0.36 0.29 0.34 0.30 0.34 0.33 0.36 0.29
0.45 0.36 0.52 0.39 0.42 0.52 0.38 0.58 0.46 0.55 0.44 0.54 0.51 0.59 0.42
0.36 0.29 0.41 0.31 0.34 0.39 0.29 0.43 0.35 0.42 0.34 0.41 0.39 0.45 0.33
0.27 0.28 0.33 0.36 0.30 0.39 0.32 0.43 0.38 0.42 0.35 0.43 0.40 0.45 0.34
0.22 0.22 0.28 0.31 0.24 0.37 0.27 0.42 0.36 0.40 0.33 0.43 0.40 0.45 0.32
0.22 0.21 0.28 0.29 0.23 0.34 0.26 0.40 0.35 0.38 0.32 0.41 0.38 0.43 0.31
0.25 0.24 0.32 0.3 0.26 0.33 0.53 0.34 0.52 0.36 0.44 0.52 0.49 0.66 0.63
0.27 0.28 0.31 0.33 0.28 0.34 0.49 0.36 0.48 0.38 0.42 0.49 0.46 0.60 0.58
0.36 0.36 0.38 0.38 0.36 0.39 0.47 0.4 0.47 0.41 0.44 0.47 0.44 0.52 0.50
A SIMPLE AND EFFICIENT IM TO ACCOUNT FOR NONLINEAR STRUCTURAL BEHAVIOR
1417
In considering Tables 4–6, PGA efficiency remains lower than that of PGV only in the long-period case of the EC8-FRAME structure. PGA is always less efficient than Spa ðT 1 Þ; an observation of the standard deviation of residuals, as obtained with respect to the three test cases, indicates that PGA efficiency is higher for shorter fundamental period structures, which could have been expected in as much as limT 1 →0 Spa ðT 1 Þ ¼ PGA. Among duration-based IMs, I A demonstrates the best performance; however, the efficiency of this IM class is typically lower than that of frequency response-based IMs. The IMs exhibiting the highest efficiency are in the structure-specific class, that is, those including information on the fundamental structure period (Spa , S� , I NP , and ASA40 ). IMs based solely on the ground motion time-history data show lower efficiency, which confirms that the total earthquake signal energy (to damage the structure) is not as important as the amount of energy the earthquake signal is able to transmit to the structure (Newmark and Hall 1982). Moreover, the superiority of this IM class has been confirmed by the Tan and Irfanoglu (2012) study, which is based on damage data stemming from inspections of thousands of American buildings following the 1994 Northridge earthquake. Among the frequency-based IMs, I H shows the weakest performance, except in the case of the low-frequency EC8-FRAME structure. These results are in agreement with the findings of Vona et al. (2011) on a similar frame building. When ground motions are unable to produce significant structural damage (i.e., the structure remains elastic), as is the case for the majority of bin records LM-LR, SM-SR, and SMLR, Spa ðT 1 Þ reveals a high correlation coefficient with both the interstory drift ratio and maximum ductility demand. Expressed another way, when the LM-SR bin (containing many records capable of producing relevant structural damage) is considered, Spa ðT 1 Þ efficiency drastically decreases, thus confirming that the pseudo-spectral acceleration at the fundamental period of the structure is a highly efficient IM, should the structure behave elastically or experience a small amount of nonlinearity. If such a condition is not satisfied (i.e., fragile structures and/or strong ground motions), then the Spa ðT 1 Þ efficiency declines significantly. In the case of S� and I NP , when coupled to Spa ðT 1 Þ, a factor accounting for the spectral shape within the period lengthening zone reveals an improvement in the performance of Spa ðT 1 Þ when considered alone. This improvement is more apparent in I NP , where the “shape factor” turns out to be less biased compared to the S� case, since it is being computed over multiple periods (three in this case) rather than over a single period. These results are in agreement with the findings of Buratti (2012) in its comprehensive comparative study. An observation of the correlation coefficients of EPA and ASI reveals the importance of the period (frequency) range considered when integrating the response spectrum. From Table 4, ASI has a higher efficiency with respect to EPA given its smaller integration interval more highly concentrated around the fundamental period of the structure. This same rationale can be applied to the results presented in Table 5. Nevertheless, when considering Table 6, ASI now shows less efficiency with respect to EPA (and, moreover, has one of the lowest efficiency among all IMs). The reason behind this performance decline is that in this latter case, the fundamental period of the structure lies outside the range considered in ASI yet still within the range considered by EPA.
1418
DE BIASIO ET AL.
Lastly, the ASAR introduced herein shows a slightly lower efficiency than Spa ðT 1 Þ when considering the non-damage record bins (LM-LR, SM-SR, and SM-LR). In these cases, the “intensity” of most ground motion is insufficient to produce structural damage, therefore inducing no frequency drop, while the formulation in Equation 1 of the ASAR introduces bias with relative to Spa ðT 1 Þ. This fact is highlighted by the higher performance of ASA20 on ASA40 . ASA40 , however, exhibits the highest efficiency when considering the LM-SR “damage” bin. When the analysis is restricted to only those records capable of damaging the structure, independently of the bin classification (Table 7), the ASA40 efficiency is seen to rise to 31% above that of Spa ðT 1 Þ when predicting maximum ductility demand (Figure 5) and to 26% and 29% higher when predicting frequency drop and maximum interstory drift, respectively. Moreover, in considering damage records, the ASA40 efficiency is typically higher than that of S� and I NP . Focusing on the average spectral acceleration over a well-defined frequency drop interval proves to be a better approach compared with coupling a spectrum “shape factor” to Spa ðT 1 Þ. IM SUFFICIENCY EVALUATION
Results of the comparative statistical analysis relative to IM sufficiency are presented in Table 8 for the 2,045 records composing the four ground motion bins; the values highlighted in bold are associated to p-values higher than 0.05 (i.e., sufficient IMs), while the reported numerical values correspond to the Spearman rank correlation coefficients (“strength” of the insufficiency, i.e., higher the absolute value, higher the insufficiency). Table 8. IM sufficiency: Spearman rank correlation coefficient (the considered EDP is μmax ). The values highlighted in bold are associated to p-values higher than 0.05 (i.e., sufficiency) CAMUS1 IM type Frequency response-based
Amplitude-based Duration-based
IM
Mw
ASA20 ASA40 Spa ðT1 Þ S� INP EPA ASI IH PGA PGV IA CAV SCAV aRMS IC
�0.10 �0.18 0.06 �0.23 �0.14 �0.26 �0.22 �0.20 �0.05 �0.22 �0.28 �0.23 0.12 0.22 0.20
Rhyp
CAMUS1-SSI V S30
�0.15 0.06 �0.22 0.12 0.01 −0.01 �0.26 0.15 �0.11 0.08 �0.45 0.22 �0.25 0.15 �0.54 0.21 �0.07 0.04 �0.44 0.19 �0.40 0.17 �0.59 0.21 �0.28 0.06 �0.33 0.02 �0.33 0.03
Mw
Rhyp
�0.10 �0.15 0.16 �0.19 �0.07 �0.20 0.09 �0.19 0.26 �0.13 �0.13 �0.18 0.30 0.37 0.35
�0.19 �0.26 0.09 �0.26 �0.10 �0.33 0.07 �0.47 0.15 �0.31 �0.21 �0.51 �0.13 �0.20 �0.19
V S30
EC8-FRAME Mw
0.06 0.01 0.09 �0.06 −0.01 0.07 0.15 �0.13 0.06 0.05 0.10 0.15 �0.06 0.43 0.14 �0.08 �0.13 0.50 0.06 0.16 −0.01 0.27 0.11 0.03 −0.04 0.53 −0.13 0.56 0.06 0.55
Rhyp
V S30
�0.12 �0.18 −0.03 �0.24 0.01 0.21 0.31 �0.10 0.30 0.18 0.20 �0.14 0.07 �0.02 �0.02
0.08 0.09 0.01 0.05 −0.01 �0.16 �0.22 −0.06 �0.23 �0.17 �0.19 −0.07 �0.15 −0.12 −0.13
A SIMPLE AND EFFICIENT IM TO ACCOUNT FOR NONLINEAR STRUCTURAL BEHAVIOR
1419
With the exception of some slight correlation for I H (Figure 6e) and EPA, an analysis of these results reveals no significant correlation between the frequency response-based IMs and M w or Rhyp . This lack of correlation indicates the sufficiency of this class of IMs (including ASAR ; see Figures 6a–6b) with regard to the magnitude and source-to-site distance. In contrast, a noticeable degree of insufficiency with respect to the moment magnitude has been exposed in the case of the low-frequency frame structure for SCAV, aRMS , I C , and PGA (Figure 6d). In addition, a perceptible degree of insufficiency with respect to distance has been shown in the case of CAMUS1 structures, for CAV (Figure 6f). Lastly, it is important to note that none of the considered IMs display a significant degree of insufficiency relative to soil type, that is, V S30 (Figures 6g–6i). OPTIMUM ASAR
Given that ASAR has been proposed for application to nonlinear RC structures, the results of analyses associated with the “damage records” will be considered herein for the purpose of
(a)
(b)
(c)
(d)
(e)
(f)
(g)
(h)
(i)
Figure 6. The sufficiency can be appreciated observing the slope of the regression line (lower the slope, higher the sufficiency): (a) CAMUS1 ASA40 versus M w ; (b) CAMUS1-SSI ASA40 versus Rhyp ; (c) CAMUS1, Spa ðf 1 Þ versus Rhyp ; (d) EC8-FRAME PGA versus Rhyp ; (e) CAMUS1 I H versus Rhyp ; (f) CAMUS1, CAV versus Rhyp ; (g) CAMUS1 ASA40 versus V S30 ; (h) CAMUS1SSI ASA40 versus V S30 ; and (i) EC8-FRAME, ASA40 versus V S30 .
1420
DE BIASIO ET AL.
40
30
20
10
0 10
20
30 40 Frequency drop
50 [%]
60
70
40 Max ductility demand
Max ductility demand
Max ductility demand
40
30
20
10
0
0
10
20 30 40 50 Frequency drop [%]
60
70
30
20
10
0
0
10
20 30 40 50 Frequency drop [%]
70
(c)
(b)
(a)
60
Figure 7. Damage records (μmax ≥ 2), frequency drop versus maximum ductility demand: (a) CAMUS1, (b) CAMUS1-SSI, and (c) EC8-FRAME.
(c)
(b)
(a)
Figure 8. Damage records (μmax ≥ 2), maximum interstory drift versus maximum ductility demand: (a) CAMUS1, (b) CAMUS1-SSI, and (c) EC8-FRAME.
establishing a general and optimal value of the reduction factor R in its definition (Equation 1). With respect to the previous results, the values of frequency drop and maximum ductility demand (as computed using the first yield) are given in Figure 7, which also exhibits the correlation between f D and μmax . The relationship between maximum ductility demand and the maximum interstory drift ratio is then shown in Figure 8. The good linear fit for the CAMUS1 test cases indicates a nearly uniform interstory drift distribution along the height of the structure (Ghobarah 2004). Table 9. residual
ASAR sensitivity study: damage records (μmax ≥ 2), standard deviation of the CAMUS1
IM ASA20 ASA30 ASA40 ASA50 ASA60
CAMUS1-SSI
EC8-FRAME
fD
μmax
IDR
fD
μmax
IDR
fD
μmax
IDR
0.25 0.24 0.23 0.23 0.24
0.45 0.41 0.36 0.35 0.35
0.36 0.32 0.29 0.28 0.27
0.27 0.27 0.28 0.30 0.32
0.22 0.21 0.22 0.24 0.26
0.22 0.21 0.21 0.23 0.24
0.25 0.23 0.24 0.25 0.26
0.27 0.27 0.28 0.29 0.30
0.36 0.35 0.36 0.36 0.37
A SIMPLE AND EFFICIENT IM TO ACCOUNT FOR NONLINEAR STRUCTURAL BEHAVIOR
20 15 10 5 0 0
10
20 30 40 50 Frequency drop [%]
60
70
25
Mean = 27.8 % Median = 23.8 %
20 15 10 5 0 0
10
20 30 40 50 Frequency drop [%]
60
70
80 Number of records
Mean = 39.9 % Median = 35.1 %
Number of records
Number of records
25
Mean = 27.6 % Median = 30 %
60
40
20
0 0
(b)
(a)
1421
10
20 30 40 50 Frequency drop [%]
60
70
(c)
Figure 9. Damage records (μmax ≥ 2), frequency drop distribution histograms: (a) CAMUS1, (b) CAMUS1-SSI, and (c) EC8-FRAME.
To proceed with selecting the reduced fundamental frequency (i.e., the R value in Equation 1), the ASAR has been computed for several reduction values R (i.e., ASA20 , ASA30 , ASA40 , ASA50 , and ASA60 ). It can be observed from Table 9 that ASA40 , with a reduction value (R) of 40%, yields a slightly higher efficiency for most considered test cases and EDPs. The mean and median of the frequency drop value distributions (Figure 9) confirm the results shown in Table 9. It must also be highlighted that a 40% frequency drop matches the mean values identified on RC buildings by both post-earthquake observations (Caltech 1975, Naeim 1988, Mucciarelli et al. 2004) and numerical studies (Crowley and Pinho 2004). Results of the sensitivity analysis, as supported by the literature, therefore encourage the authors to advise that a 40% fundamental frequency drop be considered as a general/optimal value in the definition of ASAR . Equation 1 then assumes the following form: ð 2.5 f 1 ASA40 ðf 1 Þ ¼ S ð f ; ξÞdf (5) f 1 0.6f 1 pa EQ-TARGET;temp:intralink-;e5;62;300
Similarly, Equation 2 assumes the form of Equation 6 below: ð 1.67·T 1 Spa ðT; ξÞ ASA40 ðT 1 Þ ¼ 2.5 · T 1 dT T2 T1 EQ-TARGET;temp:intralink-;e6;62;245
(6)
Ultimately, Equations 5 and 6 allow for the computation of ASA40 in only knowing the fundamental frequency (period) of the structure, as in the case of Spa ðT 1 Þ. CONCLUSION In the present paper, a new structure-specific IM, namely, the relative average spectral acceleration (ASAR ), has been proposed. ASAR is based on the pseudo-spectral acceleration values along a definite, structure-specific frequency range (period), with such a range covering the evolution of the structure’s fundamental frequency (period) caused by the ground motion–induced damage process.
1422
DE BIASIO ET AL.
The efficiency of ASAR has been revealed by means of comparative statistical analyses of the results of nonlinear dynamic simulations performed on two reinforced concrete structures on a database of recorded seismic ground motions. Among the considered IMs, ASAR exhibits the highest efficiency in determining damaging earthquake ground motion records; its efficiency rises to 31% higher compared with the more widely used Spa ðT 1 Þ. It has been shown that the ASAR efficiency is robust with respect to the type of building (load-bearing wall vs. frame; high vs. low frequency). The sufficiency of ASAR relative to magnitude, source-to-site distance, and soil type (V S30 ) has also been demonstrated by statistical analyses. Such sufficiency implies that if the ASAR of interest is given (through hazard analysis), then no concerns need to be raised regarding the M, R and V S30 of the records used in structural analyses, provided the selected records match the given ASAR value. Keep in mind that the scaling robustness of ASAR has not been explicitly investigated herein. As with Spa ðT 1 Þ, the ASAR can be computed by simply knowing the fundamental frequency (period) of the structure. This looser restriction offers a practical advantage when working with more complex structure-specific IMs. For an actual structure, the fundamental frequency (period) is indeed typically known, or else easy to know by means of in situ tests; for regular buildings, it can be roughly estimated using an empirical code-based approach. Furthermore, the simple formulation of ASAR , based exclusively on spectral pseudoacceleration values, allows for the performance of PSHA by employing the common ground motion prediction models currently available for Spa ðT 1 Þ. It must be emphasized however that such a procedure is computationally demanding as well as time consuming. The use of ASAR may be particularly advantageous when, due to location and/or structural design, the earthquake engineer expects a nonlinear structural behavior. Under such conditions, the high ASAR efficiency helps reduce the number of records needed to simulate the time-history response within a specified confidence interval. This advantage could be especially valuable when evaluating seismic retrofitting strategies since several solutions can be assessed, causing a significant increase in the number of analyses to be performed. Moreover, the ability of ASAR to predict the system response with the least scatter using the smallest number of response analyses could be valuable in the formulation of fragility. Nevertheless, the authors would like to underscore that ASAR has not yet been tested on structures, for example, on tall, low-frequency buildings, whose dynamic behavior has been shown to be strongly influenced by higher vibration modes. The analysis of such a case is the subject of ongoing research. In conclusion, due to its proven efficiency, sufficiency, robustness, and applicable formulation, ASAR can be considered as a worthy candidate in the near future for defining seismic hazard within the framework of probabilistic seismic risk analysis. ACKNOWLEDGMENTS Financial support for this research has been provided by the French Electric Utility Company (EDF), as part of the activities in Work Package 5 (WP5) of the International “SeIsmic Ground Motion Assessment” (SIGMA) program (partners: EDF, CEA, AREVA, ENEL),
A SIMPLE AND EFFICIENT IM TO ACCOUNT FOR NONLINEAR STRUCTURAL BEHAVIOR
1423
and this support is gratefully acknowledged. The authors would also like to thank Nicolas Humbert with EDF’s Hydraulic Engineering Division and Irmela Zentner with the company’s Research and Development Division for their valuable input and suggestions. Gratitude is also extended to Jacky Mazars at the University of Grenoble, as well as to Pierre Pegon and Paolo Negro at the European Joint Research Center, for providing data on the testcase structures. Lastly, the constructive comments submitted by two anonymous reviewers were highly appreciated and helped improve the quality of this manuscript.
REFERENCES Akkar, S., Sandıkkaya, M.A., S¸enyurt, M., Azari Sisi, A., Ay, B. Ö., Traversa, P., Douglas, J., Cotton, F., Luzi, L., Hernandez, B., and Godey, S., 2013. Reference database for seismic ground-motion in Europe (RESORCE), Bulletin of Earthquake Engineering 12, 311–399. Arias, A., 1970. A measure of earthquake intensity. Seismic design for nuclear power plants, MIT Press, Cambridge, MA, 438–469. Applied Technology Council (ATC), 1978. Tentative Provisions for the Development of Seismic Regulations for Buildings. ATC-3-06 Report, Redwood City, CA. Baker, J. W., and Cornell, C. A., 2004. Choice of a vector of ground motion intensity measures for seismic demand hazard analysis, 13th World Conference on Earthquake Engineering, Vancouver, Canada. Baker, J. W., and Cornell, C. A., 2006a. Spectral shape, epsilon and record selection, Earthquake Engineering and Structural Dynamics 35, 1077–1095. Baker, J. W., and Cornell, C. A., 2006b. Which spectral acceleration are you using? Earthquake Spectra 22, 293–312. Bazzurro, P., and Cornell, C. A., 2002. Vector-valued probabilistic seismic hazard analysis, in Proceedings of the 7th U.S. National Conference on Earthquake Engineering, Boston, MA. Benjamin, J., and Cornell, C. A., 1970. Probability, Statistics and Decisions for Civil Engineers, Mc-Graw Hill, New York. Bojorquez, E., and Iervolino, I., 2011. Spectral shape proxies and nonlinear structural response, Soil Dynamics and Earthquake Engineering 31, 996–1008. Bommer, J. J., and Acevedo, A. B., 2004. The use of real earthquake accelerograms as input to dynamic analysis, Journal of Earthquake Engineering 8, 43–49. Boore, D. M., 2004. Can site response be predicted, Journal of Earthquake Engineering 8, 1–41. Brincker, R., Zhang, L., and Andersen, P., 2001. Modal identification of output only systems using frequency domain decomposition, Smart Materials and Structures 10, 441–445. Buratti, N., 2012. A comparison of the performances of various ground-motion intensity measures, 15th World Conference on Earthquake Engineering, Lisbon, Portugal. California Institute of Technology (Caltech), 1975. Dynamic Response of Six Multistory Buildings during the San Fernando Earthquake, Report No. EERL 75-02. Conte, J. P., Pandit, H., Stewart, J. P., and Wallace, J. W., 2003. Ground motion intensity measures for performance based earthquake engineering, Ninth International Conference on Applications of Statistics and Probability in Civil Engineering (ICASP9), 6–9 July 2003, San Francisco, CA.
1424
DE BIASIO ET AL.
Cordova, P. P., Deierlein, G. G., Mehanny, S. S. F., and Cornell, C. A., 2001. Development of a two-parameter seismic intensity measure and probabilistic assessment procedure, 2nd U.S.-Japan Workshop on PBEE Methodology for Reinforced Concrete Building Structures. Cornell, C. A., 2004. Hazard, ground motions and probabilistic assessment for PBSD, Performance-Based Seismic Design Concepts and Implementation, International Workshop, 28 June–1 July 2004, Bled, Slovenia. Cornell, C. A., Jalayer, F., Hamburger, R. O., and Foutch, D. A., 2002. Probabilistic basis for 2000 SAC federal emergency management agency steel moment frame guidelines, Journal of Structural Engineering 128, 526–533. Crowley, H., and Pinho, R., 2004. Period-height relationship for existing European reinforced concrete buildings, Journal of Earthquake Engineering 8, 93–119. Deierlein, G. G., 2004. Overview of a comprehensive framework for earthquake performance assessment, Performances Based Seismic Design Concepts and Implementation, International Workshop, 28 June–1 July 2004, Bled, Slovenia. DiPasquale, E., and Cakmak, A. S., 1989. On the relation between global and local damage indices. Rep. No. NCEER-89-0034, National Center for Earthquake Engineering Research, State Univ. of New York, Buffalo, NY. Electric Power Research Institute (EPRI), 1988. A Criterion for Determining Exceedance of the Operating Basis Earthquake, EPRI NP-5930, Palo Alto, CA. Electric Power Research Institute (EPRI), 1991. Standardization of the Cumulative Absolute Velocity, EPRI TR-100082, Palo Alto, CA. Eurocode 8 (EC8), 1988. Eurocode 8: Structure in Seismic Regions Design, Part 1: General and Building, May 1988 edition, Report EUR 12266 EN, Commission of the European Communities. Fontara, I. K. M., Athanatopoulou, A. M., and Avramidis, I. E., 2012. Correlation between advanced, structure-specific ground motion intensity measures and damage indices, 15th World Conference on Earthquake Engineering, Lisbon 2012. Ghobarah, A., 2004. On drift limits associated with different damage levels, Performance Based Seismic Design Concepts and Implementation, International Workshop, 28 June–1 July 2004, Bled, Slovenia. Housner, G. W., 1959. Behavior of structures during earthquakes, in Selected Earthquake Engineering Papers of George W. Housner, American Society of Civil Engineers, Reston, VA, 283–303. Housner, G. W., and Jennings, P. C., 1964. Generation of artificial earthquakes, Journal of the Engineering Mechanics Division 90, Proceedings Paper 3806. Inoue, T., and Cornell, C. A., 1990. Seismic hazard analysis of multi-degree-of-freedom structures. Reliability of marine structures, RMS-8. Stanford, CA; 1990. International Atomic Energy Agency (IAEA), 2011. Nonlinear Response to a Type of Seismic Input Motion, IAEA-TECDOC-1655, Vienna, Austria. Joint Research Centre (JRC), 1994. Tests on a Four-Storey Full-Scale R/C Frame Designed According to Eurocodes 8 and 2: Preliminary Report, EUR 15879, Ispra, Italy. Kennedy, R. P., Wesley, D. A., and Tong, W. H., 1988. Probabilistic Evaluation of the Diablo Canyon Turbine Building Seismic Capacity Using Nonlinear Time History Analysis, Pacific Gas & Electric Company 1988, Report 1643.1. La Borderie, C., Mazars, J., and Pijaudier-Cabot, G., 1994. Damage mechanics model for reinforced concrete structures under cyclic loading, ACI 134, 147–172.
A SIMPLE AND EFFICIENT IM TO ACCOUNT FOR NONLINEAR STRUCTURAL BEHAVIOR
1425
Luco, N., 2002. Probabilistic Seismic Demand Analysis, SMRF Connection Fractures, and Near-Source Effects, Ph.D. Thesis, Stanford University, Stanford, CA. Luco, N., and Cornell, C. A., 2007. Structure-specific scalar intensity measures for near-source and ordinary earthquake ground motions, Earthquake Spectra 23, 357–392. Masi, A., Vona, M., and Mucciarelli, M., 2011. Selection of natural and synthetic accelerograms for seismic vulnerability studies on reinforced concrete frames, Journal of Structural Engineering 137, 367–378. Menegotto, M., and Pinto, P. E., 1973. Method of analysis for cyclically loaded r. c. plane frames including changes in geometry and non-elastic behavior of elements under combined normal force and bending, Preliminary Report, IABSE Symposium: Resistance and Ultimate Deformability of Structures Acted on by Well Defined Repeated Loads - IABSE, Vol. 13, Lisbon, Portugal. Michel, C., Guéguen, P., El Arem, S., Mazars, J., and Kotronis, P., 2010. Full-scale dynamic response of an RC building under weak seismic motions using earthquake recordings, ambient vibrations and modeling, Earthquake Engineering and Structural Dynamics 39, 419–441. Mucciarelli, M., Masi, A., Gallipoli, M. R., Harabaglia, P., Vona, M., Ponzo, F., and Dolce, M., 2004. Analysis of RC building response and soil-building resonance based on data recorded during a damaging earthquake (Molise, Italy, 2002), Bulletin of the Seismological Society of America 94, 1943–1953. Naeim, F., 1998. Research overview: Seismic response of structures, The Structural Design of Tall Buildings 7, 195–215. Newmark, N. M., and Hall, W. J., 1982. Earthquake Spectra and Design, Monographs Series, Earthquake Engineering Research Institute, Oakland, CA. Office of Nuclear Regulatory Research (NUREG), 1984. Engineering characterization of ground motion, Task 1:Effects of characteristics of free-field motion on structural response, U.S. NUREG/CR-3805, Vol. 5. Office of Nuclear Regulatory Research (NUREG), 1986. Engineering characterization of ground motion, Task 2: Summary report, U.S. NUREG/CR-3805, Vol. 5. Park, Y. J., Ang, A. H. S., and Wen, Y. K., 1985. Seismic damage analysis of reinforced concrete buildings, Journal of Structural Engineering 111, 740–757. Porter, K., 2003. An overview of PEER’s performance-based earthquake engineering methodology, Ninth International Conference on Applications of Statistics and Probability in Civil Engineering (ICASP9), 6–9 July 2003, San Francisco, CA. Powell, G. H., 2010. Modeling for structural analysis. Computers and Structures Inc., Berkeley, California, USA. Singh, J. P., 1985. Earthquake Ground Motions: Implications for Designing Structures and Reconciling Structural Damage. Earthquake Spectra: February 1985, Vol. 1, No. 2, pp. 239–270. Spacone, E., Filipou, F. C., and Taucer, F., 1996. Fibre beam-column model for non-linear analysis of R/C frames: Part 1. Formulation, Earthquake Engineering and Structural Dynamics 25, 711–725. Spearman, C., 1925. Some issues in the theory of “g” (including the law of diminishing returns), Nature 116, 436–439. Stewart, J. P., Chiou, S. J., Bray, J. D., Graves, R. W., Somerville, P. G., and Abrahamson, N. A., 2002. Ground motion evaluation procedures for performance-based design, Soil Dynamics and Earthquake Engineering 22, 765–772.
1426
DE BIASIO ET AL.
Takanashi, K., 1975. Nonlinear earthquake response analysis of structures by a computer-actuator on-line system, Bull. Of Earthquake Resistant Structure Research Center 8, Inst. of Ind. Science, Univ. of Tokyo. Tan, A., and Irfanoglu, A., 2012. Correlation between ground motion based shaking intensity estimates and actual building damage, 15th World Conference on Earthquake Engineering, Lisbon, Portugal. Von Thun, J. L., Rochim, L. H., Scott, G. A., and Wilson, J. A., 1988. Earthquake ground motions for design and analysis of dams, Earthquake Eng. Soil Dyn. II—Recent Advances in Ground-Motion Evaluation (GSP 20), ASCE, New York, 463–481. Wolf, J., 1988. Soil-Structure-Interaction Analysis in Time Domain, Prentice Hall International Series, Englewood Cliffs, NJ. (Received 6 January 2014; accepted 26 July 2014)