Hikiji_jatsep10.qxd:JATLynneTemplate
8/9/10
4:57 PM
Page 1
Journal of Analytical Toxicology, Vol. 34, September 2010
A Simple and Sensitive Method for the Determination of Propofol in Human Solid Tissues by Gas Chromatography–Mass Spectrometry* Wakako Hikiji, Keiko Kudo, Yosuke Usumoto, Akiko Tsuji, and Noriaki Ikeda† Department of Forensic Pathology and Sciences, Graduate School of Medical Sciences, Kyushu University, Fukuoka 812-8582, Japan
Abstract Propofol is a widely used intravenous agent for induction and maintenance of anesthesia and for sedation in intensive care patients, but it is also associated with abuse and dependency. A simple and sensitive method for the determination of propofol in human whole blood, brain, liver, and adipose tissue by gas chromatography–mass spectrometry using selected-ion monitoring mode is described. Propofol was extracted from 0.2-mL or 0.2-g sample size by a single-step basic extraction procedure using 100 µL heptane with thymol (50 ng) as an internal standard. The calibration curves of the specimens were linear in the concentration range of 10–5000 ng/mL or ng/g, and the limit of detection was 2.5 ng/mL in blood, 5.0 ng/g in brain and liver, and 10 ng/g in adipose tissue. Absolute recovery of propofol was determined in three samples and averaged over 95% for blood and brain, 66% for liver, and 51% for adipose tissue. Within-day and between-day precision was measured in five samples each at 50 and 500 ng/mL or ng/g in all specimens and was determined to be less than 10%. The developed propofol method was applied to a forensic autopsy case where a suspected propofol misinjection occurred eight days prior to death, and the tissue analysis was vital to the case.
Introduction Propofol, 2,6-diisopropylphenol, is a highly lipophilic agent with a fast onset and short duration of narcotic effect due to its fast redistribution. It is a commonly used intravenous agent for the induction and maintenance of anesthesia and for the sedation of intensive care patients worldwide (1,2). On the other hand, a number of cases have been reported involving abuse and dependency due to the euphoric feelings and relaxing effects of propofol (2–8), some of which are fatal (3–6). * Part of this work was presented at the 2009 TIAFT meeting in Geneve, Switzerland. † Author to whom correspondence should be addressed. Email:
[email protected].
As well as accidental overdose, there are also published cases in which propofol was used for suspected suicide and homicide (9–13). Numerous analytical techniques designed for the detection, identification, and quantification of propofol using gas chromatography–mass spectrometry (GC–MS) (5,11,12,14–16) or high-performance liquid chromatography (HPLC) (13,17–21) have been reported to date. However, only a few methods are applicable for use with solid tissues (4,5,11– 13), especially for the quantification of propofol in the magnitude of nanograms per gram. Kranioti et al. (4) was successful in quantifying 560 ng/g of propofol in liver, which is the lowest propofol concentration in solid tissues to be reported. Analysis of propofol in solid tissues becomes important when time has passed after ingestion because of its rapid redistribution, conjugation, and elimination. To the authors’ knowledge, literature has not been published on the analyses of specimens collected several days after the non-chronic propofol infusion. Furthermore, studies of selectivity, linearity, detection limit, accuracy, and recovery focused on solid tissues are quite limited. The objective of this study was to develop a simple and reliable method for the quantitative determination of low nanogram-per-gram concentrations of propofol in solid tissues by GC–MS. The applicability of the developed method was demonstrated by analyzing samples from a forensic autopsy case in which a suspected propofol misinjection was made eight days before the death of a victim.
Experimental Reagents and standard solutions
Propofol, thymol, and n-heptane were purchased from Wako Pure Chemical Industries (Osaka, Japan). Diazepam-d5 used for retention-time locking for GC–MS was purchased from Lipomed (Cambridge, MA). The other chemicals were of
Reproduction (photocopying) of editorial content of this journal is prohibited without publisher’s permission.
389
Hikiji_jatsep10.qxd:JATLynneTemplate
8/9/10
4:57 PM
Page 2
Journal of Analytical Toxicology, Vol. 34, September 2010
analytical reagent grade. Separate 1.0 mg/mL stock solutions of propofol and thymol were created by dissolving 5 mg in 5 mL heptane. Working stock solutions, 0.1 and 0.01 mg/mL of each, were made from the stock solution of each substance. Preparation of biological samples for quantification
Human tissue samples, such as blood, liver, brain, and adipose tissue, obtained at the time of autopsy were stored at –20°C until analysis, and propofol- and thymol-free tissue samples were used for making control samples and calibrators. Drug-free blood, brain, liver, and adipose tissue samples were supplemented with propofol at the concentrations of 0, 10, 50, 100, 500, and 1000 ng/mL or ng/g for the preparation of the calibration curve. Extraction procedure
programmed to 300°C at a rate of 20°C/min; this temperature was maintained for 5 min. The injection port and transfer line temperatures were 250 and 280°C, respectively. The carrier gas was helium, and the constant pressure mode was used. The retention times were fixed using the retention-time locking technique with diazepam-d5 as the locking compound. The retention time of diazepam-d5 was set to 13.9231 min. The GC–MS was operated in the selected-ion monitoring (SIM) mode where ions m/z 163, 178 were acquired for propofol and ions m/z 135, 150 for the IS (quantification ion underlined). Calibration curve, limit of detection, recovery, withinand between-day precision, and accuracy
The calibration curves were obtained by plotting the peakarea ratio of propofol to IS versus the amount of propofol. The limit of detection of the assay, defined as the amount of propofol yielding a signal-to-noise ratio of 3, was determined by
Peeters and co-workers’ (14) extraction and isolation method was modified as follows. Liver, brain, and adipose tissue samples (0.2 g each) were finely sliced and mixed with 1 mL of 0.2 M potassium chloride/0.2 M sodium hydroxide buffer (adjusted to pH 12.4) in a round-bottom centrifuge tube (10 mL volume), and then the samples were homogenized using a homogenizer POLYTRON PT3100 (KINEMATICA SG, LittauLuzern, Switzerland). Blood sample (0.2 mL) was only mixed with 1 mL of the same buffer. The mixture was transferred to a polypropylene tube (2-mL volume), Figure 1. Mass spectra of propofol (A) and thymol (B). and 50 ng of thymol as internal standard (IS) and 100 µL of heptane were added. The solution was thoroughly mixed on a vortex mixer for 10 s and centrifuged at 1500 × g for 5 min to separate the phases. The mixture was kept at –20°C for 20 min. The organic layer obtained was then transferred to an injection vial, and a 2-µL aliquot of the solution was injected into the GC–MS. Blood, tissue calibrators, and controls were also extracted as described earlier and submitted to GC–MS. GC–MS conditions
The instrumentation utilized for the propofol analysis was an Agilent (Santa Clara, CA) 6890 GC combined with an Agilent 5973 MS in electron impact mode. An HP-5MS fused silica capillary column (30 m × 0.25-mm i.d., 0.25-µm film thickness) coated with 5% phenyl/95% methylsilicone stationary phase was used. Splitless injection mode was selected with a valve off-time of 2 min. The GC–MS conditions were as follows: the initial temperature 60°C was held for 2 min, the temperature was then
390
Figure 2. SIM chromatograms of the extract from blood sample containing propofol (50 ng/mL) and thymol (250 ng/mL).
Hikiji_jatsep10.qxd:JATLynneTemplate
8/9/10
4:57 PM
Page 3
Journal of Analytical Toxicology, Vol. 34, September 2010
measuring a control sample of all tissue specimens (n = 2). Absolute recovery was calculated by comparing the peak area of extracted propofol in quality control samples (n = 3) containing 50 and 500 ng/mL or ng/g propofol after the extraction procedure with corresponding propofol standard. Within-day and between-day precision in each tissue was measured as relative standard deviation at two concentrations, 50 and 500 ng/mL or ng/g (n = 5). Accuracy was measured as the percent deviation from the nominal concentration.
amount of organic solvent to increase recovery and minimize the risk of propofol loss due to the volatile nature of propofol. Several extraction solvents, heptane, ethyl acetate, and methyl tert-butyl ether were examined. Heptane was found to be the most suitable solvent because it made a clean extraction and a
Results and Discussion Extraction procedure
Several methods have been published previously for the extraction of propofol in human solid tissues. IwansenBergmann et al. (5) used the supernatant of tissue homogenate to extract 7.6–27 µg/g of propofol in brain and liver samples with cyclohexane for GC–MS analysis. However, this method was not applicable to the detection of low nanogram-permilliliter concentrations of propofol in tissue samples, as extraction recovery from supernatant was relatively low. Another published approach was mixing the digested solution of tissue homogenate with acetonitrile, then submitting it to HPLC for the analysis of propofol in the order of microgram-per-gram (4,13). This method was simple, but selectivity and sensitivity were not suitable for the quantification of propofol in order of nanogram-per-gram in tissue samples. Another simple method was introduced by Klausz et al. (3), but it involved an evaporating process of the organic layer, which the authors believe significantly increased the risk of substance loss when quantifying a volatile substance in the order of nanogram-per-gram. Headspace GC analysis was used by Chao et al. (12) for the detection of propofol in liver, kidney, and brain in the order of microgram-per-gram, but its sensitivity was not suitable for the detection of the substance in the order of nanogram-per-gram. The solid-phase extraction using Focus column by the authors’ previously published procedure (22) was also examined, but extraction recovery from solid tissue samples was relatively low. Therefore, the authors finally selected a single-step liquid–liquid extraction with a small
Figure 3. SIM chromatograms of the extract from liver sample containing propofol (50 ng/mL) and thymol (250 ng/mL).
Figure 4. SIM chromatograms of the extract from brain sample containing propofol (50 ng/mL) and thymol (250 ng/mL).
391
Hikiji_jatsep10.qxd:JATLynneTemplate
8/9/10
4:57 PM
Page 4
Journal of Analytical Toxicology, Vol. 34, September 2010
clear separation from tissue homogenate possible. As for IS, thymol was chosen, as it was the most common IS used for the analysis of propofol by GC–MS in published literature. Series of pH (9.0, 10.0, 11.0, 12.0, 12.4, and 12.8) were examined and adjustment of buffer to pH 12.4 was found to be suitable as high recovery, and the most stable peak area of thymol were both obtained at this pH. Although the authors used only 100 µL of heptane for the extraction of a trace amount of propofol in solid tissues, a larger amount of heptane may be used for the quantification of propofol in the order of microgram-per-gram to protect the column from contamination, especially when analyzing adipose tissue samples. The authors opted to freeze the specimen at –20°C for 20 min, even though a clear separation of the specimen into two layers could be achieved after the centrifuging process.
This is because it was technically challenging to selectively collect the top layer when the whole solution was a liquid, as the aliquot is only 100 µL in volume. The freezing process made the bottom layer solid, while the top layer remained liquid, which enabled an easier transfer of the top organic layer from the specimen tube to an injection vial. Determination of propofol in blood, brain, liver, and adipose tissue
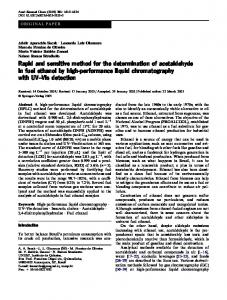
Electron impact (EI) mass spectra of propofol and IS are shown in Figure 1. Figures 2–5 show the SIM chromatograms of the extracts from whole blood, brain, liver, and adipose tissue spiked with 50 ng/mL or ng/g of propofol and 250 ng/mL or ng/g of IS and those from control samples containing only IS. Propofol and IS gave sharp peaks eluting at 7.52 and 6.97 min, respectively, and no interfering peaks were observed in the chromatograms of blank tissues. The calibration curves were linear in the concentration range from 10 to 5000 ng/mL or ng/g with correlation coefficients over 0.99. Linear regression analysis gave the equations y = 0.015x + 0.0653, r 2 = 0.9986 (blood), y = 0.0064x – 0.0845, r 2 = 0.9989 (liver), y = 0.012x – 0.4261, r 2 = 0.9988 (brain), and y = 0.0085x – 0.3594, r 2 = 0.9951 (adipose tissue), where x = the analyte concentration (ng/mL or ng/g) and y = peak-area ratio. Given the specimen of 0.2 mL or 0.2 g, the lower limit of detection for propofol was 2.5 ng/mL for blood, 5 ng/g for liver and brain, and 10 ng/g for adipose tissue. Published literature provides some very low limits of detection of propofol in biological fluids, the lowest being 2 ng/mL in cerebrospinal fluid using a volume of 0.5 mL of biological sample by Peeters et al. Figure 5. SIM chromatograms of the extract from adipose tissue sample containing propofol (50 ng/mL) (14) and 3 ng/mL in plasma and 5 ng/mL and thymol (250 ng/mL). in whole blood using a volume of 0.5 mL of sample for each by Cussonneau et al. (17); but no data on various human tisTable I. The Absolute Recovery, Within-Day and Between-Day Precision, and sues could be found. In comparison, the Accuracy of the Developed Propofol Determination Method validated method presented provided the lowest limit of detection for blood at 2.5 Within-Day (n = 5) Between-Day (n = 5) ng/mL and also determined a limit of deAbsolute Recovery tection for human solid tissues with only Amount Added (n = 3) CV Accuracy CV Accuracy Sample (ng/mL or ng/g) (%) (%) (%) (%) (%) 0.2 mL or 0.2 g of sample volume. The recovery of propofol supplemented Blood 500 109.8 5.1 100.2 3.5 102.3 at 50 and 500 ng/mL or ng/g in each 50 105.8 4.9 105.3 6.5 107.7 specimen was greater than 95% for blood Liver 500 68.0 7.0 100.1 4.8 97.1 and brain, greater than 65% for liver, and 50 65.5 3.2 104.4 6.2 101.9 greater than 50% for adipose tissue. The Brain 500 97.5 0.9 103.6 4.7 101.4 relative standard deviations of within-day 50 112.6 4.7 100.8 9.8 96.9 and between-day precision in each tissue Fat 500 50.9 5.3 97.0 7.7 99.8 were below 7% and 10%, respectively, in 50 52.6 4.8 103.6 5.9 101.7 all tissue samples. The accuracy was
392
Hikiji_jatsep10.qxd:JATLynneTemplate
8/9/10
4:57 PM
Page 5
Journal of Analytical Toxicology, Vol. 34, September 2010
within 8% of nominal concentrations in all tissues. These results are all shown in Table I. Application to a forensic autopsy case
The developed method was applied to the analysis of specimens from a forensic autopsy case. The deceased was a 68year-old man who received a misinjection of 500 mg of propofol intravenously without ventilatory assistance by a member of medical staff. He was found by a family member in a state of apnea due to the respiratory depressant effect of propofol and died eight days later. The corpse was brought to the authors’ department for a medico-legal autopsy and laboratory investigation. The autopsy revealed that his death is caused by multiple organ failure due to hypoxia induced by the injection of propofol. Propofol was detected in the blood, liver, brain, and adipose tissue of the corpse by the developed method, proving ingestion of the drug. The measured propofol concentrations were 26.8 ng/mL in blood, 10.4 ng/g in liver, 129.6 ng/g in brain, and 2023 ng/g in adipose tissue. The relatively high propofol concentration in brain compared to that in blood would represent the equilibrium between brain and blood. Also, the relatively high propofol concentration in brain and adipose tissue is compatible to the characteristic of propofol, a lipophilic agent, which has a high affinity to lipophilic tissues. To the authors’ knowledge, this is the first study on the concentration of propofol in various human solid tissues, including adipose tissue. Furthermore, it was also demonstrated that adipose tissue is a suitable specimen for an analysis carried out several days after the ingestion of propofol, a liphophilic agent, by the application of the developed method.
Conclusions A simple, sensitive, and accurate method was established for the determination of propofol in a small amount (0.2 mL or 0.2 g) of solid tissues. This well-validated procedure was applicable to the analysis of specimens from a forensic autopsy case containing low nanogram-per-milliliter concentrations of propofol.
References 1. P.E. Marik. Propofol: therapeutic indications and side-effects. Curr. Pharm. Des.10: 3639–3649 (2004). 2. A. Roussin, J.L. Montastruc, and M. Lapeyre-Mestre. Pharmacological and clinical evidences on the potential for abuse and dependence of propofol: a review of literature. Fundam. Clin. Pharmacol. 21: 459–465 (2007). 3. G. Klausz, K. Róna, I. Kristóf, and K. Töro. Evaluation of a fatal propofol intoxication due to self administration. J. Forensic Leg. Med. 16: 287–289 (2009). 4. E.F. Kranioti, A. Mavroforou, P. Mylonakis, and M. Michalodimitrakis. Lethal self administration of propofol (Diprivan). A case report and review of the literature. Forensic Sci. Int. 167: 56–58 (2007).
5. S. Iwersen-Bergmann, P. Rösner, H.C. Künau, M. Junge, and A. Schmoldt. Death after excessive propofol abuse. Int. J. Legal Med. 114: 248–251 (2001). 6. J.W. Follette and W.J. Farley. Anesthesiologist addicted to propofol. Anesthesiol. 77: 817–818 (1992). 7. U. Schneider, D. Rada, J.D. Rollnik, T. Passie, and H.M. Emrich. Propofol dependency after treatment of tension headache. Addict. Biol. 6: 263–265 (2001). 8. B. Balasubramaniam and G.R. Park. Sexual hallucinations during and after sedation and anaesthesia. Anaesthesia 58: 549–553 (2003). 9. R.R. Kirby, J.M. Colaw, and M.M. Douglas. Death from propofol: accident, suicide or murder? Anesth. Analog. 108: 1182–1184 (2009). 10. A. Roussin, M. Mirepoix, G. Lassabe, V. Dumestre-Touret, V. Gardette, J.L. Monstastruc, and M. Lapeyre-Mestre. Lethal mixed intoxication with propofol at therapeutic dose range. Brit. J. Anaesth. 97: 268 (2006). 11. V. Cirimele, P. Kintz, S. Doray, and B. Ludes. Determination of chronic abuse of the anaesthetic agents midazolam and propofol as demonstrated by hair analysis. Int. J. Leg. Med. 116: 54–57 (2002). 12. T.C. Chao, D.S.T. Lo, P.P.S. Chui, and T.H. Koh. The first fatal 2,6-di-isopropylphenol (propofol) poisoning in Singapore: a case report. Forensic Sci. Int. 66: 1–7 (1994). 13. O.H. Drummer. A fatality due to propofol poisoning. J. Forensic Sci. 37: 1186–1189 (1992). 14. M.Y.M. Peeters, H. Kuiper, B. Greijdanus, J. van der Naalt, C.A.J. Knibbe, and D.R.A. Uges. Gas chromatography–mass spectrometric assay for propofol in cerebrospinal fluid of traumatic brain patients. J. Chromatogr. B 853: 635–639 (2007). 15. J. Guitton, M. Desage, A. Lepape, C.S. Degoute, M. Manchon, and J.L. Brazier. Quantitation of propofol in whole blood by gas chromatography–mass spectrometry. J. Chromatogr. B Biomed. Appl. 669: 358–365 (1995). 16. P.L. Stetson, E.F. Domino, and J.R. Sneyd. Determination of plasma propofol levels using gas chromatography–mass spectrometry with selected ion monitoring. J. Chromatogr. 620: 260– 267 (1993). 17. X. Cussonneau, E. De Smet, K. Lantsoght, J.-P. Salvi, M. BolonLanger, and R. Boulieu. A rapid and simple HPLC method for the analysis of propofol in biological fluids. J. Pharm. Biomed. Anal. 44: 680–682 (2006). 18. C.A.J. Knibbe, V.S. Koster, V.H.M. Ceneer, R.M. Stuurman, P.F.M. Kuks, and R. Lange. Determination of propofol in low-volume samples by high-performance liquid chromatography with fluorescence detection. J. Chromatogr. B 706: 305–310 (1998). 19. R.H. Dowrie, W.F. Ebling, J.W. Mandema, and D.R. Stanski. Highperformance liquid chromatographic assay of propofol in human and rat plasma and fourteen rat tissues using electrochemical detection. J. Chromatogr. B 678: 279–288 (1996). 20. G. Mazzi and M. Schinella. Simple and practical high-performance liquid chromatographic assay of propofol in human blood by phenyl column chromatography with electrochemical detection. J. Chromatogr. 528: 537–541(1990). 21. A.L. Dawidowicz and A. Fijalkowska. Determination of propofol in blood by HPLC. Comparison of the extraction and precipitation methods. J. Chromatogr. Sci. 33: 377–382 (1995). 22. K. Kudo, T. Ishida, W. Hikiji, M. Hayashida, K. Uekusa, Y. Usumoto, A. Tsuji, and N. Ikeda. Construction of calibrationlocking database for rapid and reliable screening by gas chromatography–mass spectrometry. Forensic Toxicol. 27: 21–31 (2009).
Manuscript received January 8, 2010; revision received April 5, 2010.
393