Experimental Cell Research 256, 328 –337 (2000) doi:10.1006/excr.2000.4810, available online at http://www.idealibrary.com on
RAPID COMMUNICATION A Simple Method for Accurate Estimation of Apoptotic Cells Narendra P. Singh 1 Department of Bioengineering, Box 357962, University of Washington, Seattle, Washington 98195
A simple, sensitive, and reliable “DNA diffusion” assay for the quantification of apoptosis is described. Human lymphocytes and human lymphoblastoid cells, MOLT-4, were exposed to 0, 12.5, 25, 50, or 100 rad of X-rays. After 24 h of incubation, cells were mixed with agarose, microgels were made, and cells were lysed in high salt and detergents. DNA was precipitated in microgels by ethanol. Staining of DNA was done with an intense fluorescent dye, YOYO-1. Apoptotic cells show a halo of granular DNA with a hazy outer boundary. Necrotic cells, resulting from hyperthermia treatment, on the other hand, show an unusually large homogeneous nucleus with a clearly defined boundary. The number of cells with apoptotic and necrotic appearance can be scored and quantified by using a fluorescent microscope. Results were compared with other methods of apoptosis measurement: morphological estimations of apoptosis and DNA ladder pattern formation in regular agarose gel electrophoresis. Validation of the technique was done using some known inducers of apoptosis and necrosis (hyperthermia, hydrogen peroxide, mitoxantrone, novobiocin, and sodium ascorbate). © 2000 Academic Press Key Words: DNA diffusion; microgel; apoptosis; lymphocyte; MOLT-4; X rays; thymus; brain.
INTRODUCTION
Apoptosis (Ptosis ⫽ tosis ⫽ dropping off, Greek) or “programmed cell death” in the tissues of an organism is not associated with inflammation or scarring, unlike necrosis (meaning dead, Greek). Apoptosis is a normal event that occurs both during and after development. It is an important and inevitable event in the remodeling of tissues during development and aging [1, 2]. This phenomenon occurs in cells injured by certain levels of toxic agents. It is also a crucial process for eliminating cancer cells [3]. The importance of studying apoptosis in aging and age-related disorders has 1
Address for correspondence and reprint requests: Department of Bioengineering, Box 357962, University of Washington Seattle, WA 98195-7962. Fax: (206) 685-2060. E-mail:
[email protected]. 0014-4827/00 $35.00 Copyright © 2000 by Academic Press All rights of reproduction in any form reserved.
been recognized by many scientists [4 – 6]. Apoptosis may be a feature of neurodegenerative diseases such as Alzheimer’s, Parkinson’s, and amyotropic lateral sclerosis [7, 8]. In most postreplicating cells the rate of apoptosis increases with age and thus may be a factor in many age-related diseases including that of the heart [9, 10] and kidney [11]. Apoptosis is also thought to be responsible for the depletion of subsets of T lymphocytes [12], which are crucial in fighting against infections. Commonly used techniques for the estimation of apoptosis are as follows. Agarose gel electrophoresis [13] is used to demonstrate the ladder pattern of DNA (a hallmark of apoptosis) which is generated by endonucleolytic cleavage of genomic DNA into nucleosomalsize DNA of approximately 180 bases long (monomers) or oligonucleotides, which are multiples of 180 bases (oligomers). The technique usually involves a DNA isolation procedure from millions of cells and obtained results cannot be quantified. Caspase-3 quantification [14] is used for the estimation of apoptosis in cell lysates. Both of these assays require large numbers of apoptotic cells and thus are relatively insensitive for the detection of low levels of apoptotic events. Tunel (TdT-mediated dUTP nick-end labeling) assay [15] or in situ nick translation is the most established method for detecting apoptosis. The assay usually involves terminal nucleotide transferase-mediated polymerization of labeled dUDP, in a template-independent manner, at the site of DNA breaks at 3⬘OH. Although sensitive, this method is associated with a number of artifacts, as it labels DNA strand breaks from any insult, in both apoptotic and nonapoptotic cells [16]. Also, loss of frail apoptotic cells during processing is common in this method. Morphological estimation for apoptosis [17] is based on cell characteristics such as chromatin condensation, formation of apoptotic bodies from one cell (each having a fragmented piece of nucleus surrounded by a viable cell membrane), shrinkage of cytoplasm, and blebbing of plasma membrane with an irregular outline [1]. However, in this assay, late apoptotic cells, in the form of small intensely eosinophilic and highly condensed chromatin bodies, may not be detected by a
328
RAPID COMMUNICATION
light microscope due to their size [1]. Also, early apoptotic cells may not show these classical morphological features of apoptosis. Antibodies against annexin V, labeled with fluorescein isothiocyanate are used for rapid cytofluorometric analysis [18, 19] of apoptosis. Annexin V is a member of a family of calcium-dependent phospholipid-binding proteins that possess a strong affinity for phosphatidylserine [20], which is externalized on to the cell surface in the very early stages of cell death. As phosphatidylserine is present in normal cells (inside of the cell membrane) this assay can provide false positive results when membranes are damaged [21]. The “DNA diffusion” assay described here is a simple, sensitive, and rapid method for estimating apoptosis in single cells. The assay involves mixing cells with agarose and making a microgel on a microscopic slide, then lysing the embedded cells with salt and detergents (to allow the diffusion of small molecular weight DNA in agarose), and finally visualizing the DNA by a sensitive fluorescent dye, YOYO-1. The method may be used to distinguish apoptosis from necrosis. The technique is validated by exposing MOLT-4 cells to some known apoptosis and necrosis-inducing agents such as hyperthermia [22, 23], hydrogen peroxide [23], mitoxantrone [24, 25], novobiocin [26] and sodium ascorbate [23]. MATERIALS AND METHODS All chemicals were purchased from Sigma Chemical Company (St. Louis, MO) unless mentioned otherwise. All experiments were done in indirect incandescent light. Cells were either incubated at 37°C or were kept on ice during handling to avoid damage to DNA. Lymphocytes. Lymphocytes were isolated from the heparinized blood of a healthy, adult male volunteer by a modified FicollHypaque centrifugation method of Boyum [27]. The modification allows rapid (10 min) separation of lymphocytes from a relatively small volume (100 l) of blood. In this micromethod, 20 –100 l of whole blood was mixed with 0.5 ml ice-cold RPMI 1640 (GIBCO, Grand Island, NY) in a 1.5-ml heparinized microfuge tube (Kew Scientific Inc., Columbus, OH). One hundred microliters of cold lymphocyte separation medium (LSM, Organon, Teknika Corporation, Durham, NC) was then layered at the bottom of the tube. The sample was centrifuged at 3500 rpm for 2 min in a microfuge (Sorvall, Model: Microspin 245). Lymphocytes in the upper part of the Ficoll layer were pipetted out. At this stage the lymphocyte sample should be relatively free of erythrocytes, which can contribute to DNA damage during cell lysis (lysed red blood cells release hydrogen peroxide and oxyhemoglobin that could generate superoxide anions [28]). Cells were washed twice in 0.5 ml RPMI 1640 with 10% fetal bovine serum (Hyclone, New Haven, CT), by centrifugation for 2 min at 3500 rpm in the microfuge. The final pellet (consisting of approximately 0.4 – 2.0 ⫻ 10 5 lymphocytes) was suspended in 10 l of PBS. Cell viability, assessed using the trypan blue exclusion test, was generally ⬎99%. MOLT-4 cells. MOLT-4 cells (American Type Cell Culture Collection (ATCC), Rockville, MD) were grown in RPMI 1640 culture medium with 10% fetal bovine serum and 2 mM L-glutamine in an atmosphere of 5% CO 2 and 95% air at 37°C with 100% humidity. At a density of 1 million cells/ml, cultures were split 1:2 every 48 h. For consistency and reproducibility, all experiments were done after 24 h
329
of splitting the cultures. Cell viability, assessed using the trypan blue exclusion test in MOLT-4 cultures used for these experiments, was ⬎94%. Induction of apoptosis. Experiments were carried out to compare and correlate the DNA diffusion assay with other known methods of apoptosis determination in human lymphocytes and MOLT-4 cells. Samples of cells were irradiated with 0, 12.5, 25, 50, or 100 rad of X rays using a Kelley-Koett X-ray machine (Covingon, CT) at a rate of 100 rad/min. After irradiation each sample of MOLT-4 cells was divided into 3 aliquots for apoptosis assays (agarose gel electrophoresis, morphological, and DNA diffusion assay). Each sample of lymphocytes was divided into 2 aliquots for the morphological and DNA diffusion assay (the agarose gel electrophoresis assay was not applied to lymphocytes because this assay requires large volumes of blood). From each aliquot, half of the sample was taken out for apoptosis assessment (by morphological assay, regular gel electrophoresis assay, and DNA diffusion assay) at the 0 h time point (i.e., immediately after X-ray exposure) and the remaining half was incubated at 37°C in an incubator for 24 h time point. DNA diffusion assay: Lymphocytes and MOLT-4 cells. Microgels were prepared on custom-made MGE slides (Erie Scientific Company, Portsmouth, NH, Cat. No. ES 370). These slides provide a clear nonfrosted area in the center (1 ⫻ 3 cm 2) for better visualization of DNA and a surrounding frosted area for the attachment of agarose. Agarose precoated slides were made by spreading 50 l of 0.5% agarose on each slide and drying them at room temperature. This dried layer of agarose provides a better substrate for attachment of subsequent layers. Microgels were made on agarose-precoated slides by pipetting 50 l of 0.5% agarose having approximately 10,000 to 500,000 lymphocytes or MOLT-4 cells. This agarose was immediately covered with a 24 ⫻ 50 mm 2 No. 1 cover glass (Corning Glass Works, Corning, NY) and cooled in a steel tray on ice for 1 min. The cover glasses were removed, and 200 l of 2% agarose (SFR, Amresco, Solon, OH) solution was layered as before to make a third layer. After keeping slides for 2 min on ice, cover glasses were removed and the slides were immersed and maintained for at least 1 h in a freshly made lysing solution (2.5 M NaCl, 2 mM tetrasodium EDTA, 10 mM Tris base, pH 10, with freshly added 1% Triton X-100). After lysis, the slides were placed in a slide-holding tray and immersed for 10 min at room temperature in a plastic container filled with a freshly made alkaline solution (0.3 N NaOH and 0.2% DMSO, pH ⬎13.5). Use of the plastic tray and container for alkaline treatment and ethanol precipitation [29] ensured uniform fluorescent background from slide to slide. Slides were then immersed for 15 min in 1 M ammonium acetate in ethanol (5 ml of 10 M ammonium acetate and 45 ml of absolute ethanol). Lastly, slides were immersed in 75% ethanol having 5 mM spermine (FW202.3) for 15 min to remove precipitated salts and detergents while retaining DNA in agarose. Slides were air-dried and stored at room temperature. Slides were prestained with 50 l of 5% DMSO and 5% sucrose in 10 mM sodium dihydrogen phosphate. Slides were stained with 50 l of 0.25 M YOYO-1 in 5% DMSO. The percentage of cells with diffuse DNA and a hazy outline were calculated from a total of 1000 cells. DNA diffusion assay: Thymus and brain cells from rats. Male Brown Norway rats, 8 months of age, were narcotized by placing in a foam box containing CO 2 ice for 65 s (a piece of cardboard was put on top of the dry ice to prevent its direct contact with animals). All steps after this time were conducted in dim and indirect light. The thymus and brain were dissected out and immediately washed three times in excess of ice-cold PBS (phosphate-buffered saline without calcium and magnesium (having 200 M of N-1-butyl-␣-phenynitrone, PBN) to remove blood cells. Tissue press (BioSpec Product, Inc., Bartlesville, OK) was used to disperse thymus and brain tissue into single cell suspension [30]. Tissue was placed on the wire screen of an ice-cold tissue press. This screen is supported by a supporting plate and screw-on cap. The device was assembled and the lower end of the device with tissue was immersed in 20 ml cold PBS in a beaker
330
RAPID COMMUNICATION
(this minimizes the contact of tissue with air). The piston was brought down by rotation. This provided pressure on the tissue, which was squeezed through the wire screen into the beaker. Tissue pieces (which settle very quickly to the bottom of a 50-ml polypropylene tube without centrifugation) were washed 4 times with cold PBS to remove most of the remaining blood cells. Finally, these smaller tissue pieces were dispersed into single-cell suspension in 5 ml of cold PBS with a 5 ml Pipetman. Ten microliters of this cell suspension was mixed with 45 l of agarose per slide to make microgels. Slides for DNA diffusion assay were processed as described above (see DNA diffusion assay: Lymphocytes and MOLT-4 cells). DNase digestion of DNA from MOLT-4 cells. To find concentrations of DNase producing nucleosomal-sized pieces of DNA (similar to those generated by digestion of nuclei of MOLT-4 cells embedded in microgels), the following experiments were performed. MOLT-4 cells were grown as described earlier. DNA was isolated using a D-5000 kit from Gentra Systems, Inc (Minneapolis, MN). The dried pellets were hydrated with 10 mM NaCl, 3 mM MgCl 2, and 10 mM Tris, pH 7.2. DNA was digested with 0, 0.12, 0.24, 0.46, 0.93, 1.87, 3.75, 7.5, 15, and 30 units/ml of DNase in buffer for 15 min at 37°C. The reaction was terminated by incubating samples in 1 mg/ml of proteinase K for 15 min at 37°C. Samples were run on a 2% gel in Tris borate acetate buffer (having 0.35 g/ml of ethidium bromide) at 50 v for 4 h. DNA markers (HindIII digest of phage DNA and HaeIII digest of ⫻ 174 RF DNA) were included in lane 11. DNase I digestion for generating apoptosis-like nuclear morphology in MOLT-4 cells embedded in microgels. To develop an ideal protocol for the retention of small pieces of DNA in agarose (which provides a DNA diffusion apoptotic morphology) and to investigate whether all cells with the DNA diffusion morphology are retained and analyzable, nuclei of lysed MOLT-4 cells in the microgels on slides were washed twice for 15 min each time with the lysing solution not including detergents and EDTA. A final wash for 15 min was done in a deoxyribonuclease reaction buffer (10 mM sodium chloride, 3 mM magnesium chloride, 10 mM Tris, pH 7.2). Slides were further incubated at 37°C for 15 min in the reaction buffer with 30 units/ml of deoxyribonuclease I (Pharmacia, Piscataway, NJ, 2900 units/mg, from bovine pancrease). Deoxyribonuclease I digestion of lysed nuclei in microgels produces a morphological pattern of DNA diffusion similar to that of apoptotic cells. Slides were then processed as for the DNA diffusion assay. Morphological assay for apoptotic cells. Typical apoptotic cells under a light microscope show small, highly condensed chromatin bodies. Each apoptotic body has a fragmented piece of nucleus surrounded by a viable cell membrane. This can be easily differentiated from a normal cell under a light microscope [1]. Following these criteria, a total of 1000 randomly selected cells from each sample of lymphocytes and MOLT-4 cells was observed for apoptosis using a light microscope. Also, for confirmation of morphological assessments of apoptosis, smears were stained with Wright-Giemsa stain [31]. MOLT-4 cells were centrifuged and pellets were resuspended in minimum volumes of PBS. Smears were made on microscopic slides and air-dried. Cells were fixed and stained with 1 ml per slide of Wright-Giemsa stain (Wright 1.85 g, Giemsa 185 mg dissolved in 600 ml methanol) for 1 min. Staining solution on slides was mixed with equal volume of phosphate buffer (0.7 g sodium phosphate monobasic, 0.3 g sodium phosphate dibasic in 100 ml distilled water). After 4 min, slides were rinsed in water and air-dried. Observations were made after mounting slides in Permount (Fisher Scientific Co., Fair Lawn, NJ). Agarose gel electrophoresis assay for apoptosis (ladder pattern). After viability testing, cells were immediately irradiated with 0, 12.5, 25, 50, or 100 rad of X rays. Cells were incubated at 37°C in an incubator for 24 h, centrifuged at 500g for 5 min, and suspended in 20 l of PBS. Cells were then lysed by the addition of 100 l of lysing solution having 0.25 M NaCl, 0.1% sodium lauroyl sarcosine, 10 mM
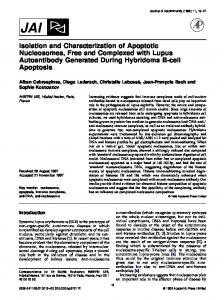
FIG. 1. A photomicrograph showing cultured MOLT-4 cells, stained with Wright-Giemsa stain. One typical apoptotic cell, as indicated by arrow, shows chromatin condensation and fragmentation of nucleus into pieces of various sizes, features which are characteristic of apoptosis. Magnification: 400X.
EDTA, 1 mM Tris, (pH 7.5) at room temperature for 30 min. Samples in microfuge tubes were centrifuged at 11,500g for 15 min to pellet cellular debris. Supernatants, which consisted mainly of lysed apoptotic cells, were incubated first with 10 g/ml of RNAse A (Amresco, Solon, OH) for 30 min at 37°C, and then with 1 mg/ml of proteinase K (Amresco) for 30 min at 37°C. They were then mixed with loading dye and electrophoresed on 1.8% agarose (ultra pure agarose, Life Technologies, Gaithersburg, MD) in Tris borate (pH 8) for 4 h at 100 V. Gels were stained in 0.35 g/ml ethidium bromide in Tris borate buffer. Validation of DNA diffusion assay. Cells were exposed to known inducers of necrosis and apoptosis such as hyperthermia (exposed to 44°C for 1 h and incubated for 24 h at 37°C), hydrogen peroxide (0, 22, 44, 88, and 176 M), mitoxantrone (0, 0.25, 0.5, 1.0, and 2.0 M), novobiocin (0, 200, 400, 800, and 1600 M), sodium ascorbate (0, 10, 100, 1000, and 2000 M) at 37°C for 24 h in complete medium and processed for the DNA diffusion assay as described above.
RESULTS
An illustration of control MOLT-4 cells stained with Wright-Giemsa stain is shown in Fig. 1. Most cells in this figure show normal morphology (one typical apoptotic cell is present and indicated by an arrow). MOLT-4 cells irradiated with 100 rad of X rays and
331
RAPID COMMUNICATION
FIG. 2. Photomicrograph of MOLT-4 cells, irradiated with 100 rad of X rays and cultured for 24 h. Cells were stained with WrightGiemsa stain. Typical apoptotic cells, as indicated by arrows, show chromatin condensation and fragmentation of nucleus into pieces of various sizes, features characteristic of apoptosis. Magnification: 400X.
cultured for 24 h are shown in Fig. 2. Many apoptotic cells (indicated by arrows) are evident in this figure. The induction of apoptosis as estimated by DNA diffu-
sion assay compared to morphological estimations was significantly higher in all samples at 24 h and at all X-ray doses when compared to controls (except in MOLT-4 irradiated with 25 rad and incubated for 24 h at 37°C) (Table 1). The last column (t test P values) of Table 1 shows P values as estimated using a two-tailed unpaired t test. Figure 3, a low magnification photomicrograph, shows many apoptotic and normal cells from cultured lymphocytes 24 h after 100 rad of X rays. Although details are not clearly seen, apoptotic cells are easily identifiable. Typical apoptotic and normal cells from lymphocytes and MOLT-4 culture, processed by the DNA diffusion assay, are shown in Fig. 4 and Fig. 5, respectively, at 400X magnification. Figure 6 shows a typical ladder pattern from MOLT-4 cells produced by various doses of X rays: 0 rad (lane 1), 25 rad (lane 2), 50 rad (lane 3), or 100 rad (lane 4). Large numbers of apoptotic cells, extensive DNase free RNAse, and proteinase K digestion steps were essential to demonstrate this pattern. Results of experiments on DNase digestion of nuclear DNA of MOLT-4 cells embedded in agarose on microscopic slides are shown in Table 2. The migration patterns generated by different concentrations of DNase are shown in Fig. 7 (0 (lane 1), 0.12 (lane 2), 0.24 (lane 3), 0.46 (lane 4), 0.93 (lane 5), 1.87 (lane 6), 3.75 (lane 7), 7.5 (lane 8), 15 (lane 9), and 30 units/ml (lane 10) of DNase). Out of all the concentrations used in this experiment only a DNase concentration of 30 units/ml completely digested all of the DNA into nucleosomal-sized pieces as indicated by the migration patterns in lane 10 (Fig. 7). DNA markers (HindIII digest of phage DNA and HaeIII digest of ⫻ 174 RF DNA) were included in lane 11 to indicate that the pieces generated by 30 units/ml of DNase degraded
TABLE 1 Apoptosis by X Rays in Human Lymphocytes and MOLT-4 Cells Morphological
Lymphocytes Control 25 rad 50 rad 100 rad MOLT-4 Control 25 rad 50 rad 100 rad
DNA diffusion
0h
24 h
0h
24 h
t test P values
0.6 ⫾ 0.5 1.6 ⫾ 0.5 0.3 ⫾ 0.5 1.3 ⫾ 0.5
0.7 ⫾ 0.5 2.0 ⫾ 0.8 3.3 ⫾ 1.2 6.5 ⫾ 1.7
1.3 ⫾ 0.5 2.0 ⫾ 0.0 0.7 ⫾ 0.5 1.3 ⫾ 0.5
3.7 ⫾ 0.5 6.0 ⫾ 0.8 12.7 ⫾ 1.2 15.7 ⫾ 1.9
⬍0.0018 ⬍0.0036 ⬍0.0006 ⬍0.0034
30.3 ⫾ 6.3 31.7 ⫾ 4.9 30.1 ⫾ 9.4 31.7 ⫾ 4.5
31.0 ⫾ 3.6 39.3 ⫾ 4.2 58.3 ⫾ 4.6 76.3 ⫾ 5.4
32.3 ⫾ 2.1 34.3 ⫾ 3.3 34.3 ⫾ 3.1 33.3 ⫾ 3.3
32.3 ⫾ 1.7 48.3 ⫾ 4.5 67.7 ⫾ 2.4 95.3 ⫾ 4.5
⬍0.6020* ⬍0.0644* ⬍0.0350 ⬍0.0094
Note. Each data point is the mean and standard deviation from three different experiments done on 3 different days. The last column (t test P values) shows P values from a t test comparison of the incidence of apoptosis estimated by the morphological and DNA diffusion assay at 24 h after X ray. * Not significantly different (P ⬎ 0.05).
332
RAPID COMMUNICATION
333
RAPID COMMUNICATION
TABLE 2 Incidence of DNase-Generated Apoptosis Number of cells placed in microgel
Detected apoptotic cells (DNA diffusion)
Experiment 1 858 Experiment 2 633 Experiment 3 712
839 628 696
Note. Microgels with a known number of MOLT-4 cells (left column) were exposed to DNase-1, processed using the DNA diffusion assay, and analyzed (right column), as noted under Materials and Methods.
FIG. 6. A photomicrograph showing the ladder pattern from apoptotic MOLT-4 cells. Cells were exposed to 0 (lane 1), 12.5 (lane 2), 25 (lane 3), 50 (lane 4), or 100 rad (lane 5) of X rays, respectively, and incubated for 24 h at 37°C. Apoptotic DNA was separated from cell debris as described under Materials and Methods, digested with RNAse and proteinase-K, and electrophoresed for 4 h in 1.8% agarose at 100 V.
DNA to below 310 bases long. Based on these results, a concentration of 30 units/ml of DNase was chosen to degrade DNA lysed MOLT-4 embedded in microgels for generating the apoptotic morphology seen in the DNA diffusion assay. To demonstrate the necrotic morphology seen in the DNA diffusion assay, MOLT-4 cells were incubated at 44°C for 1 h in a water bath [32]. Cells were further incubated for 24 h at 37°C and processed for DNA diffusion assay (Fig. 8). Hyperthermia induced low levels of apoptosis, but a high degree of necrosis as seen in Table 3. To demonstrate the hyperthermia-induced smear pattern of DNA migration in the regular agarose gel electrophoresis assay, DNA was isolated from MOLT-4 cells exposed to 44°C for 1 h and then allowed to incubate for 24 h at 37°C (Fig. 9, lane 1 is the control sample and lane 2 is the hyperthermia-treated sample). It is obvious that more than 98% of cells, whose nuclear DNA was digested with DNase to produce an
apoptotic morphology, were accounted for on microscopic slides. The loss of approximately 1.8% of cells is expected during cell handling. This was confirmed by staining parallel slides with 5 g/ml of acridine orange in PBS and counting the cells embedded in agarose microgels. The results of the validation of the DNA diffusion assay using known inducers of necrosis and apoptosis are summarized in Table 3. All treatment groups show significantly higher apoptosis compared to controls (P ⫽ 0.05, Mann-Whitney one-tailed t test). Mitoxantrone was most effective in inducing apoptosis and was able to kill almost all cells. Interestingly, apoptotic cells in mitoxantrone samples were not visible at 100X magnification using the morphological assay but could be easily seen in the DNA diffusion assay at the same magnification. Hyperthermia, all doses of hydrogen peroxide (22, 44, 88, and 176 M), 2.0 M, the highest dose of mitoxantrone, 1600 M, the highest dose of novobiocin and higher doses of sodium ascorbate (100, 1000, 2000 M) induced significantly higher levels of necrosis (P ⫽ 0.05, Mann-Whitney one-tailed t test). In the thymus 0.836% apoptosis was observed from a total of 5244 cells analyzed. Numerous small individual apoptotic bodies faintly stained, probably remnants of earlier apoptotic events, were seen in the background and were ignored during analysis. Such apoptotic bodies have been reported previously [33]. When observed under an optical microscope, these apoptotic bodies are not visible due to their smaller size. These apoptotic bodies, however, can be seen by using the DNA diffusion assay due to the use of a sensitive dye YOYO-1 and use of an DNA diffusion assay protocol, which ensures retention of apoptotic cells, as well as
FIG. 3. A photomicrograph showing six apoptotic lymphocytes. Cells were irradiated with 100 rad of X rays, incubated for 24 h at 37°C, and processed by the DNA diffusion assay. Magnification: 100X. Dye: YOYO-1. FIG. 4. A photomicrograph showing one apoptotic and one normal lymphocytes. Cells were irradiated with 100 rad of X rays, incubated for 24 h at 37°C, and processed by the DNA diffusion assay. Magnification: 400X. Dye: YOYO-1. FIG. 5. A photomicrograph showing one apoptotic and three normal MOLT-4 cells. Cells were irradiated with 100 rad of X rays, incubated for 24 h at 37°C, and processed by DNA diffusion assay. Magnification: 400X. Dye: YOYO-1.
334
RAPID COMMUNICATION
FIG. 7. Agarose gel electrophoresis migration pattern of DNasedigested DNA isolated from MOLT-4 cells. DNA was digested with 0 (lane 1), 0.12 (lane 2), 0.24 (lane 3), 0.46 (lane 4), 0.93 (lane 5), 1.87 (lane 6), 3.75 (lane 7), 7.5 (lane 8), 15 (lane 9), and 30 (lane 10) units/ml of DNase for 60 min at 37°C in 10 mM NaCl, 10 mM Tris, 3 mM MgCl 2. DNA markers ( phage, HindIII, and HaeIII) were included in lane 11. DNA migration of DNase-digested samples indicates that the pieces generated by 30 units/ml of DNase degraded DNA to a size below 310 bases long.
[35]. In MOLT-4 cultures, 2 to 4% of cells are continuously dying by apoptosis and necrosis, whereas, in circulating adult human lymphocytes, apoptosis is a rare event (less then 1% [36]). The phenomenon of apoptosis in these cells can be exacerbated by different environmental factors in vitro and in vivo. As most of the apoptotic cells appeared after 18 h post-irradiation, cell death can be considered as a delayed interphase apoptosis [37]. Studies of X-ray-induced apoptosis in freshly isolated lymphocytes [36, 38] and MOLT-4 [35] using morphological criterion and regular gel electrophoresis obtained results similar to those presented here. The morphological assay, although simple, underestimates the apoptotic events in both cell types. This could be due to the fact that early apoptotic cells do not have typical morphological features and late apoptotic cells are difficult to identify as cells due to their shape and size. The sensitivity of the DNA diffusion assay was validated by creating apoptotic cells from normal cells using deoxyribonuclease-I, an important nuclease participating in apoptosis [39]. Thus, the present procedure makes it possible to detect virtually
apoptotic bodies. In the brain only 0.0039% apoptosis was observed from a total of 5000 cells analyzed. Remnants of apoptotic cells were also seen; however, the number was much lower than in the thymus. DISCUSSION
Apoptosis is generally considered an energy-dependent process requiring active participation of many proteins and other cellular macromolecules. Apoptosis seems to be induced by mild genotoxic stimuli, as the strength of stimuli increase the cell death mode shifts to necrosis. This seems to be due to the fact that most of the intense genotoxic stimuli damage the proteins (or genes which are making those proteins) and other cellular macromolecules which may be required for apoptosis. The damage to proteins would result in their denaturation. This denaturation would confine the damaged DNA to the nuclear area giving a sharper outline to the nuclear boundary in necrotic cells. This sharpness in outline in necrotic cells may also be due to larger sized DNA, which does not diffuse as it does in apoptotic cells where DNA is as small as 180 bases. MOLT-4 is a cell line derived from a human T-cell leukemia [34] that has been used to study apoptosis
FIG. 8. A photomicrograph showing one necrotic and four normal MOLT-4 cells. Cells were incubated at 44°C for 1 h and further incubated for 24 h at 37°C and processed by the DNA diffusion assay. Magnification: 400X. Dye: YOYO-1.
335
RAPID COMMUNICATION
TABLE 3 Treatments (dose in M) Hyperthermia Control 44°C for 1 h Hydrogen peroxide Control 22 44 88 176 Mitoxantrone Control 0.25 0.5 1.0 2.0 Novobiocin Control 200 400 800 1600 Sodium ascorbate Control 10 100 1000 2000
Percentage apoptotic cells
P values (Mann-Whitney one-tailed t test)
Percentage necrotic cells
P values (Mann-Whitney one-tailed t test)
3.26 ⫾ 0.16 5.01 ⫾ 0.35
⫽0.05
0.51 ⫾ 0.19 6.44 ⫾ 1.01
⫽0.05
3.52 ⫾ 0.28 5.59 ⫾ 0.21 23.75 ⫾ 0.50 35.54 ⫾ 0.62 40.09 ⫾ 0.68
⫽0.05 ⫽0.05 ⫽0.05 ⫽0.05
0.54 ⫾ 0.14 1.20 ⫾ 0.13 6.09 ⫾ 0.92 10.16 ⫾ 0.69 44.62 ⫾ 6.70
⫽0.05 ⫽0.05 ⫽0.05 ⫽0.05
3.51 ⫾ 0.64 49.42 ⫾ 1.32 55.02 ⫾ 0.21 46.95 ⫾ 1.66 50.29 ⫾ 1.57
⫽0.05 ⫽0.05 ⫽0.05 ⫽0.05
0.50 ⫾ 0.05 0.64 ⫾ 0.14 0.48 ⫾ 0.20 0.45 ⫾ 0.14 42.91 ⫾ 5.71
⫽0.2 ⫽0.2 ⫽0.2 ⫽0.05
3.75 ⫾ 0.14 5.79 ⫾ 0.63 19.99 ⫾ 4.43 22.68 ⫾ 3.60 5.61 ⫾ 0.50
⫽0.05 ⫽0.05 ⫽0.05 ⫽0.05
0.45 ⫾ 0.08 0.67 ⫾ 0.17 0.61 ⫾ 0.28 0.39 ⫾ 0.14 0.64 ⫾ 0.06
⫽0.2 ⫽0.2 ⫽0.2 ⫽0.05
3.47 ⫾ 0.15 5.54 ⫾ 0.93 6.27 ⫾ 0.61 25.73 ⫾ 2.84 62.59 ⫾ 2.77
⫽0.05 ⫽0.05 ⫽0.05 ⫽0.05
0.52 ⫾ 0.19 0.52 ⫾ 0.13 1.16 ⫾ 0.88 3.45 ⫾ 0.06 7.09 ⫾ 2.25
⫽0.5 ⫽0.05 ⫽0.05 ⫽0.05
Note. Means and standard deviations of apoptotic or necrotic MOLT-4 cells as a percentage of total cells as assessed by the DNA diffusion assay. N ⫽ 3 for each determination.
all of early, typical, and late apoptotic cells. Before lysis, it may be difficult to identify early apoptotic and early necrotic cells from normal cells (Figs. 1 and 2). However, it is easy to detect apoptotic and necrotic cells using the DNA diffusion assay. Apoptotic cell nuclei have a hazy or undefined outline without any clear boundary due to nucleosomal-sized DNA diffusing into agarose. Necrotic cell nuclei are bigger and are poorly defined. They have a clear, defined outer boundary of the DNA halo and a relatively homogeneous appearance of halo. Cells with only damaged DNA (not necrotic or apoptotic cells), on the other hand, are clearly defined and nuclei have a larger halo with a clear outer boundary. To reveal all apoptotic cells, it is critical to use the alkaline treatment after lysis. Approximately 40% of apoptotic cells could not be detected without the alkaline treatment step (percentage of apoptotic cells in control lysed samples ⫽ 2.45 ⫾ 0.29 and percentage of apoptotic cells in control lysed and alkali-treated samples ⫽ 3.82 ⫾ 0.44, N ⫽ 3). Enhancement in sensitivity due to alkaline treatment may be due to numerous alkali labile sites present in the DNA of apoptotic cells. Alkaline treatment also degrades RNA that may interfere in identification of apoptotic cells.
FIG. 9. A photomicrograph showing the DNA migration from normal MOLT-4 cells (lane 1) and heat-treated necrotic MOLT-4 cells (lane 2). Cells were exposed to 44°C hyperthermia for 1 h and incubated for 24 h at 37°C. DNA was digested with RNAse and Proteinase K and electrophoresed for 4 h in 1.8% agarose at 100 V.
336
RAPID COMMUNICATION
Although two modes of death can be identified easily, sometimes early apoptosis and late necrosis may be difficult to distinguish due to extensive DNA degradation occurring in late necrotic cell nuclei at their periphery. Thus, late necrotic cells with degraded DNA at the periphery may be mistaken for an early apoptotic cell. This difficulty in differentiating between early apoptotic and late necrotic cells has been previously reported using the TUNEL assay [40]. Procedural damage to the DNA (excessive light, excessive time spent in processing samples without using ice while preparing microgels, etc.) may degrade the DNA to such a degree that even a normal cell may show necrotic or apoptotic morphology depending upon the degree of DNA damage. The results from known apoptosis and necrosis-inducing agents such as low doses of X rays (Table 1) [23], hyperthermia [22, 23], hydrogen peroxide [23], mitoxantrone (a topoisomerase II inhibitor) [24, 25], novobiocin (a topoisomerase I inhibitor) [26], and ascorbate (Table 3) [23] indicate that this technique can sensitively detect apoptosis and necrosis in cultured cells. Ascorbate, hydrogen peroxide, hyperthermia [23], mitoxantrone [41], and ionizing radiations [42, 43] all have been shown to induce apoptosis effectively in MOLT-4 cells. Novobiocin on the other hand has not been tested for apoptotic induction in MOLT-4 cells. This study suggests that even in millimolar doses, the drug is not an efficient inducer of apoptosis in MOLT-4 cells. Mitoxantrone is the most effective drug for apoptotic induction in MOLT-4 cells. Preliminary results from thymus and brain cells of rats indicate the possible usefulness of this technique for the estimation of apoptosis in solid tissues or tissue biopsies. These results (0.83% apoptosis in rat thymus) are similar to those previously obtained by Wang et al. (2.9% apoptosis) who determined apoptosis by means of the flow cytometric assay on propidium iodide cells from Sprague-Dawley (200 –250 g) rat thymus [44]. The most likely reason for the difference between our results and those reported in the past is a substantial disruption of apoptotic cells into apoptotic bodies during physical dispersion of solid tissue into single cells. Disruption of late apoptotic cells may lead to their underestimation, particularly in the case of harder tissues from older animals such as in the heart, kidney, and thymus. The incidence of apoptosis in a mixed population of cells from the brain is 0.0039% which is similar to that previously reported (0.005%) [45]. Considering the extremely high sensitivity of YOYO-1 in detecting smaller sized DNA and the protocol developed for the retention of all apoptotic cells and apoptotic bodies, the technique has the potential to be utilized for monitoring cell death. Detection of apoptotic cells using the DNA diffusion assay can be automated using image analysis software
in conjunction with a computer-controlled, motorized microscopic stage. Apoptotic cells, processed using the DNA diffusion assay and then coated with a suitable polymer, can be analyzed rapidly by flow cytometry. This technique is a valuable tool for exploring the effects of nutrition, aging, and various environmental insults to humans and other living organisms. The technique may also prove useful for monitoring the efficacy of cancer treatment and observing apoptosis during development in different organs. My sincere thanks to Dr. Martin Poot of the Department of Pathology at the University of Washington for providing the mitoxantrone. I am grateful to Dr. Henry Lai for his editorial comments and to Himani Singh for her help in preparing this manuscript. Also, many thanks to Ms. Kari Berger and Mr. Jordan Rehm of the Health Sciences Photography, Computer Imaging Bureau of the University of Washington, for photography.
REFERENCES 1.
2.
3.
4. 5.
6. 7. 8.
9.
10. 11.
12.
13. 14.
Searle, J., Kerr, J. F. R., and Bishop, C. J. (1982). Necrosis and apoptosis: Distinct modes of cell death with fundamentally different significance. Pathol. Ann. 17, 229 –259. von Wangenheim, K. H., and Peterson, H. P. (1998). Control of cell proliferation by progress in differentiation: Clues to mechanisms of aging, cancer causation and therapy. J. Theor. Biol. 193, 663– 678. Guchelaar, H. J., Vermes, A., Vermes, I., and Haanen, C. (1997). Apoptosis: Molecular mechanisms and implications for cancer chemotherapy. Pharm. World Sci. 19, 119 –125. Orrenius, S. (1995). Apoptosis: Molecular mechanisms and implications for human disease. J. Intern. Med. 237, 529 –536. Warner, H. R., Hodes, R. J., and Pocinki, K. (1997). What does cell death have to do with aging? J. Am. Geriat. Soc. 45, 1140 – 1146. Tomei, L. D., and Umansky, S. R. (1998). Aging and apoptosis control. Neurol. Clin. 16, 735–745. Temlett, J. A. (1996). Parkinson’s disease: Biology and aetiology. Curr. Opin. Neurol. 9, 303–307. Gorman, A. M., McGowan, A., O’Neill, C., and Cotter, T. (1996). Oxidative stress and apoptosis in neurodegeneration. J. Neurol. Sci. 139(Suppl.), 45–52. Aguila, M. B., Mandarim de Lacerda, C. A., and Apfel, M. I. (1998). Stereology of the myocardium in young and aged rats. Arq. Bras. Cardiol. 70, 105–109. Sabbah, H. N., and Sharov, V. G. (1998). Apoptosis in heart failure. Prog. Cardiovasc. Dis. 40, 549 –562. Singhal, P. C., Reddy, K., Franki, N., Sanwal, V., Kapasi, A., Gibbons, N., Mattana, J., and Valderrama, E. (1997). Age and sex modulate renal expression of SGP-2 and transglutaminase and apoptosis of splenocytes, thymocytes, and macrophages. J. Invest. Med. 45, 567–575. Aggarwal, S., and Gupta, S. (1998). Increased apoptosis of T cell subsets in aging humans: Altered expression of Fas (CD95), Fas ligand, Bcl-2, and Bax. J. Immunol. 160, 1627–1637. Wyllie, A. H., Kerr, J. F. R., and Currie, A. R. (1980). Cell death: The significance of apoptosis. Int. Rev. Cytol. 68, 251–306. Nicholson, D. W., All, A., Thornberry, N. A., Vaillancourt, J. P., Ding, C. K., Gallant, M., Gareau, Y., Griffin, P. R., Labelle, M., Lazebnik, Y. A., Munday, N. A., Raju, S. M., Smulson, M. E., Yamin, T., Yu, V. L., and Miller, D. K. (1995). Identification and
RAPID COMMUNICATION
15.
16.
17.
18.
19.
20.
21. 22.
23.
24.
25.
26.
27.
28.
29.
30.
inhibition of ICE/CED-3 protease necessary for mammalian apoptosis. Nature 376, 37– 43. Gavrieli, Y., Sherman, Y., and Ben-Sasson, S. A. (1992). Identification of programmed cell death in situ via specific labeling of nuclear DNA fragmentation. J. Cell Biol. 119, 493–501. Kockx, M. M., Muhring, J., Knaapen, M. W., and de Meyer, G. R. (1998). RNA synthesis and splicing interferes with DNA in situ end labeling techniques used to detect apoptosis. Am. J. Pathol. 152, 885– 888. Kerr, J. F. R., Wyllie, A. H., and Currie, A. R. (1972). Apoptosis: Basic biological phenomenon with wide-ranging applications in tissue kinetics. Br. J. Cancer 26, 239 –257. Koopman, G., Reutelingsperger, C. P., Kuiiten, G. A., Keehnen, R. M., and Pals, S. T. (1994). Annexin V for flow cytometiric detection of phosphatidylserine expression on B cells undergoing apoptosis. Blood 85, 332–340. Vincent, A. M., and Maiese, K. (1999). Direct temporal analysis of apoptosis induction in living adherent neurons. J. Histochem. Cytochem. 47, 661– 671. Andree, H. A., Reutelingsperger, C. P., Hauptmann, R., Hemker, H. C., Hermens, W. T., and Willems, G. M. (1990). Binding of vascular anticoagulant alpha (VAC alpha) to planar phospholipid bilayers. J. Biol. Chem. 265, 4923– 4928. Koester, S. K., and Bolton, W. E., (1999). Differentiation and assessment of cell death. Clin. Chem. Lab. Med. 37, 311–317. Nakano, H., Kurihara, K., Okamoto, M., Tone, S., and Shinohara, K. (1997). Heat-induced apoptosis and p53 in cultured mammalian cells. Int. J. Radiat. Biol. 71, 519 –529. Yanagisawa-Shiota, F., Sakagami, H., Kuribayashi, N., Iida, M., Sakagami, T., and Takeda, M. (1995). Endonuclease activity and induction of DNA fragmentation in human myelogenous leukemic cell lines. Anticancer Res. 15, 259 –265. Vial, J. P., Belloc, F., Dumain, P., Besnard, S., Lacombe, F., Boisseau, M. R., Reiffers, J., and Bernard, P. (1997). Study of the apoptosis induced in vitro by antitumoral drugs on leukemic cells. Leukemia Res. 21, 163–172. Ray, S., Ponnathpur, V., Huang, Y., Tang, C., Mahoney, M. E., Ibrado, A. M., Bullock, G., and Bhalla, K. (1994). 1-beta-Darabinofuranosylcytosine-, mitoxantrone-, and paclitaxel-induced apoptosis in HL-60 cells: Improved method for detection of internucleosomal DNA fragmentation. Cancer Chemother. Pharmacol. 34, 365–371. Alnemri, E. S., and Litwack, G. (1990). Activation of internucleosomal DNA cleavage in human CEM lymphocytes by glucocorticoid and novobiocin. Evidence for a non-Ca 2⫹-requiring mechanism(s). J. Biol. Chem. 265, 17323–17333. Boyum, A. (1968). Isolation of mononuclear cells and granulocytes from human blood. Scand. J. Clin. Lab. Invest. Suppl. 21, 77– 89. Giulivi, C., Hochstein, P., and Davies, K. J. (1994). Hydrogen peroxide production by red blood cells. Free Radical Biol. Med. 16, 123–129. Singh, N. P. (1997). Sodium ascorbate induces DNA singlestrand breaks in human cells in vitro. Mutat. Res. 375, 195– 203. Singh, N. P. (1998). A rapid method for the preparation of single-cell suspensions from solid tissues. Cytometry 31, 229 – 232.
Received September 2, 1999 Revised version received January 11, 2000
31.
32.
33.
34.
35.
36.
37.
38.
39.
40.
41.
42.
43.
44.
45.
337
Hart, L. T., Morris, N. G., Bessin, R., LePrince, D. J., Todd, W. J., Enright, F. M., and Luther, D. G. (1992). Single-step technique for staining Anaplasma marginale in bovine blood smears. Am. J. Vet. Res. 53, 1732–1733. Kabakov, A. E., and Gabai, V. L. (1995). Heat-shock induced accumulation of 70-kDa stress protein (HSP70) can protect ATP-depleted tumor cells from necrosis. Exp. Cell Res. 217, 15–21. Ohyama, H., Takeshi, Y., Ohkawa, A., and Watanabe, I. (1985). Radiation-induced formation of apoptotic bodies in rat thymus. Radiat. Res. 101, 123–130. Minowada, J., Ohnuma, T., and Moore, G. E. (1972). Rosetteforming human lymphoid cell lines. I. Establishment and evidence for origin of thymus-derived lymphocytes. J. Natl. Cancer Inst. 49, 891– 895. Nakano, H., and Shinohara, K. (1999). Correlation between unirradiated cells T-P53 protein levels and radiosensitivity in MOLT-4 cells. Radiat. Res. 115, 686 – 693. Boreham, D. R., Gale, K. L., Maves, S. R., Walker, J-A., and Morrison, D. P. (1996). Radiation-induced apoptosis in human lymphocytes: Potential as a biological dosimeter. Health Phys. 71, 685– 691. Radford, I. R., and Murphy, T. K. (1994). Radiation response of mouse lymphoid and myeloid cell lines, Part III. Different signals can lead to apoptosis and may influence sensitivity to killing by DNA double-strand breakage. Int. J. Radiat. Biol. 65, 229 –239. Payne, C. M., Bjore, C. G., Jr., and Schultz, D. A. (1992). Change in the frequency of apoptosis after low- and high-dose X-irradiation of human lymphocytes. J. Leukocyte Biol. 52, 433– 440. Peitsch, M. C., Polzar, B., Stephan, H., Crompton, T., MacDonald, H. R., Mannherz, H. G., and Tschopp, J. (1993). Characterization of the endogenous deoxyribonuclease involved in nuclear DNA degradation during apoptosis (programmed cell death). EMBO J. 12, 371–377. Tateyama, H., Toyohiro, T., Hattori, H., Murase, T., Li, W., and Eimoto, T. (1998). Effects of prefixation and fixation times on apoptosis detection by in situ end-labeling of fragmented DNA. Arch. Pathol. Lab. Med. 122, 252–255. Gorczyca, W., Bigman, K., Mittelman, A., Ahmed, T., Gong, J., Melamed, M. R., and Darzynkiewicz, Z. (1993). Induction of DNA strand breaks associated with apoptosis during treatment of leukemias. Leukemia 7, 659 – 670. McClaiin, D. E., Kalinich, J. F., and Ramakrishnan, N. (1995). Trolox inhibits apoptosis in irradiated MOLT-4 lymphocytes. FASEB J. 9, 1345–1354. Zhao, Q. L., Kondo, T., Noda, A., and Fujiwara, Y. (1999). Mitochondrial and intracellular free-calcium regulation of radiation-induced apoptosis in human leukemic cells. Int. J. Radiat. Biol. 75, 493–504. Wang, J., Jerrells, T. R., and Spitzer, J. J. (1996). Decreased production of reactive oxygen intermediates is an early event during in vitro apoptosis of rat thymocytes. Free Radical Biol. Med. 20, 533–542. Zhang, L., Kokkonen, G., and Roth, G. (1995). Indentification of neuronal programmed cell death in situ in the stiratum of normal adult rat brain and its relationship to neuronal death during aging. Brain Res. 677, 177–179.