A simple method of removing the effect of a bottleneck and unequal population sizes on pairwise genetic distances Oscar E. Gaggiotti1 and Laurent Exco¤er2* 1Department 2 Genetics
of Zoology, University of Cambridge, Downing Street, Cambridge CB2 3EJ, UK and Biometry Laboratory, Department of Anthropology, University of Geneva, CP 511, 1211 Geneva 24, Switzerland
In this paper, we derive the expectation of two popular genetic distances under a model of pure population ¢ssion allowing for unequal population sizes. Under the model, we show that conventional genetic distances are not proportional to the divergence time and generally overestimate it due to unequal genetic drift and to a bottleneck e¡ect at the divergence time. This bias cannot be totally removed even if the present population sizes are known. Instead, we present a method to estimate the divergence times between populations which is based on the average number of nucleotide di¡erences within and between populations. The method simultaneously estimates the divergence time, the ancestral population size and the relative sizes of the derived populations. A simulation study revealed that this method is essentially unbiased and that it leads to better estimates than traditional approaches for a very wide range of parameter values. Simulations also indicated that moderate population growth after divergence has little e¡ect on the estimates of all three estimated parameters. An application of our method to a comparison of humans and chimpanzee mitochondrial DNA diversity revealed that common chimpanzees have a signi¢cantly larger female population size than humans. Keywords: genetic distances; genetic drift; coalescent; Monte Carlo simulations; bottleneck e¡ect; Newton^Raphson method magnitude of which is inversely proportional to the size of the bottleneck. This increase is more pronounced immediately after the bottleneck and the e¡ect is correlated with the duration of the bottleneck. In the case of a size recovery, it takes an extremely long time for the genetic distances to reach the level of di¡erentiation of stationary populations (i.e. having not gone through a bottleneck). These conclusions can certainly be extended to any other distance primarily in£uenced by genetic drift. Although these results have been known for quite a long time, very few attempts have been made to remove the e¡ect of past bottlenecks. In the case of Nei’s (1972) genetic distance, it has been proposed that, if only one of the diverging population goes through a bottleneck, the properties of the ancestral population should be derived from the stationary population only (Chakraborty & Nei 1974, 1977), which is far from being entirely satisfactory as it does not fully exploit the available data. In the context of subdivided populations, a correction for unequal population sizes has been proposed for GST like measures (Nei 1973, 1982; Charlesworth 1998). It consists of weighting the average heterozygosity or nucleotide diversity of each population by its relative size when computing the average within-population diversity. This approach also applies to the particular case of two diverging populations, but it requires a precise knowledge of the population sizes. The in£uence of di¡erential genetic drift has also been studied in the context of migration matrices and their associated genetic distances, which are inferred from normalized genetic variance^ covariance matrices (Relethford 1991, 1996; Relethford & Harpending 1995). Here again the e¡ect of unequal e¡ective population size is accounted for by using weights proportional to the e¡ective population sizes estimated
1. INTRODUCTION
Conventional genetic distances are usually based on comparisons of the allele frequencies between populations (Mahalanobis 1936; Cavalli-Sforza & Edwards 1967; Nei 1972; Weir & Cockerham 1984). More recently, genetic distances have been devised to take into account the information available on the extent of molecular di¡erences between alleles (e.g. Nei & Li 1979; Nei & Tajima 1983; Goldstein et al. 1995; Slatkin 1995). While the computation of a genetic distance is independent of any particular genetic model, its expectation and, therefore, its interpretation is not. It implies that di¡erent evolutionary processes, such as a pure population ¢ssion model without migration, an island model with appropriate migration rates or even a conjugation of migration and historical ¢ssions, can lead to the same observed genetic distance (Felsenstein 1982; Relethford 1996). Large genetic distances are usually interpreted as evidence of long divergence times in a pure ¢ssion model or for reduced gene £ow in a model involving migration. However, this interpretation assumes that diversifying evolutionary forces, such as genetic drift, are constant and homogeneous over time. In practice, this assumption is often violated, in particular when populations are of unequal sizes or when a strong bottleneck has occurred at the time of divergence. The e¡ect of a demographic bottleneck following population divergence has been studied analytically for Nei’s (1972) genetic distance (Chakraborty & Nei 1974, 1976, 1977; Nei et al. 1975). These studies showed that bottlenecks lead to a rapid increase in genetic divergence, the *
Author for correspondence (laurent.exco¤
[email protected]).
Proc. R. Soc. Lond. B (2000) 267, 81^87 Received 6 August 1999 Accepted 27 September 1999
81
© 2000 The Royal Society
82
O. E. Gaggiotti and L. Exco¤er
Genetic distances between populations of unequal sizes
from relative census sizes. A few speci¢c models have nevertheless been developed to estimate the parameters of population ¢ssions explicitly allowing for unequal population sizes. Moment estimators of e¡ective population sizes and divergence times have been based either on the number of shared alleles under the in¢nite-allele model (Watterson 1985) or on the number of shared segregating sites under the in¢nite-site model (Wakeley & Hey 1997). In this paper, we shall study a population ¢ssion with a bottleneck leading to two derived populations of unequal size and its consequences on the estimated genetic distances. Using a coalescent approach (Kingman 1982b; Hudson 1990; Slatkin 1991), we derive the expectation of two estimators of conventional genetic distances and show that they are a¡ected similarly by population ¢ssion. We then propose a simple method to estimate the parameters of the demographic model simultaneously (the ancestral population size, the relative sizes of the daughter populations and the divergence time). Finally, we apply our method to the divergence of humans and chimpanzees as assessed from the observed pattern of mitochondrial DNA (mtDNA) diversity. 2. GENETIC DISTANCES EXPRESSED AS A FUNCTION OF COALESCENCE TIMES
It is convenient to express classical genetic distances in terms of coalescence times, as they are independent of superimposed mutation models. For instance, Wright’s (1951) F-statistics can be expressed as a function of the average coalescence times as FST ˆ (t ¡ t0 )/ t (Slatkin 1991) if the mutation rates are assumed to be small. Here, t is the average coalescence time of two genes drawn at random and t0 is the average coalescence times of two genes drawn from the same population. Weir & Cockerham’s (1984) co-ancestry coe¤cient can be also de¢ned as ^w ˆ (t1 ¡ t0 )/ t1 ,
(1)
where t1 is equal to the average coalescence time of two genes drawn from di¡erent populations. Similarly, the net number of nucleotide di¡erences between populations (da) (Nei & Li 1979) can be simply expressed as a function of the coalescence times as da ˆ 2 (t1 ¡ t0 ),
(2)
where is the average mutation rate for all nucleotides surveyed. The following sections will focus on the expectations of these latter two genetic distances, w and da, under a pure ¢ssion model. (a) Coalescence times within and between populations
Assume that two haploid populations of constant size N1 and N 2 diverged from a single ancestral population of size N 0 at some time t in the past and that the sum of the descendant population sizes is equal to the size of the ancestral population, i.e. N1 ˆ kN 0 and N2 ˆ (17k)N 0 (with 04k41). Furthermore, let us assume that the populations do not exchange any migrants after their divergence. Proc. R. Soc. Lond. B (2000)
The average coalescence time for two genes each taken from separate populations does not depend on the bottleneck size and the sizes of the daughter populations and is just given by (Takahata & Nei 1985) t 1 ˆ t ‡ N0 .
(3)
This is because there is no possibility of coalescence until t generations in the past until both genes are found in the ancestral population, where it will take them on average N more generations to coalesce, as in a stationary population (Kingman 1982a). The average coalescence time for two genes drawn from the same population t0 is obtained as a weighted average of the two within-population coalescence times t01 and t02. Under a continuous time approximation, the coalescence times in each population are exponentially distributed with parameter Ni¡1 (i ˆ1, 2) for the timeperiod 04t4t and with parameter N0¡1 for t4t. Therefore, the expectation of t0i can be obtained as Z t Z 1 t t E‰t0i Š ˆ exp(¡ t/Ni )dt ‡ Q i exp‰¡(t ¡ t)/N0 Šdt. N N tˆ0 i tˆt 0 (4) The ¢rst term in the right-hand side of the equation averages over the coalescent events occurring between the present and the time of divergence, while the second term averages over the coalescent events occurring before the divergence of the two populations and Q i ˆ exp(¡t/Ni) is here the probability that two genes do not coalesce in the ith population. Solving the integrals, we obtain E‰t0i Š ˆ Ni ‡ (N0 ¡ N i )Q i .
(5)
(b) Biases in the estimation of genetic distances
As mentioned before, conventional genetic distances are based on the assumption that the sizes of the ancestral and derived populations are equal and constant over time. It assumes that there is no bottleneck at the divergence time and that drift is similar in the two derived populations. In that case, the average within-population coalescence time is generally obtained as the mere arithmetic mean of the estimates of the within-population coalescence times for each population (e.g. Nei & Li 1979) as ^t * ˆ E(t01 ) ‡ E(t02 ) . 0 2
(6)
Computing it this way under a pure ¢ssion model implies the following expectation derived from equation (5): ^t * ˆ N 1 ‡ (1 ¡ k)Q 1 ‡ kQ 2 . 0 0 2
(7)
Replacing equations (3) and (7) into equations (1) and (2), the expectations of the co-ancestry coe¤cient w and da are given by ^*w ˆ
t 1 ¡ (1 ¡ k)Q 1 ¡ kQ 2 1 ‡ N0 , t ‡ N0 2t
(8)
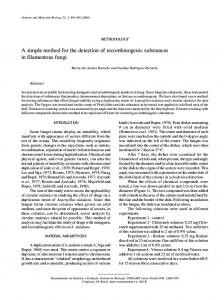
100 bias in genetic distance due to bottleneck
bias in genetic distance due to bottleneck and unequal population sizes
Genetic distances between populations of unequal sizes
k = 0.99 10
k = 0.90 k = 0.50 1
0
0.1
0.2
0.3
0.4
0.5
t /N Figure 1. Relative bias (bottleneck factor in equations (8) and (9)) between the genetic distances derived under a model assuming constant population sizes and their expectations in a pure ¢ssion model where the sizes of the daughter populations add up to the size of the ancestral population. k, the relative size of one population compared to the ancestral population.
and 1 ¡ (1 ¡ k)Q 1 ¡ kQ 2 d^a* ˆ 2 t 1 ‡ N0 . 2t
(9)
The ¢rst terms in the right-hand sides of equations (8) and (9) are the usual expectations of the respective genetic distances in the case of equal and constant population sizes. The common multiplying term in the right-hand sides of both equations is a factor expressing the additional genetic distance due to both the bottleneck e¡ect and the unequal population sizes. It will be referred to hereafter as the `bottleneck factor’ and is plotted in ¢gure 1 against the divergence time expressed in units of the ancestral population size N0. The bottleneck factor is proportionally stronger for more unequal population sizes and shorter divergence times. Thus, for the same divergence time, a genetic distance will be larger between a small and a large population than between two large populations. As in the case of GST measures, one could try to remove the bias due to unequal drift by weighting the coalescence times by the population sizes (Nei 1973), assuming these are available. In that case, an estimator of t0 is given by ^t ˆ N1 E‰t Š ‡ N2 E‰t Š ˆ kE‰t Š ‡ (1 ¡ k)E‰t Š, 0 01 02 N0 01 N0 02
(10)
which, from equation (5), implies the following expectation under the ¢ssion model ^t ˆ N ‰1 ¡ k(1 ¡ k)(P ‡ P )Š, 0 0 1 2
(11)
where Pi ˆ17Q i is the probability that the coalescent event occurs in the ith population. Due to the bottleneck e¡ect, here t0 is less than its expected value in a stationary population of size N 0. Note that the decrease in coalescence time is proportional to the quantity P1 + P2, the total probability that a coalescent event occurs in one of the daughter populations. Proc. R. Soc. Lond. B (2000)
2 1.9 1.8 1.7 1.6 1.5 1.4 1.3 1.2 1.1 1
O. E. Gaggiotti and L. Exco¤er
83
k = 0.50 k = 0.80 k = 0.90 k = 0.95 k = 0.99 0
0.2
0.4
t /N
0.6
0.8
1
Figure 2. Relative bias (bottleneck factor in equations (12) and (13)) between the genetic distances derived under a model assuming unequal sizes of the daughter populations and their expectations in a pure ¢ssion model where the sizes of the daughter populations add up to the size of the ancestral population. k, the relative size of one population compared to the ancestral population.
Replacing equations (3) and (11) into equations (1) and (2), we now obtain the expectation of the co-ancestry coe¤cient and da under this weighting scheme as E(
w)
ˆ
t k(1 ¡ k)(P1 ‡ P2 ) 1 ‡ N0 , t ‡ N0 t
(12)
and E(da ) ˆ 2 t 1 ‡ N0
k(1 ¡ k)(P1 ‡ P2 ) . t
(13)
The two weighted genetic distances are also equally a¡ected by the bottleneck, but the bottleneck factor is di¡erent from that in equations (8) and (9) (see ¢gure 2). Clearly, the bias introduced in this case is always smaller than that introduced when unequal population sizes are ignored. For very large divergence times, the bottleneck factor tends towards one and the bottleneck e¡ect becomes negligible. For relatively short divergence times, e.g. t/N 051, the bottleneck e¡ect is milder for very uneven population sizes, which seems counter-intuitive. To understand why this is so, consider the de¢nition of w as the correlation of two genes drawn at random from a single population relative to that of two genes drawn from the entire population (Wright 1951; Cockerham 1973). When one population is much larger than the other, most pairs of genes will be drawn from the large population, the size of which will be close to that of the ancestral population. Thus, the bottleneck e¡ect will appear small. This suggests that genetic distances can be fairly e¡ectively corrected for di¡erential drift if the sizes of the populations are known. However, note that the bottleneck e¡ect can be quite strong when the sizes of the daughter populations are similar, leading to an overestimation of the genetic distance by up to a factor of two (¢gure 2). (c) A new approach: estimation of the parameters of the model from molecular data
As shown in ¢gure 2, a simple population size weighting scheme for the coalescence times within populations does not entirely remove the bias introduced by the bottleneck. Most of the time this information is also simply not available. We
84
O. E. Gaggiotti and L. Exco¤er
Genetic distances between populations of unequal sizes
Table 1. Average values and mean-square errors (in parentheses) for estimates of N 0 normalized to one divergence time (t/N0 ) k 0.99 0.90 0.50
0.05
0.1
0.5
1.0
1.0165 (0.2846) 1.0119 (0.4007) 0.9861 (0.6117)
1.0400 (0.2544) 1.0224 (0.3010) 1.0259 (0.5329)
1.0264 (0.2812) 0.9916 (0.2276) 1.0112 (0.2347)
0.9729(0.2055) 0.9836 (0.2357) 0.9563 (0.1762)
Table 2. Average values and mean-square errors (in parentheses) for estimates of the relative size k divergence time (t/N0) k 0.99 0.90 0.50
0.05
0.1
0.5
1.0
1.043 (0.0084) 0.892 (4.2128) 0.494 (41.3768)
1.031 (0.0050) 0.928 (0.2238) 0.601 (4.1393)
0.993 (0.0004) 0.919 (0.0081) 0.512 (0.0723)
0.988 (0.0001) 0.891 (0.0047) 0.499 (0.0369)
Table 3. Average values and mean-square errors (in parentheses) for estimates of the relative divergence time t/N0 divergence time (t/N 0) k 0.99 0.90 0.50
0.05
0.1
0.5
1.0
0.0404 (0.2054) 0.0199 (0.1729) 0.0546 (0.6675)
0.0809 (0.2250) 0.0663 (0.2191) 0.0818 (0.3313)
0.5086 (0.4724) 0.5127 (0.6306) 0.4769 (0.3773)
0.9760 (0.6989) 1.0443 (0.8713) 1.0572 (0.8587)
therefore propose to estimate all the parameters of the model simultaneously, i.e. the divergence time between populations (t), the ancestral population size (N0) and the relative size of the daughter populations (k). We note that, under the in¢nite-site model, the average number of pairwise di¡erences (p) within and between populations is simply proportional to the coalescence times as E(pi ) ˆ 2 E(t0i) (i ˆ1, 2) and E(p 12 ) ˆ 2 E(t1). This suggests that, with molecular data, the parameters of the model can be estimated by solving a system of three nonlinear equations derived from equations (3) and (5): 9 p1 ˆ 1 ‡ 2 Q 1 , = p2 ˆ 2 ‡ 1 Q 2 , , (14) ; p 12 ˆT ‡ 0 ,
where 0 ˆ 2 N0, 1 ˆk 0 , 2 ˆ (17k) 0 , Q i ˆ eT = i and T ˆ 2 t. The three unknowns to estimate are here 0, k and T. Unfortunately, no analytical solution is available and the system of equations (10) and (11) must be solved numerically. This can be done using Newton’s method of successive approximations (see, for example, Abramovitz & Stegun 1970, p.18), which can, for example, be implemented either in the Mathematica program (Wolfram 1993) or the numerical routines available in Press et al. (1992, e.g. Broyden’s method, p. 389). To validate this approach, we performed coalescent simulations derived from Hudson’s (1990) algorithm for di¡erent divergence times and daughter population sizes using an ancestral population size of 100 000 haploid individuals. For each simulation condition, the coalescent trees Proc. R. Soc. Lond. B (2000)
of 1000 pairs of populations were simulated and the parameters of the model were estimated from the average coalescence times within and between populations (thus directly from equations (3) and (5)). The results are presented in tables 1^3 for the parameters N0 , k and t, respectively. The ancestral population size appears to be relatively well estimated for all simulation conditions and the variance of the estimator decreases with divergence time (table 1). Note that, for a small divergence time (t/N 040.1), the estimations seem to have a smaller dispersion for very uneven (k ˆ 0.99) than for even (k ˆ 0.5) daughter population sizes. The relative population size factor (k) also seems to be on average quite well estimated (table 2), although its mean-square error is much larger for small divergence times and more even population sizes. Small divergence times frequently also lead to negative values and relatively long divergence times are needed (t/N050.5) for the estimations to become reasonably accurate. The estimations of the divergence time t/N 0 are generally very close to their true values for a wide range of simulation conditions (table 3). As for the other parameters, the mean-square errors are proportionally larger for short than for large divergence times. To investigate the e¡ect of ignoring unequal population sizes, we have reported the estimation of the divergence time t/N0 proposed by Slatkin (1995) as t/N0 ˆ w/(17 w) for a demographic model where the ancestral and daughter populations are of the same size (see table 4). As expected, the conventional estimator of the divergence time greatly overestimates the population divergence
Genetic distances between populations of unequal sizes
O. E. Gaggiotti and L. Exco¤er
85
Table 4. Comparison between the estimation of the divergence time using either the present method (GE) or Slatkin’s (1995) genetic distance (S) obtained as t/N0 ˆ /(1 ¡ ) assuming constant and equal population sizes (The values are average estimations over 1000 simulations. The mean-square errors are given in parentheses.) k 0.90
0.99 S
t/N0 0.05 0.1 0.5 1.0
1.1047 (1.9021) 1.2282 (2.5839) 2.3878 (8.9273) 3.6559 (16.9690)
GE 0.0384 (0.1971) 0.0813 (0.2201) 0.5072 (0.4786) 0.9796 (0.7910)
S 0.3188 (0.2134) 0.6404 (0.8568) 2.1861 (9.8994) 3.5407 (14.8088)
0.50 GE
S
GE
0.0210 (0.1642) 0.0502 (0.1536) 0.4953 (0.5871) 0.9984 (0.7333)
0.1060 (0.0222) 0.2267 (0.1013) 1.5674 (4.8438) 3.2439 (12.6536)
0.0963 (0.7737) 0.0616 (0.2392) 0.5031 (0.4888) 1.0875 (0.8044)
Table 5. Average values and mean-square errors (in parentheses) for standardized estimates of the demographic parameters when there is population growth (l ˆ 1.01 represents 1% growth per generation and l ˆ 1.05 represents 5% growth per generation. N0 ˆ 100 000 and k ˆ 0.9.) l ˆ 1.01
l ˆ 1.05
t/N0
N^ 0/N0
k
t^ /N0
N^ 0/N 0
k
t^ /N0
0.05 0.1 0.5 1.0
1.021 (0.485) 1.031 (0.296) 0.996 (0.237) 1.008 (0.249)
0.977 (1.650) 0.928 (0.138) 0.921 (0.008) 0.890 (0.005)
0.020 (0.372) 0.063 (0.134) 0.476 (0.576) 0.940 (1.385)
1.050 (0.518) 1.016 (0.353) 0.973 (0.237) 1.002 (0.219)
0.773 (18.430) 0.930 (0.230) 0.914 (0.012) 0.892 (0.005)
0.012 (0.431) 0.081 (0.206) 0.515 (0.702) 1.015 (1.723)
times for uneven daughter population sizes, particularly for short divergence times where the relative error on the estimate is much larger than for larger divergence times, in keeping with previous results (Chakraborty & Nei 1977; ¢gure 1). For even daughter population sizes (k ˆ 0.5), Slatkin’s (1995) estimator of t/N 0 as w/(1 ¡ w ) overestimates the true divergence time by a factor of two to three, a bias which increases here with divergence time. Note that this behaviour is opposite to that in ¢gure 1 where we plotted the bias for the genetic distance w or da, which is larger for small divergence times. Our estimator appears much less biased over the whole parameter range and has a much smaller associated mean square error than the conventional estimator. (d) E¡ect of population growth on parameter estimation
The estimation method presented here is based on a model which assumes constant sizes after the population split, but this assumption is likely to be violated. We have investigated to what extent population growth can bias the estimates of the demographic parameters by simulating populations which could grow exponentially at the same rate after the split. The results of these simulations are presented in table 5. We ¢nd that population growth does not have much e¡ect on the estimation procedure, as the average values and mean square errors are very similar to those obtained when the daughter populations remain at a constant size after the split (see tables 1^3). 3. APPLICATION TO HUMAN±CHIMPANZEE DIVERGENCE
We compared the genetic diversity of 222 chimpanzees (Pan troglodytes) to that of 2996 humans analysed for their Proc. R. Soc. Lond. B (2000)
mtDNA diversity (¢rst hypervariable region (HV1), nucleotides 16 043^16360). The chimpanzee data were described in Exco¤er & Yang (1999) and the human data set covers 76 populations worldwide (available from L.E. upon request). The mean numbers of inferred pairwise di¡erences within and between populations were computed under the Kimura two-parameter model taking into account the heterogeneity of the mutation rates, which are assumed to follow a gamma distribution ( Jin & Nei 1990) with shape parameter equal to 0.40 (Exco¤er & Yang 1999). All the computations were made using the Arlequin software program (Schneider et al. 1999). The mean numbers of pairwise di¡erences within humans, within chimpanzees and between humans and chimpanzees were found to be p^ 1 ˆ 6:32, p^ 2 ˆ 26:62 and p^ 12 ˆ 80:51, respectively. These numbers lead to the following estimated parameter values: ^0 ˆ 32:04, k^ ˆ 0:80 and T^ ˆ 48:47. These results suggest that the ancestral population size of the chimpanzee is four times larger than that of the human species, in keeping with a recent phylogenetic study (Gagneux et al. 1999). Empirical con¢dence intervals (CIs) around those estimates were inferred by a coalescent simulation procedure. The estimated parameters were used as input values for simulating 1000 random samples of 222 chimpanzees and 2996 human sequences of 277 nucleotides. New estimates of 0 , k and T were estimated each time to obtain their empirical distributions. The 2.5 and 97.5 percentile values of the distributions were used as the limits of the 95% CIs. The means of each distribution and their 95% CIs were obtained as *0 ˆ 32.13 (95% CI 15.33^67.02), ¡ k* ˆ 0.77 (95% CI 0.51^0.94) and T * ˆ 47.38 (95% CI 14.72^124.15). The mean values are very close to the initial estimates and the CIs are found to be asymmetrical
86
O. E. Gaggiotti and L. Exco¤er
Genetic distances between populations of unequal sizes
around the means. It is interesting to note that the value of 0.5 is not found within the CI for k, suggesting that, assuming a similar mutation rate and mutation pattern in both species (Exco¤er & Yang 1999), human and chimpanzee female population sizes are signi¢cantly di¡erent. Using an average mutation rate of 4.2 10¡8 per site per year for HV1 (Vigilant et al. 1989), which is assumed to be known without error, the divergence time between humans and chimpanzees is found to be 2 083119 years (95% CI 632 629^5 335 654), a value much smaller but not incompatible with previous estimates of around ¢ve million years (e.g. Horai et al. 1992; Takahata et al. 1995). 4. DISCUSSION
When population ¢ssion leads to divergent populations of unequal sizes, we expect the standard genetic distances between populations to overestimate the divergence times severely, particularly if the relative sizes of the descending populations are not taken into account (¢gures 1 and 2). It is thus worrying that most inferences about the genetic a¤nities between populations are based on pairwise distance matrices which assume constant population sizes over the entire evolutionary process. It is therefore likely that populations having gone through a recent bottleneck are often wrongly interpreted as very divergent from all the other populations. While our pure ¢ssion model appears closer to real situations than previous models, natural populations could have had a much more complex demographic history. For instance, subsequent bottlenecks could occur after population divergence, some gene £ow could be maintained between nearby populations, populations could have variable population sizes after their divergence (Marjoram & Donnelly 1997) or the sum of the sizes of the daughter populations could be di¡erent from that of the mother population (e.g. Wakeley & Hey 1997). In this regard, many human populations are indeed believed to have gone through recent expansions, while others, such as hunter^gatherers, could have gone through recent bottlenecks (Exco¤er & Schneider 1999). Population growth after population divergence has little in£uence on the parameters estimated (table 5). Even in the case of a 5% increase per generation, which translates into a doubling of population size every 14 generations, the estimation procedure appears quite reliable. The e¡ect of migration after population divergence has not been studied here, but it should obviously lead to an underestimation of the divergence time between populations and lead to biased relative population sizes, making them more similar than they are. The genetic a¤nities of these populations as measured by conventional distances could thus partly re£ect unequal demographies rather than re£ecting their separation histories. The derivations presented here should therefore not be considered as de¢nitive and there is ample room to re¢ne the model and adapt it to particular situations. For instance, the behaviour of our methodology in the case of pairs of populations not having diverged directly but indirectly, such as through the ancestor of one of the populations, remains to be investigated. Such a study should prove useful in the context of population phylogenetic reconstruction. Proc. R. Soc. Lond. B (2000)
The potential biases introduced by bottlenecks and unequal population sizes have been mentioned repeatedly in the literature (e.g. Chakraborty & Nei 1977; Nei 1990; Relethford 1996) but no speci¢c method has been devised to correct these biases. By simultaneously estimating the divergence times, size of the ancestral population and relative size of the daughter populations, we directly take into account the bottleneck e¡ect at the time of the population split and the unequal amount of drift in the descendant populations. On the other hand, weighting population diversities by their sizes only addresses the problem of unequal drift after the bottleneck, but does not correct for the initial bottleneck e¡ect. Note that if population size di¡erences translate into unequal amounts of gene £ow, as in the models of Relethford (1996) and Holsinger & Mason-Gamer (1996), correcting by relative population sizes should be very e¤cient as bottlenecks are not involved. Other methods have been proposed for estimating the parameters of the ¢ssion model. For example, Wakeley & Hey (1997) presented a least-squares method which uses the observed number of shared, ¢xed and exclusive polymorphic sites and, therefore, which makes use of another aspect of the available molecular information. However, we note that their method was restricted to data strictly following the in¢nite-site model, such as idealized DNA sequences. Because it is based on the coalescence times, our method could also be applied to data following the stepwise mutation model, such as microsatellite data. As already shown in the context of an admixture (Bertorelle & Exco¤er 1998), we could base our estimations on the average squared number of allele-length di¡erences in the microsatellite context (e.g. see Slatkin 1995). However, it is expected that a large number of microsatellite loci will be required to reach the same precision as that of DNA sequence data (Bertorelle & Exco¤er 1998). Even though our model appears simple, as it involves the resolution of a system of a mere three equations, this process may prove di¤cult in practice. The Newton^ Raphson method can give grossly inaccurate estimates when the initial estimates of the roots are far from the true root, because the search interval can include a local minimum of the function (Press et al. 1992, pp. 362^364). It often results in obtaining negative estimates for t, N0 or k. This problem can be limited by either using existing knowledge about the range of possible values which the di¡erent parameters may take or by repeating the estimation procedure from di¡erent starting points until reaching plausible values for the parameters. However, implausible values (negative estimates or k-values larger than one) can often be obtained when the divergence time is low (results not shown), that is when the degree of divergence within a population is larger than that between populations by chance alone. Note, however, that the net nucleotide di¡erence da and standard FST methods also lead to negative estimates in that case. Our method nevertheless seems best suited for long divergence times between populations or between species. While it was originally devised for estimating divergence times between populations, it can also be useful for determining the relative size of a population, a problem which often arises in conservation genetics.
Genetic distances between populations of unequal sizes We are grateful to two anonymous reviewers for their helpful comments on the manuscript. A Mathematica program to solve equations (10) and (11) is available from O.E.G. The method will also be incorporated into the Arlequin package, which is available on (http://anthropologie.unige.ch/arlequin). The human and chimpanzee mtDNA data used for this paper are available from L.E. upon request. This work was supported by Swiss National Science Foundation grants numbers 32^47053.96 and 31^054059.98 to L.E. and a European Science Foundation travel grant to O.E.G. REFERENCES Abramovitz, M. & Stegun, I. A. 1970 Handbook of mathematical functions. New York: Dover. Bertorelle, G. & Exco¤er, L. 1998 Inferring admixture proportions from molecular data. Mol. Biol. Evol. 15, 1298^1311. Cavalli-Sforza, L. L. & Edwards, A. W. F. 1967 Phylogenetic analysis: models and estimation procedures. Evolution 21, 550^570. Chakraborty, R. & Nei, M. 1974 Dynamics of gene di¡erentiation between incompletely isolated populations of unequal sizes. Theor. Popul. Biol. 5, 460^469. Chakraborty, R. & Nei, M. 1976 Hidden genetic variability within electromorphs in ¢nite populations. Genetics 84, 385^393. Chakraborty, R. & Nei, M. 1977 Bottleneck e¡ects on average heterozygosity and genetic distance with the stepwise mutation model. Evolution 31, 347^356. Charlesworth, B. 1998 Measures of divergence between populations and the e¡ect of forces that reduce variability. Mol. Biol. Evol. 15, 538^543. Cockerham, C. C. 1973 Analysis of gene frequencies. Genetics 74, 679^700. Exco¤er, L. & Schneider, S. 1999 Why hunter^gatherer populations do not show signs of Pleistocene demographic expansions. Proc. Natl Acad. Sci. USA 96, 10 597^10 602. Exco¤er, L. & Yang, Z. 1999 Substitution rate variation among sites in the mitochondrial hypervariable region I of humans and chimpanzees. Mol. Biol. Evol. 16, 1357^1368. Felsenstein, J. 1982 How can we infer geography and history from gene frequencies? J.Theor. Biol. 96, 9^20. Gagneux, P., Wills, C., Gerlo¡, U., Tautz, D., Morin, P. A., Boesch, C., Fruth, B., Hohmann, G., Ryder, O. A. & Woodru¡, D. S. 1999 Mitochondrial sequences show diverse evolutionary histories of African hominoids. Proc. Natl Acad. Sci. USA 96, 5077^5082. Goldstein, D. B., Ruiz-Linares, A., Cavalli-Sforza, L. L. & Feldman, M. W. 1995 Microsatellite loci, genetic distances, and human evolution. Proc. Natl Acad. Sci. USA 92, 6723^6727. Holsinger, K. E. & Mason-Gamer, R. J. 1996 Hierarchical analysis of nucleotide diversity in geographically structured populations. Genetics 142, 629^639. Horai, S., Satta, Y., Hayasaka, K., Kondo, R., Inoue, T., Ishida, T., Hayashi, S. & Takahata, N. 1992 Man’s place in Hominoidea revealed by mitochondrial DNA genealogy. J. Mol. Evol. 35, 32^43. Hudson, R. R. 1990 Gene genealogies and the coalescent process. In Oxford surveys in evolutionary biology (ed. D. J. Futuyma & J. D. Antonovics), pp.1^44. New York: Oxford University Press. Jin, L. & Nei, M. 1990 Limitations of the evolutionary parsimony method of phylogeneticanalysis. Mol. Biol. Evol.7, 82^102. Kingman, J. F. C. 1982a The coalescent. Stoch. Proc. Appl. 13, 235^248. Kingman, J. F. C. 1982b On the genealogy of large populations. J. Appl. Prob. A 19, 27^43.
Proc. R. Soc. Lond. B (2000)
O. E. Gaggiotti and L. Exco¤er
87
Mahalanobis, P. 1936 On the generalized distance in statistics. Proc. Natl Inst. India B 2, 49^55. Marjoram, P. & Donnelly, P. 1997 Human demography and the time since mitochondrial Eve. In Progress in population genetics and human evolution (ed. P. Donnelly & S. Tavare¨), pp. 107^131. New York: Springer. Nei, M. 1972 Genetic distance between populations. Am. Nat. 106, 283^292. Nei, M. 1973 Analysis of gene diversity in subdivided populations. Proc. Natl Acad. Sci. USA 70, 3321^3323. Nei, M. 1982 Evolution of human races at the gene level. In Human genetics: Proceedings of the Sixth International Congress of Human Genetics. A. The unfolding genome (ed. R. M. Goodman, B. Bonne-Tamir & T. Cohen), pp. 167^181. New York: Alan R. Liss, Inc. Nei, M. 1990 A simple method for estimating average number of nucleotide substitutions within and between populations from restriction data. Genetics 125, 873^879. Nei, M. & Li, W. H. 1979 Mathematical model for studying genetic variation in terms of restriction endonucleases. Proc. Natl Acad. Sci. USA 76, 5269^5273. Nei, M. & Tajima, F. 1983 Maximum likelihood estimation of the number of nucleotide substitutions from restriction sites data. Genetics 105, 207^217. Nei, M., Maruyama, T. & Chakraborty, R. 1975 The bottleneck e¡ect and genetic variability in populations. Evolution 29,1^10. Press, W. H., Teukolsky, S. A., Vetterling, W. T. & Flannery, B. P. 1992 Numerical recipes in C: the art of scienti¢c computing. Cambridge University Press. Relethford, J. H. 1991 E¡ect of changes in population size on genetic microdi¡erentiation. Hum. Biol. 63, 629^641. Relethford, J. H. 1996 Genetic drift can obscure population history: problem and solution. Hum. Biol. 68, 29^44. Relethford, J. H. & Harpending, H. C. 1995 Ancient di¡erences in population size can mimic a recent African origin of modern humans. Curr. Anthropol. 36, 667^674. Schneider, S., Roessli, D. & Exco¤er, L. 1999 Arlequin: a software for population genetics data analysis, v. 2.0. Department of Anthropology, University of Geneva, Switzerland. Slatkin, M. 1991 Inbreeding coe¤cients and coalescence times. Genet. Res. Camb. 58, 167^175. Slatkin, M. 1995 A measure of population subdivision based on microsatellite allele frequencies. Genetics 139, 457^462. Takahata, N. & Nei, M. 1985 Gene genealogy and variance of interpopulational nucleotide di¡erences. Genetics110, 325^344. Takahata, N., Satta, Y. & Klein, J. 1995 Divergence time and population size in the lineage leading to modern humans. Theor. Popul. Biol. 48, 198^221. Vigilant, L., Pennington, R., Harpending, H., Kocher, T. D. & Wilson, A. C. 1989 Mitochondrial DNA sequences in single hairs from a southern African population. Proc. Natl Acad. Sci. USA 86, 9350^9354. Wakeley, J. & Hey, J. 1997 Estimating ancestral population parameters. Genetics 145, 847^855. Watterson, G. A. 1985 The genetic divergence of two populations.Theor. Popul. Biol. 27, 298^317. Weir, B. S. & Cockerham, C. C. 1984 Estimating F-statistics for the analysis of population structure. Evolution 38, 1358^1370. Wolfram, S. 1993 Mathematica. A system for doing mathematics by computer. Redwood City: Addison-Wesley Publishing Co. Wright, S. 1951 The genetical structure of populations. A. Eugen. 15, 323^354.
As this paper exceeds the maximum length normally permitted, the authors have agreed to contribute to production costs.